
Mini Market Lookback: Easy Street
In another crazy week of societal strife and more gasoline on the fire, the markets tune it out and keep the slow rally going.


Equities and credit both rallied with a slew of headlines this week on monetary and economic developments. The UST curve steepened with the combination of FOMC easing, constructive economic indicators, and signs of a stable consumer that will get checked again this coming week with the personal income and outlays release.
The past week saw decent numbers from Retail Sales and Industrial Production, but Home Starts were weak and mortgage rates moved higher off the recent lows.
This week we get final 2Q25 GDP line items, more housing sector data, and a fresh read on PCE inflation. It is hard to call for recession scenarios when consumers are shopping and manufacturing facilities are running along at a fair clip (see Home Starts August 2025: Bad News for Starts 9-17-25, Industrial Production Aug 2025: Capacity Utilization 9-16-25, Retail Sales Aug 2025: Resilience with Fraying Edges 9-16-25).
The FOMC meeting showed remarkable unity on slow easing with only a single call for a -50 bps cut, but the FOMC brought more optimism around 3 cuts in 2025 and expectations of more in 2026. At the same time, the Summary of Economic Projections (“SEP report”) were not bullish on growth with sub-2% GDP growth rates for this year and beyond into 2028 (see FOMC: Curve Scenarios Take Wing, Steepen for Now 9-17-25).
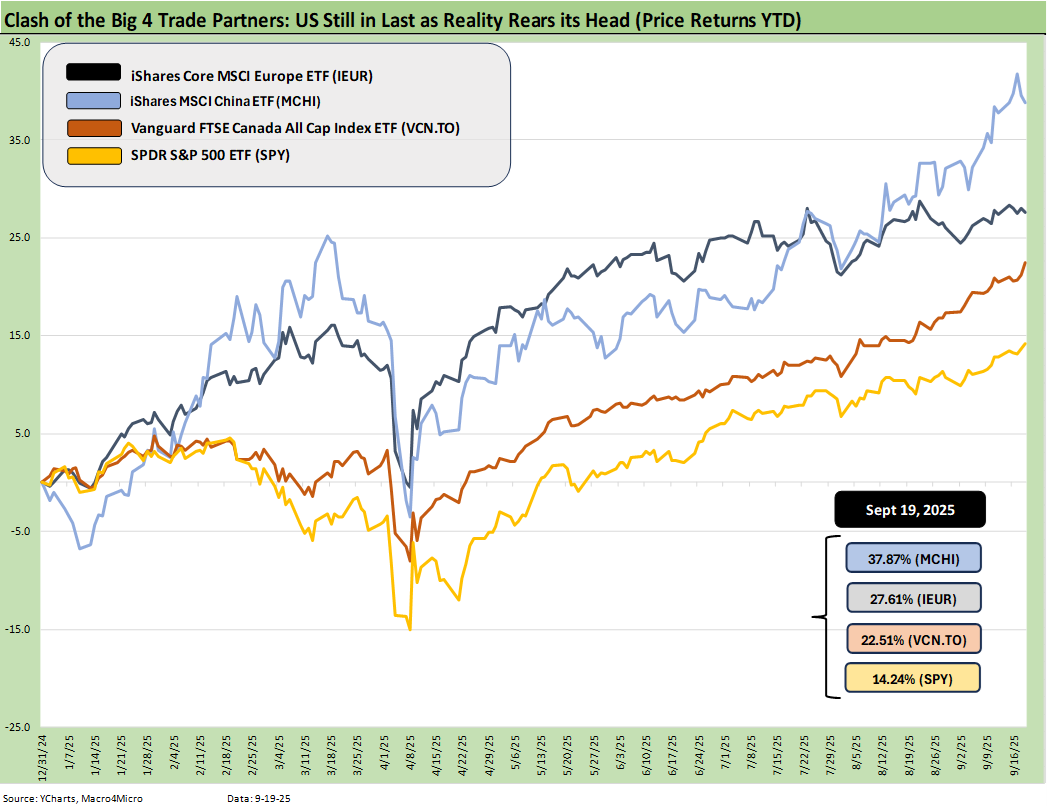
The above updates the YTD returns for some bellwether index ETFs for the Big 4 developed market trading partners – the US, Europe, China, and Canada. The aim is to plot some ETFs that tell a story for US investors thinking about global diversification. These ETFs are just a useful sample that uses relevant broad market indexes for each region as snapshots.
The goal is to capture the balance of risks across the broad mix of macro trends (economy, currency) and the sea level industry and company fundamentals rolled up into a US traded ETF. For the US, we use the S&P 500 ETF (SPY) as a proxy.
The weak dollar impact has been a major factor, and we have seen a growing level of street research highlighting the massive growth in hedging the dollar when buying US assets. The above chart highlights that hedging has been a good strategy with US stocks doing well but the dollar performing horribly.
The underlying cause of the dollar posting one of the worst selloffs in decades is a can of worms we have looked at in the past. More recently, we see commentary indicating a lack of faith in US political stability and quality of governance as part of the headwind. The reality of a low single A tier or BBB tier quality sovereign balance sheet shown by the US does not help. The UST gets a lot of subjective support for its credit ratings. A rating agency that takes UST ratings lower would see the wrath of Trump.
The chart above shows the US remaining in last place with the dollar the main culprit. That is not much for bragging rights at a time when many global investors and national leadership ranks are already quite annoyed with the direction of US policy. Whether that will flow into UST appetites is a wildcard. Alternatively, amped up hedging and lower rates could keep that pressure on the dollar.
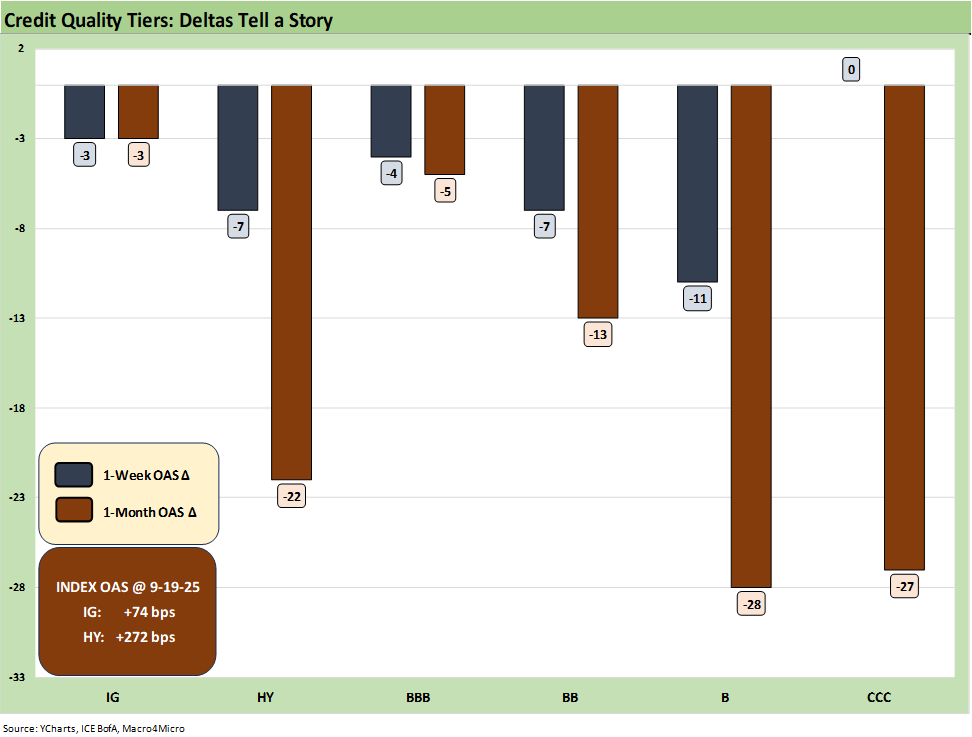
The above chart frames the 1-week and 1-month spread deltas for IG and HY and the BBB tier and below. The +74 bps in IG and +272 bps in HY are in line with past credit cycle peaks with IG more in line with 1997 and HY consistent with the credit bubble of June 2007.
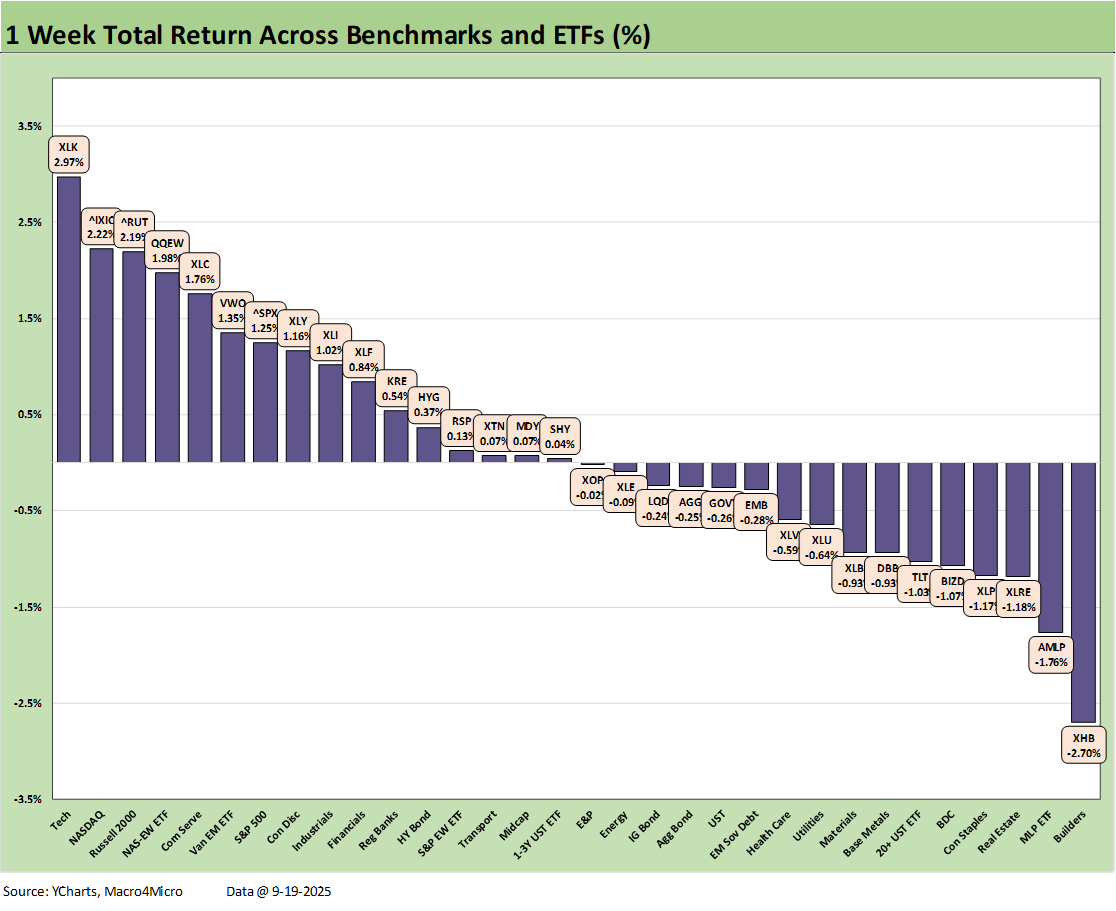
The above chart posts the trailing 1-week returns across the 32 benchmarks and ETFs we watch. We see tech-centric ETFs and tech-heavy large caps leading the ranks in the top quartile. The Tech ETF (XLK) is on top joined in the top 5 by NASDAQ, the Equal Weight NASDAQ 100 ETF (QQEW) and Communications Services (XLC).
The rising share of the large cap benchmarks held by major tech names are wagging those benchmarks (S&P 500, NASDAQ), but the Russell 2000 small caps also hit an all-time high this week and ranked in the #3 position for the week in the top quartile. As of last week, the Top 8 names (Mag 7 + Broadcom) added up to around 37% of the S&P 500 index.
For all the headlines on “record highs,” we only see a 16-16 score above in positive vs. negative across the 32 lines. For the S&P 500 in the top quartile above, the balance across the 11 S&P 500 sectors was 5 positive, 5 negative, and 1 flat. In other words, a good headline performance but a lot going on under the hood.
We see the Homebuilder ETF (XHB) starting to get rolled back again and was sitting in last place on the week. Lennar reported a disappointing quarter and home started were weak (see Home Starts August 2025: Bad News for Starts 9-17-25).
The FOMC action did not see UST curve relief in the 10Y while mortgages have been erratic of late. The 30Y mortgage rate had rallied to a 6.1% handle before ending the week with a sell-off to 6.25% (Mortgage News Daily Survey). We see the long duration UST ETF (TLT) ending up in the bottom quartile this week.
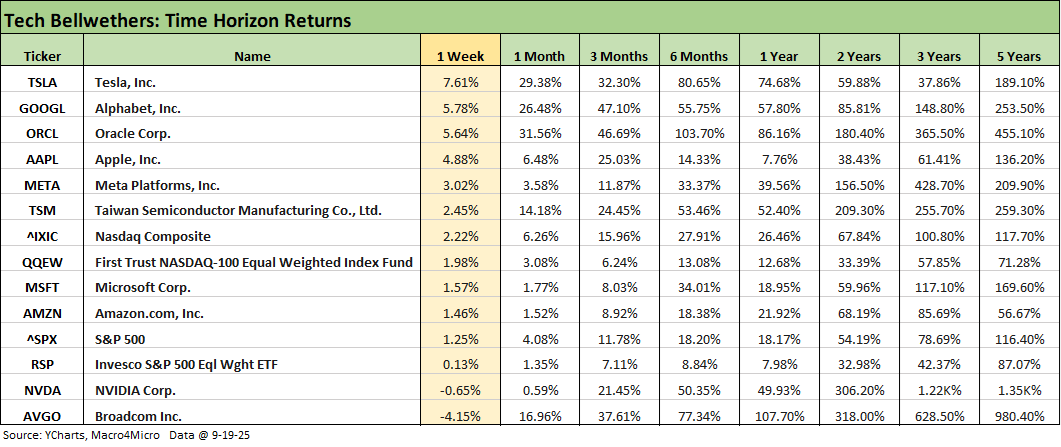
The tech bellwethers above had a solid week with 6 of the Mag 7 ahead of the S&P 500 and Oracle weighing in at #3 for the week. Broadcom lagged this week in last place with -4.15%, but that comes in the context of a 17% month and +37.6% rolling 3 months. Taiwan Semi also beat the NASDAQ and 3 of the Mag 7.
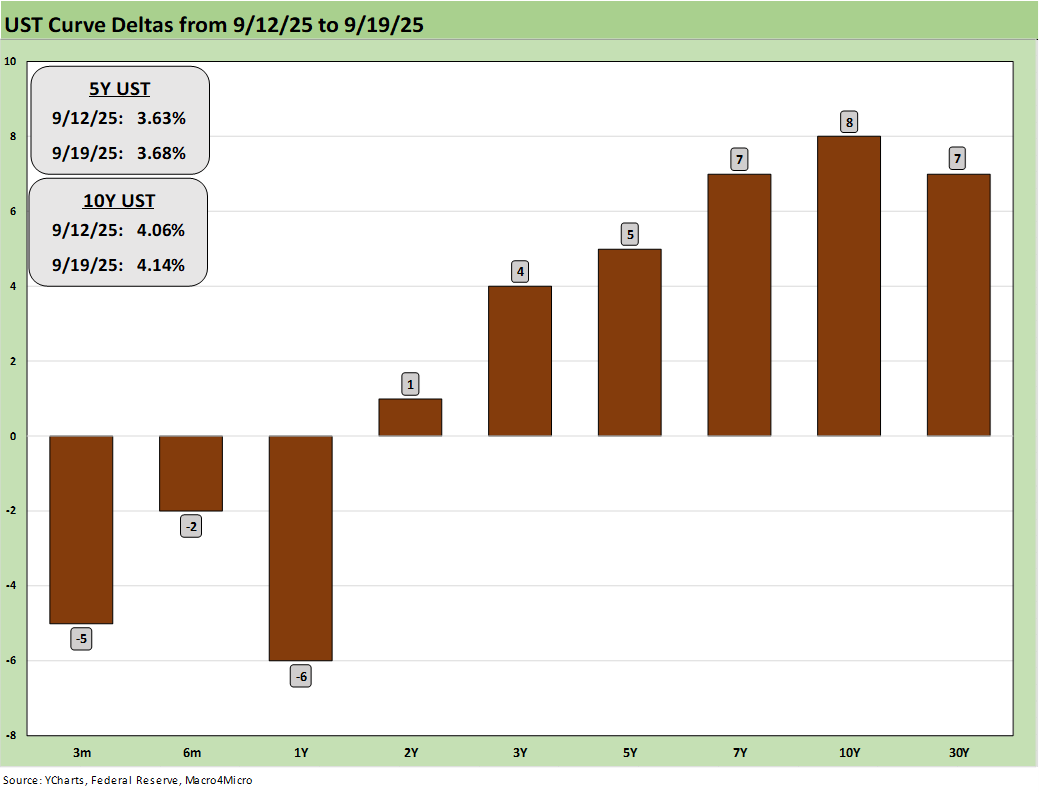
The above chart updates the 1-week UST deltas as the market had mixed reactions to the FOMC action and color provided (see FOMC: Curve Scenarios Take Wing, Steepen for Now 9-17-25). This week brings another set of PCE data points with the following week bringing JOLTS and Payroll, so there are plenty of tests ahead on the dual mandate toggle priorities.
The inflation and tariff impacts are still in the earlier stages with so much in tariff expense ahead and a lot of strategic decisions to be made by the companies that feel the tariff expense lines now and even more later. The tariff advocates and disinformation specialists are trying to treat this topic like a game with a buzzer that they have already sounded. From what we read in the trade rags of some of the most tariff-exposed industries (e.g. autos) an extraordinary amount of uncertainty lies ahead even beyond the SCOTUS IEEPA decision.
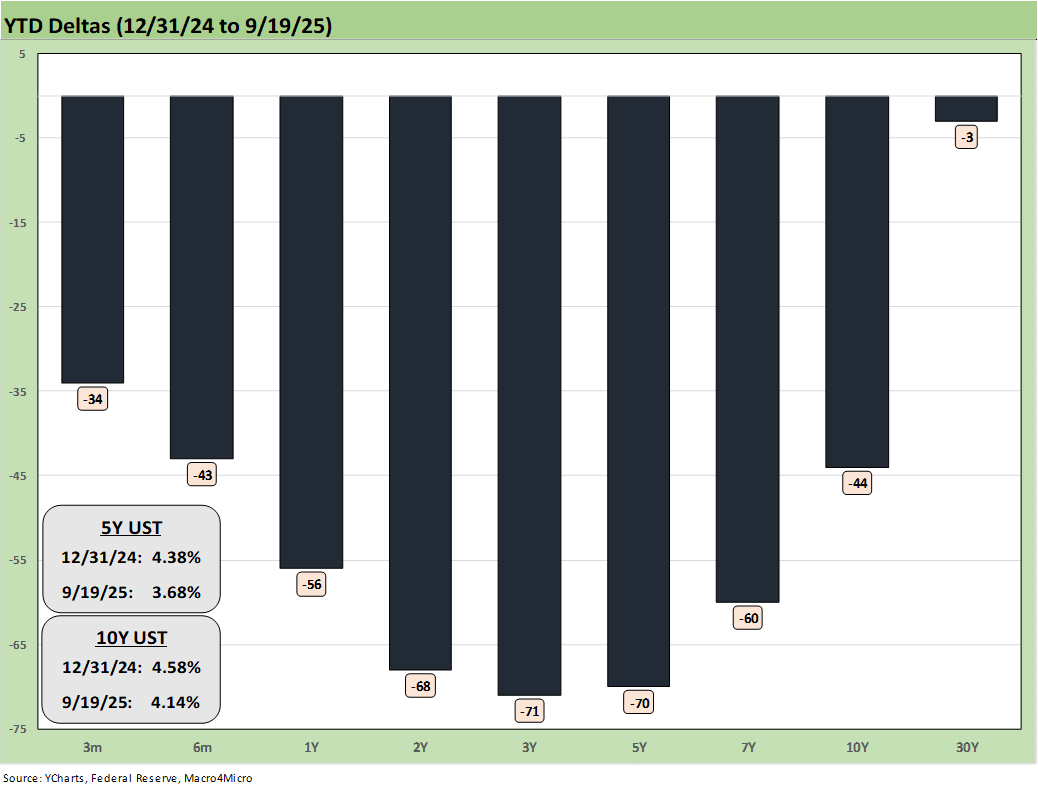
The above chart recaps the YTD UST deltas as the bond returns and equity returns have seen support in equity valuation as well as FOMC easing handicapping with the long end still a mixed story. The -44 bps in the 10Y UST will be a tricky balancing act to monitor after we saw the steepening in the aftermath of the late 2024 easing. We look at that topic in the weekly UST commentary to be posted later.
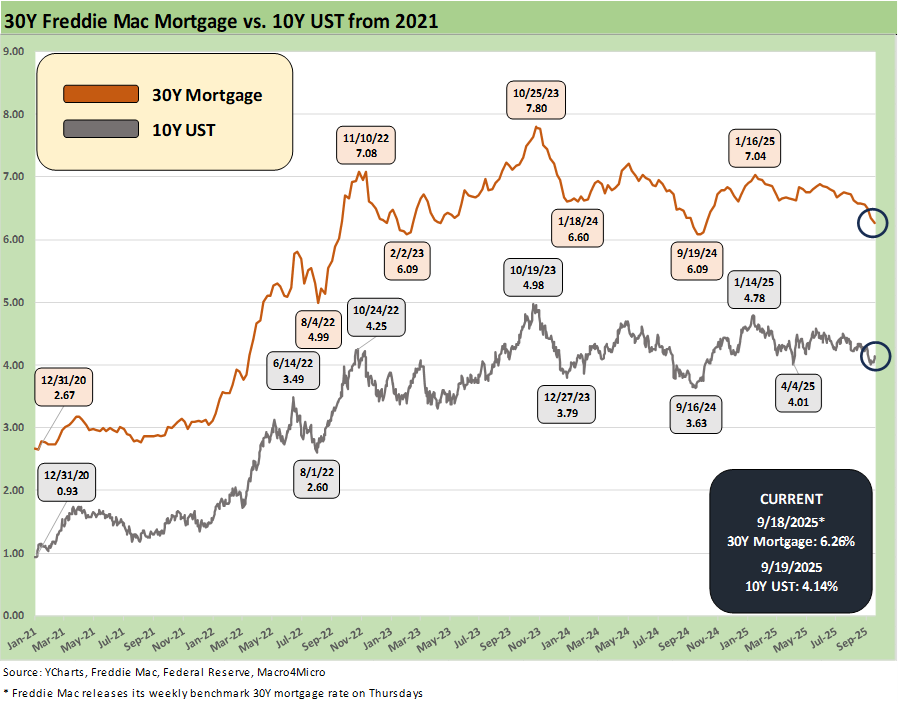
The above chart updates the running time series for the 30Y Freddie Mac Mortgage benchmark (set midday Thursday) with unfavorable variances for both this past week.
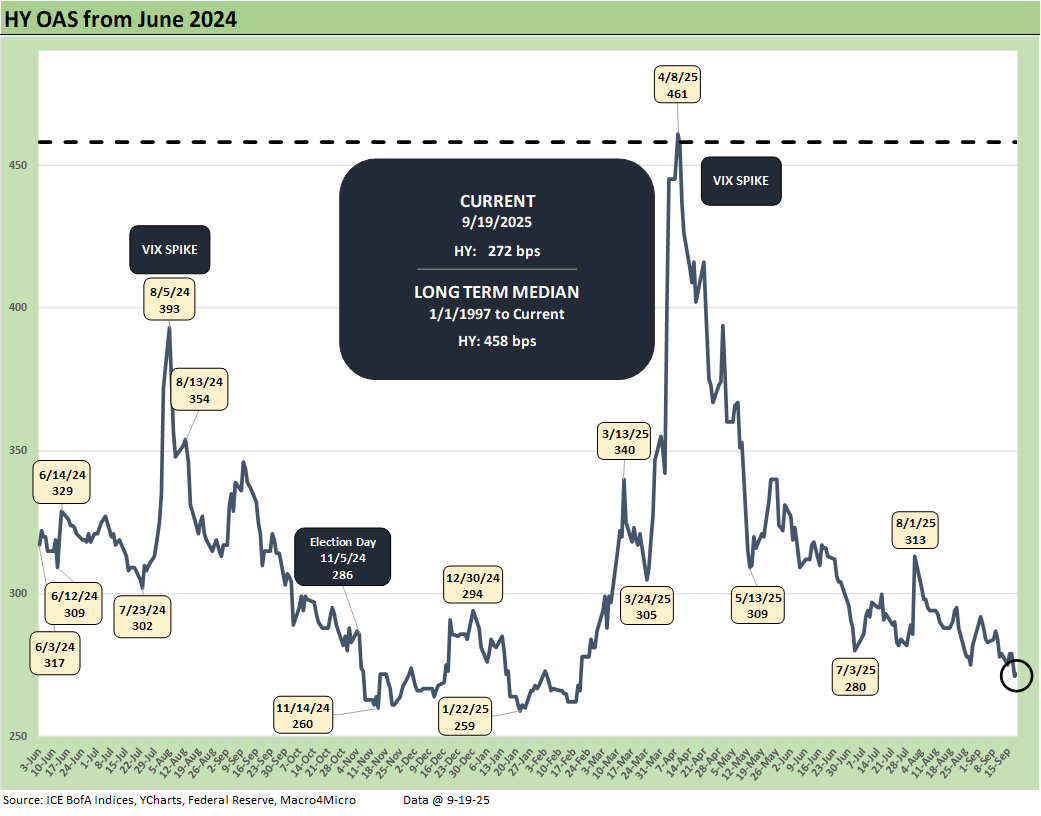
The above chart plots the HY OAS from June 2024, and we see a -7 bps move tighter on the week to +272 bps from +279 bps last week and from +283 bps the week before. That HY index OAS is still in the bubble zone of June 2007.
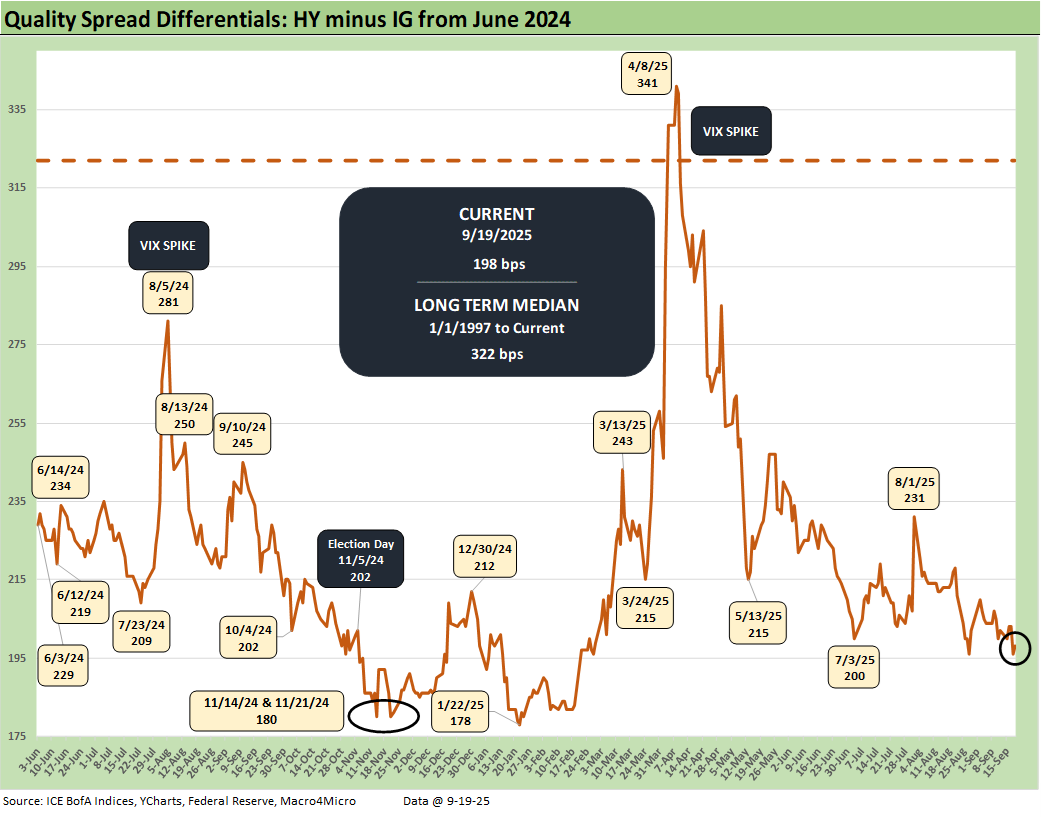
The above chart updates the quality spread differentials for HY vs. IG with “HY OAS minus IG OAS” -4 bps tighter on the week to +198 from +202 bps with HY -7 bps tighter and IG -3 bps tighter.
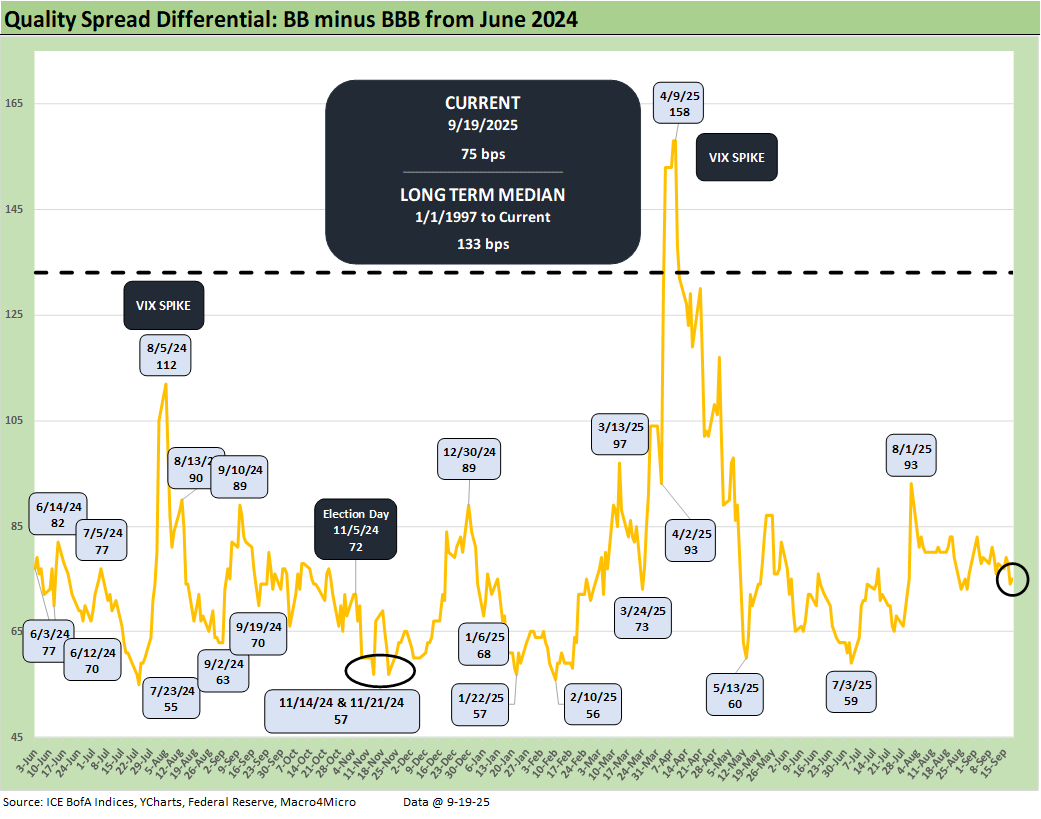
The above chart shows the “BB OAS minus BBB OAS” quality spread differential tightened by -3 bps to +75 bps over the week with the BB tier -7 bps tighter and the BBB tier -4 bps tighter. The BBB vs. BB OAS differential remains wide to the early July levels around +59 bps and +56 bps in Feb 2025.
See also:
FOMC: Curve Scenarios Take Wing, Steepen for Now 9-17-25
Home Starts August 2025: Bad News for Starts 9-17-25
Industrial Production Aug 2025: Capacity Utilization 9-16-25
Retail Sales Aug 2025: Resilience with Fraying Edges 9-16-25
Credit Markets: Quality Spread Compression Continues 9-14-25
The Curve: FOMC Balancing Act 9-14-25
Footnotes & Flashbacks: Asset Returns 9-14-25
Mini Market Lookback: Ugly Week in America, Mild in Markets 9-13-25
CPI August 2025: Slow Burn or Fleeting Adjustment? 9-11-25
PPI Aug 2025: For my next trick… 9-10-25
Mini Market Lookback: Job Trends Worst Since COVID 9-6-25
Payrolls Aug 2025: Into the Weeds 9-5-25
Employment August 2025: Payroll Flight 9-5-25
JOLTS July 2025: Job Market Softening, Not Retrenching 9-3-25
Hertz Update: Viable Balance Sheet a Long Way Off 9-3-25
Mini Market Lookback: Tariffs Back on Front Burner 8-30-25
PCE July 2025: Prices, Income and Outlays 8-29-25
2Q25 GDP: Second Estimate, Updated Distortion Lines 8-28-25