
Mini Market Lookback: Absence of Bad News Reigns
Equity benchmarks rallied on a mild CPI release, HY spreads got back into the June 2007 range, and UST was mixed.


I think I need a ballroom.
Headwinds are on the way for many consumers (old and young), but 3Q25 earnings season remains reassuring. The UMich consumer sentiment edged lower this past week with a slight decline in year-ahead inflation expectations to 4.6% (from 4.7%) and a small increase in long-term inflation expectations to 3.9% (from 3.7%). With the new Social Security COLA increased to 2.8%, that leaves the “old folks” with negative real COLA and in effect a purchasing power pay cut for 2026.
The CPI for September posted 3% handles with headline CPI ticking higher to 3.0% and core ticking lower to 3.0%. In December 2024 (Biden’s last month in office), headline CPI was 2.9%, so the battle is a slow one to say the least. Trump gets no bragging rights in the 9-month CPI run. The moving parts take some digging for sequential monthly rises by product line, but a useful metric we like is “All Items Less Shelter” CPI, which was only +2.7% YoY or higher by +0.2% from August. That “All Items Less Shelter” CPI was only 1.9% in Dec 2024 in Biden’s last full month, so that is going in the wrong direction.
The Shelter CPI is a derived number with a lot of asterisks (e.g. Owners’ Equivalent Rent) and that was flat at +3.6%, or down around 1 point this year. Food is higher as is Medical. Housing affordability remains terrible, and the derived shelter CPI has little relevance for many with rising home values and locked in 3%-4% handle mortgages in the “cash-in cash-out” monthly budget. The other CPI line items matter more with electricity, piped gas, food, and recreation being more of a variable cash cost in their budgets (see CPI September 2025: Headline Up, Core Down 10-24-25)
Nov 1 is a focal point for health care premiums given the shutdown acrimony and the Open Enrollment date for ACA. We see war stories creeping into the media of 2x and 3x premium increases for consumers with the worst multiples (e.g. over 4x) getting camera time during a toxic political backdrop. Kaiser cites ACA premium increases rising from an average of $888 in 2025 to $1904. The math is subject to assumptions, but Kaiser Foundation offers a wealth of data. The health care premium pain will spread to employer plans also but on a much smaller % scale.
President Reagan was back in the news on a Canadian-sponsored commercial depicting Reagan as an ardent “free trader” and against tariffs (except when absolutely necessary and very narrowly applied). I was covering autos and steel on the buy side and later sell side during the Reagan years, and that assertion on Reagan and free trade is 100% accurate. The games Washington types play. Trump terminated any more talks with Canada, which was more about the usual petulant tantrum drama (the market yawned). After all, the tariffs are in place, the tariff cash flow is incoming, and Canada has essentially surrendered at this point. The mistake Trump made in going off the rails was that his “noise” convinced millions to review the entire Reagan speech.
Other news this week includes efforts to assign Federal Monitors to California and New Jersey elections as the ugly games of 2026 begin. That will not help the tone in resolving the shutdown, which is now the second longest in history and closing in on the Trump 1.0 record. The House leader still refuses to swear in the deciding vote on the Epstein files (a Democrat Rep from AZ), so it never gets better. Finding where the ethics bar is set in Washington now requires a shovel. We stick by our formula of politics = policy = economics = business. Any payroll pain, dollar setbacks, consumer retrenchment, and project cancellations will exacerbate the current small business pain and undermine capex planning for 2026. Politics will be seen as the main cause, and the blame game PR will run through Nov 2026.
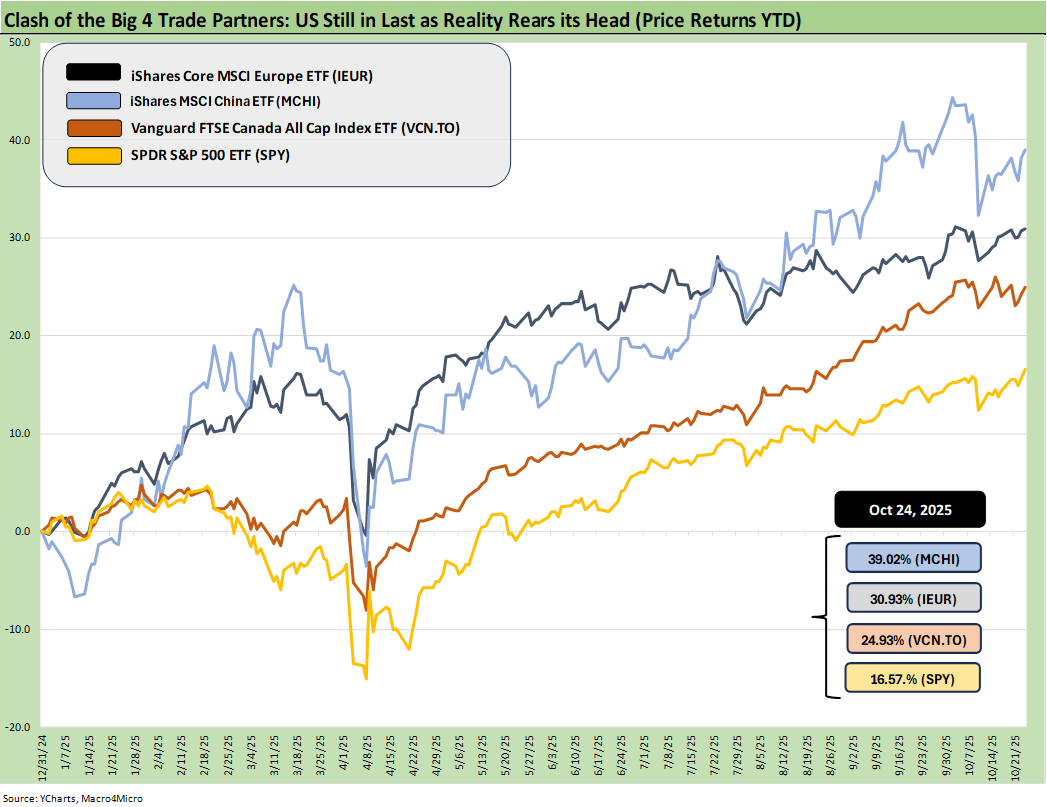
The above updates the YTD returns for some bellwether index ETFs for the Big 4 developed market trading partners – the US, Europe, China, and Canada. The aim of the chart is to plot some ETFs that tell a market story for US investors thinking about global diversification. These ETFs are just a useful sample that uses relevant broad market indexes for each region as snapshots.
The goal of this chart is to capture the balance of risks across the broad mix of macro trends (economy, currency) and the sea level industry and company fundamentals rolled up into a US traded ETF. Once again, the US is dead last YTD with a heavy influence of the dollar plunge in 2025.
The mild recovery in the dollar this week does not change the result. Dollar questions will remain a hot topic as rates move lower and political instability worsens. Hedged portfolios would look very different, but that is not the purpose of this chart.
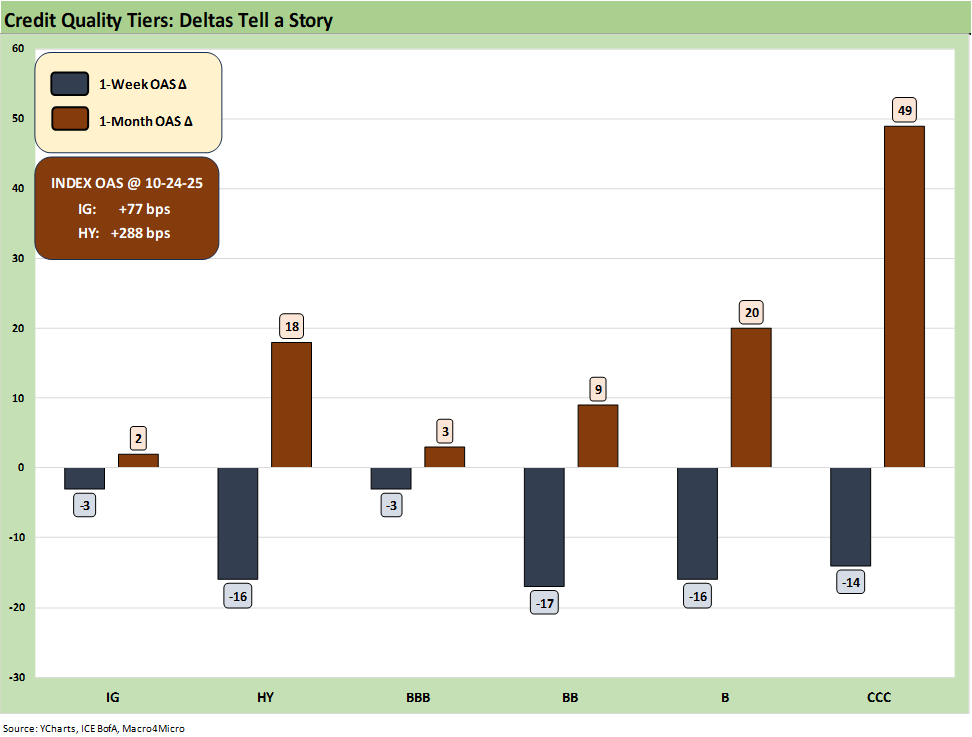
The above chart updates the rolling 1-week and 1-month OAS deltas for IG and HY and the credit tiers from BBB tier down to CCC. After a material widening three weeks ago, the credit benchmarks had an easy starting point to rally with earnings coming in strong, favorable consumer asset quality feedback from the banks for middle and upper tier consumers, and then solid numbers from bellwethers such as GM and Ford (see General Motors Update: Same Ride, Smooth Enough 10-23-25, Credit Profile: General Motors and GM Financial 10-9-25).
The autos are right in the middle of the tariff battle and a critical sector that reflects consumer willingness to reach for bigger ticket items. The autos face enormous challenges ahead, but the peak selling season in the spring flowed into a solid summer also. Team Trump also sent some good news to the industry with his constantly changing tariff programs, but this time autos got some relief with rebates that will cushion the blow of supplier sourcing for US made vehicles. GM gave that a loud shoutout for the tariff adjustment on their earnings call.
The rolling 1-month for HY is now +18 bps wider to +288 bps, which is now back in the June 2007 HY OAS band. At +77 bps, IG OAS remains in line with past credit cycle lows.
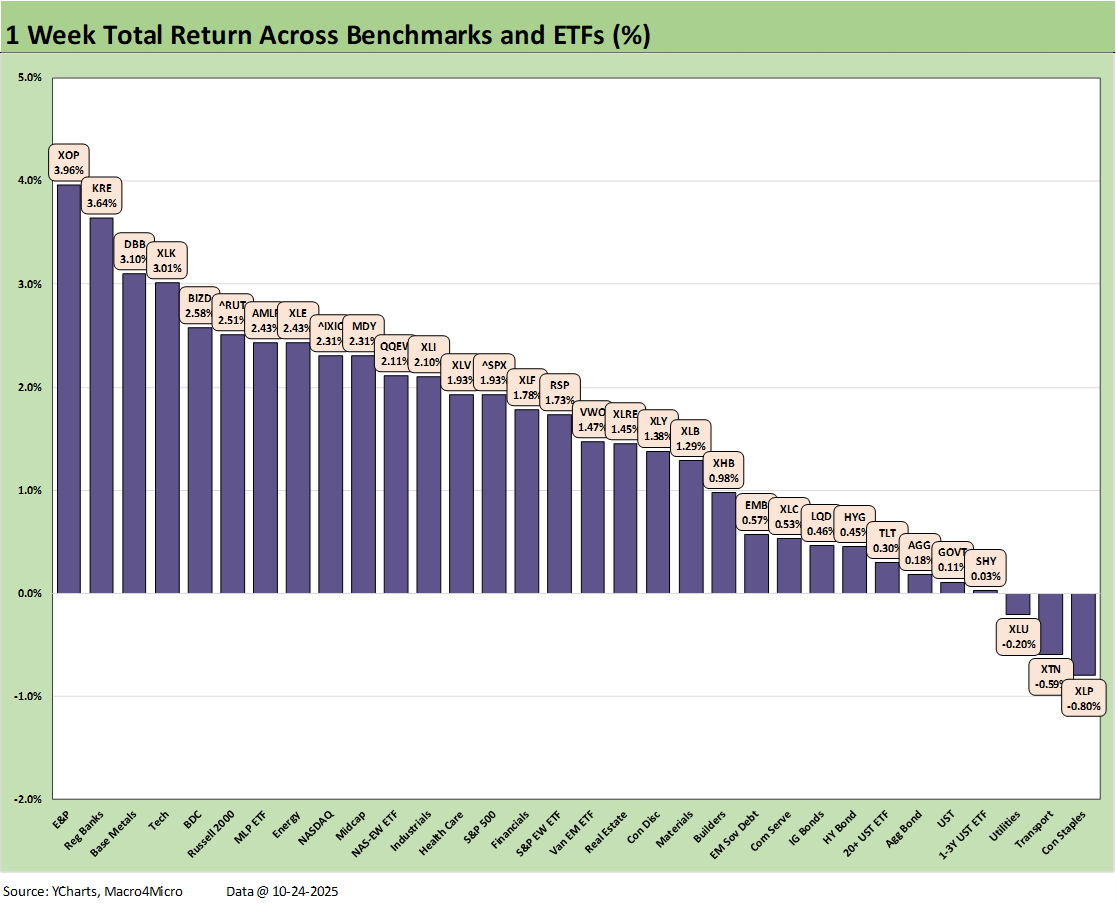
The above chart updates the weekly total returns for our 32 benchmarks with a positive vs. negative score of 29-3. The red zone included the defensive Consumer Staples ETF (XLP) Transports (XTN), and Utilities (XLU) .
The top rankings include some worst-shall-be-first bounces off the recent mini-panic in private credit with Regional Banks (KRE) and BDCs (BIZD) back in the top 5. E&P (XOP) rode the rebound in oil off the sanction headlines that Trump slapped on the major Russian Oil companies. Base Metals (DBB) and Tech (XLK) rounded out the top 5. The small cap Russell 2000 had another good week in the top quartile with Midstream Energy (AMLP) and the broad Energy ETF (XLE) joining the top tier
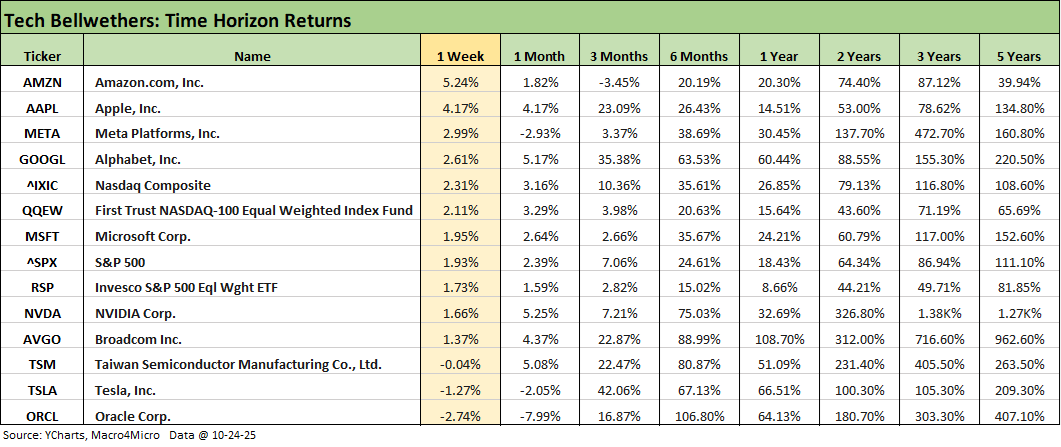
The above table updates the weekly returns across the Mag 7+3 (Broadcom, Taiwan Semi, Oracle). We see 5 of the Mag 7 ahead of the S&P 500 with NVIDIA and Tesla below the line. Amazon had a big week but has been lagging over 3 months. Oracle remains the big 6-month winner. Broadcom takes the title for the trailing 1-year. Looking back 2 years, NVIDIA, Broadcom, and Taiwan Semi take the top ranks.
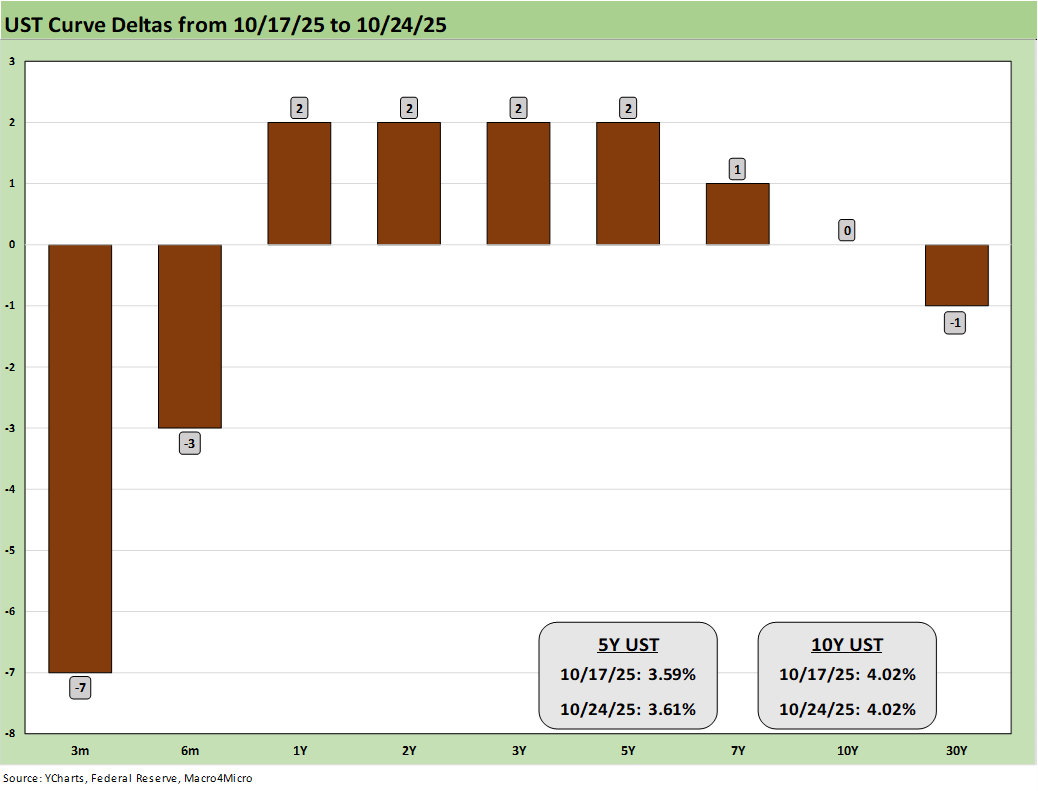
.The above chart updates the 1-week UST deltas with the front end lower on the expected easing Fed action ahead. The 10Y UST wavered over and under the 4.0% line this week.
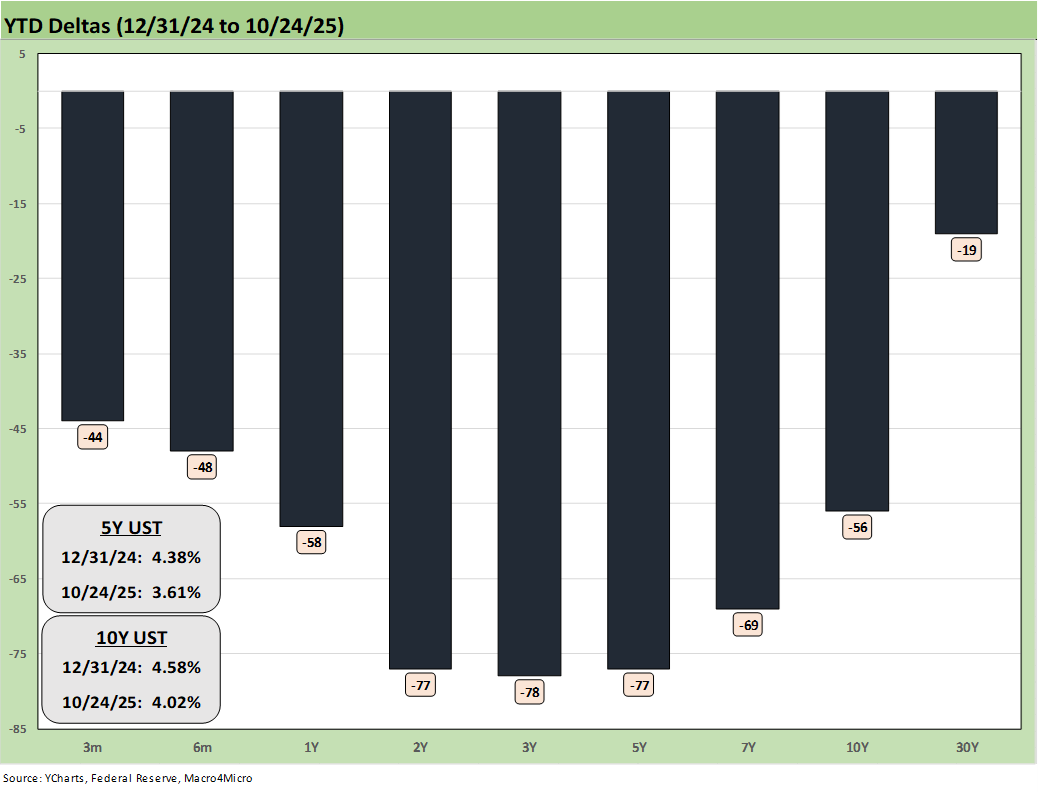
The above chart updates the bull steepener YTD that has placed the 7 bond ETFs we track all in the positive return zone. The UST bulls are still looking for the 10Y UST to start chasing the 3.6% lows of Sept 2024 with the CPI and PCE inflation numbers not moving as much as feared. The question is around when the buyers/importers will “eat” less of the tariffs and when the coming deluge of tariffs work their way into more order books and working capital cycles.
The tariff policy advocates want to pretend the “debate is over” on tariffs and this is simply not the case. There are more time lags to work through and more tariffs to clarify/finalize and put in place. The constant changing of terms is not a confidence builder.
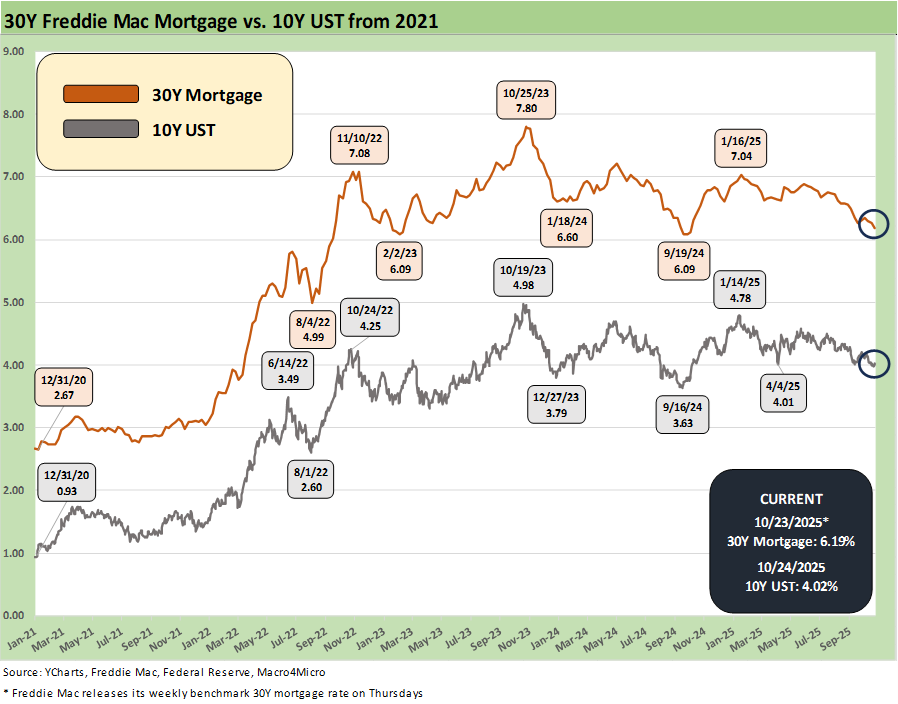
The above times series updates the running 10Y UST vs. the Freddie Mac 30Y mortgage. The market is seeing YoY refinancing activity rising, and we wonder how many in the market will expect the 6.19% mortgage survey rate to go much lower. A diminished tally of holdouts could help open up more activity in existing home sales, which remain very low in historical context even with a small increase this week.
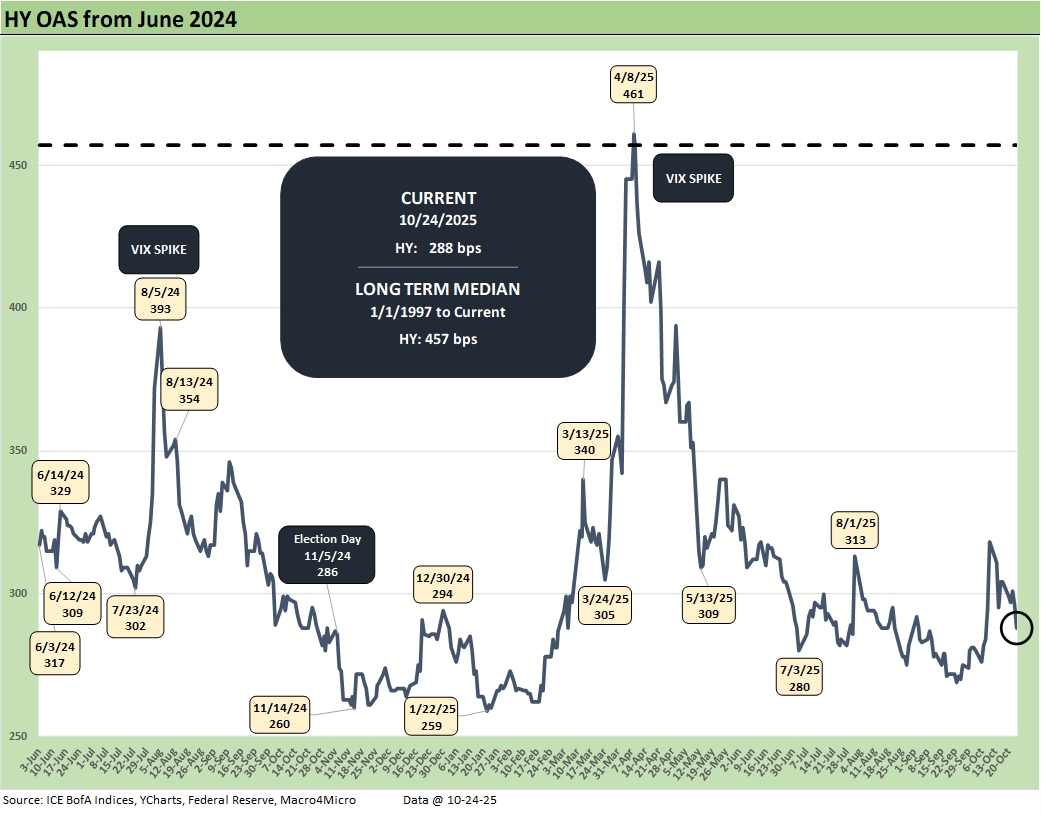
The above chart updates the running HY OAS from June 2024, and we see a -16 bps move tighter this week to +288 bps, which is in the June 2007 spread range. That is still substantially wider than the +259 bps in the lows of Jan 2025 but still well inside the +457 bps median since the start of 1997.
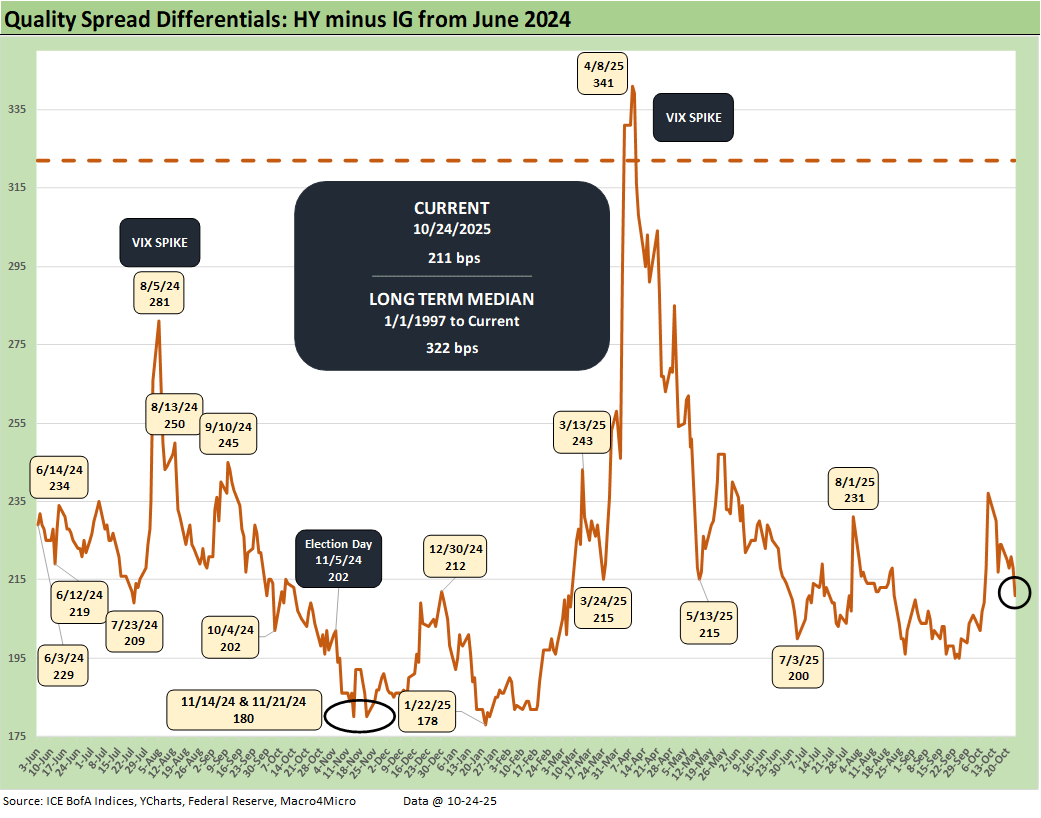
The above chart updates the “HY minus IG” quality spread differential as it tightened by -13 bps this past week from +224 bps to +211 bps. IG was -3 bps tighter on the week vs. -16 bps for HY for a net quality spread tightening of -13 bps.
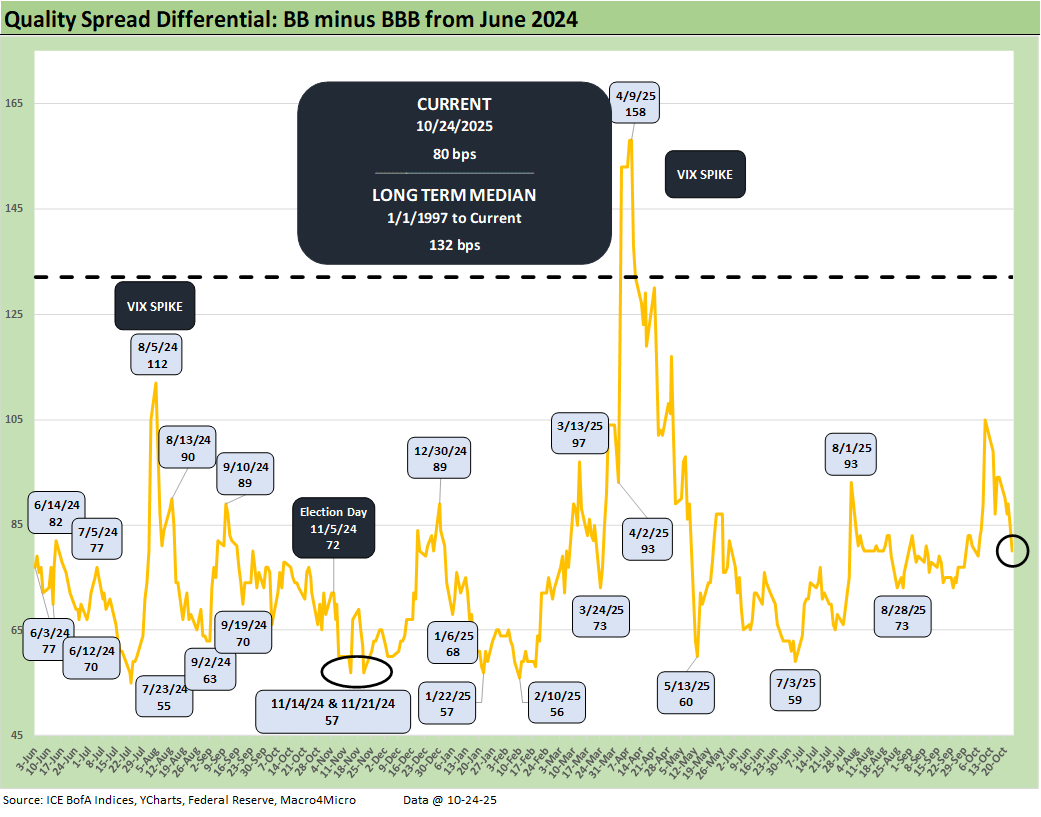
The above chart plots the “BB OAS minus BBB OAS” quality spread differential as it tightened by -14 bps with the BB tier tighter by -17 bps and the BBB tier tighter by -3 bps for a net quality spread move of -14 bps.
See also:
CPI September 2025: Headline Up, Core Down 10-24-25
General Motors Update: Same Ride, Smooth Enough 10-23-25
Credit Markets: The Conan the Barbarian Rule 10-20-25
The Curve: My Kingdom for 10 Cuts 10-19-25
Market Commentary: Asset Returns 10-19-25
Mini Market Lookback: Healthy Banks, Mixed Economy, Poor Governance 10-18-25
Mini Market Lookback: Event Risk Revisited 10-11-25
Credit Profile: General Motors and GM Financial 10-9-25
Mini Market Lookback: Chess? Checkers? Set the game table on fire? 10-4-25
JOLTS Aug 2025: Tough math when “total unemployed > job openings” 9-30-25
Mini Market Lookback: Market Compartmentalization, Political Chaos 9-27-25
PCE August 2025: Very Slow Fuse 9-26-25
Durable Goods Aug 2025: Core Demand Stays Steady 9-25-25
2Q25 GDP Final Estimate: Big Upward Revision 9-25-25
New Homes Sales Aug 2025: Surprise Bounce, Revisions Ahead? 9-25-25
Mini Market Lookback: Easy Street 9-20-25
FOMC: Curve Scenarios Take Wing, Steepen for Now 9-17-25
Home Starts August 2025: Bad News for Starts 9-17-25
Industrial Production Aug 2025: Capacity Utilization 9-16-25
Retail Sales Aug 2025: Resilience with Fraying Edges 9-16-25
Mini Market Lookback: Ugly Week in America, Mild in Markets 9-13-25
CPI August 2025: Slow Burn or Fleeting Adjustment? 9-11-25
PPI Aug 2025: For my next trick… 9-10-25
Mini Market Lookback: Job Trends Worst Since COVID 9-6-25