
Mini Market Lookback: Chess? Checkers? Set the game table on fire? 10-4-25
Life gets stranger, the market yawns. A shutdown and declaration of war on major cities in front of military leaders did not wag the market.

The equity markets were steady, UST rallied, credit spreads were flat in IG and edged wider in HY, the positive vs. negative score posted 24-8 in our group of 32 benchmarks/ETFs, and the S&P 500 saw 6 sectors positive and 5 negative. Mag 7 saw 5 of 7 underperform the S&P 500 and 6 of 7 underperform the Equal Weight S&P 500 ETF (RSP).
Energy was hit hard by a sharp sell-off in oil after rallying the prior week with the broad Energy ETF (XLE) last in the group of 32, E&P (XOP) second to last, and Midstream Energy ETF (AMLP) in third to last. The BDC ETF (BIZD) is still feeling the strain of recent headlines as extrapolation kicks in. Financials (XLF, KRE) took a week off for a dip into the bottom quartile.
In the Washington world of “you lie and I’ll swear to it,” the absence of economic releases will leave the White House in a happy position where performance attribution will get muddled and the critical issues around health care will turn partisan rather than become just a bad hit to household discretionary income blamed on them.
The clock is ticking on health care premium spikes, and the question around letting the consumer see them and blaming Trump – vs. the shutdown plan and ensuing chaos – was a decision point Democrats may come to regret. The door is now open to purges by the Project 2025 architects (led by Vought at the OMB).
The inexorable weakness in jobs and tariff fallout might get blurred by the shutdown and the usual blame game dynamics at a time when payrolls were under pressure and GDP lines (PCE, GPDI) show consumers softer than 2023-2024 and investment under pressure. There were few signs of progress in manufacturing jobs or non-AI, non-data center capex to this point.
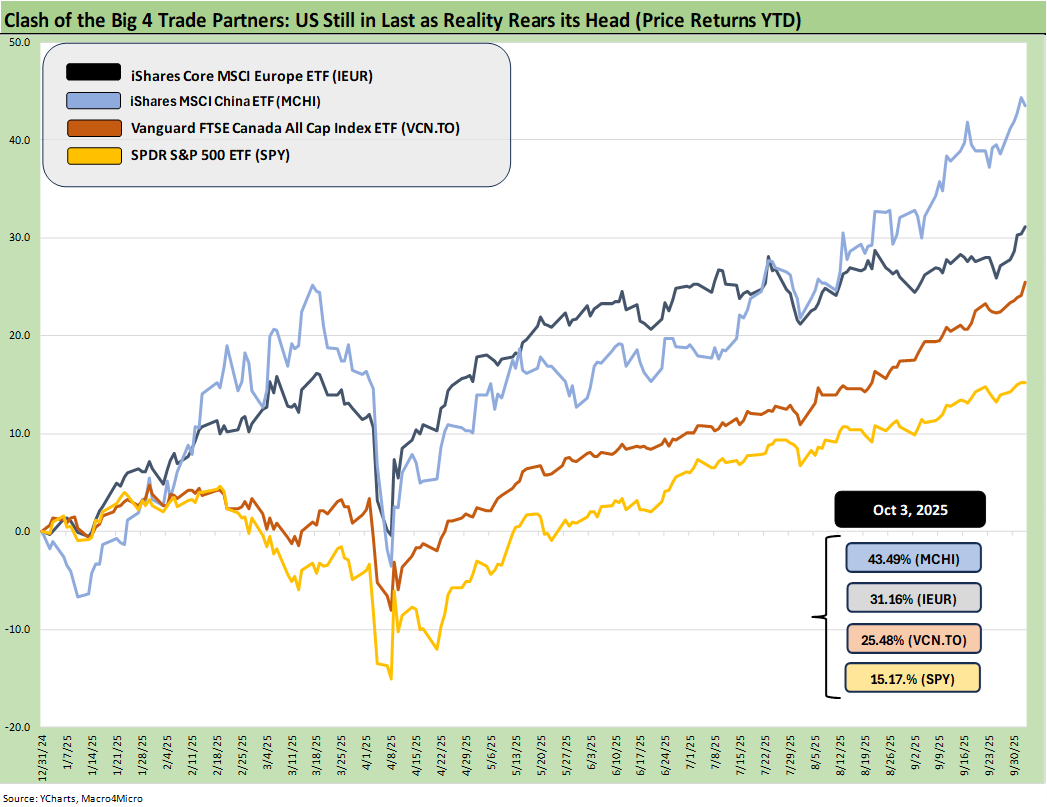
The above updates the YTD returns for some bellwether index ETFs for the Big 4 developed market trading partners – the US, Europe, China, and Canada. The aim of the chart is to plot some ETFs that tell a story for US investors thinking about global diversification. These ETFs represent a useful sample that uses relevant broad market indexes for each region as snapshots.
The goal of this chart is to capture the balance of risks across the broad mix of macro trends (economy, currency) and the sea level industry and company fundamentals rolled up into a US traded ETF. For the US, we use the S&P 500 ETF (SPY).
The chart shows the US remaining in last place with the dollar the main culprit. That last place does not offer much in terms of bragging rights at a time when many global investors and national leadership ranks are increasingly shocked by the direction of US policy. Whether that will flow into weaker UST appetites of offshore investors is a wildcard. They are more likely to hedge these days as various studies have highlighted.
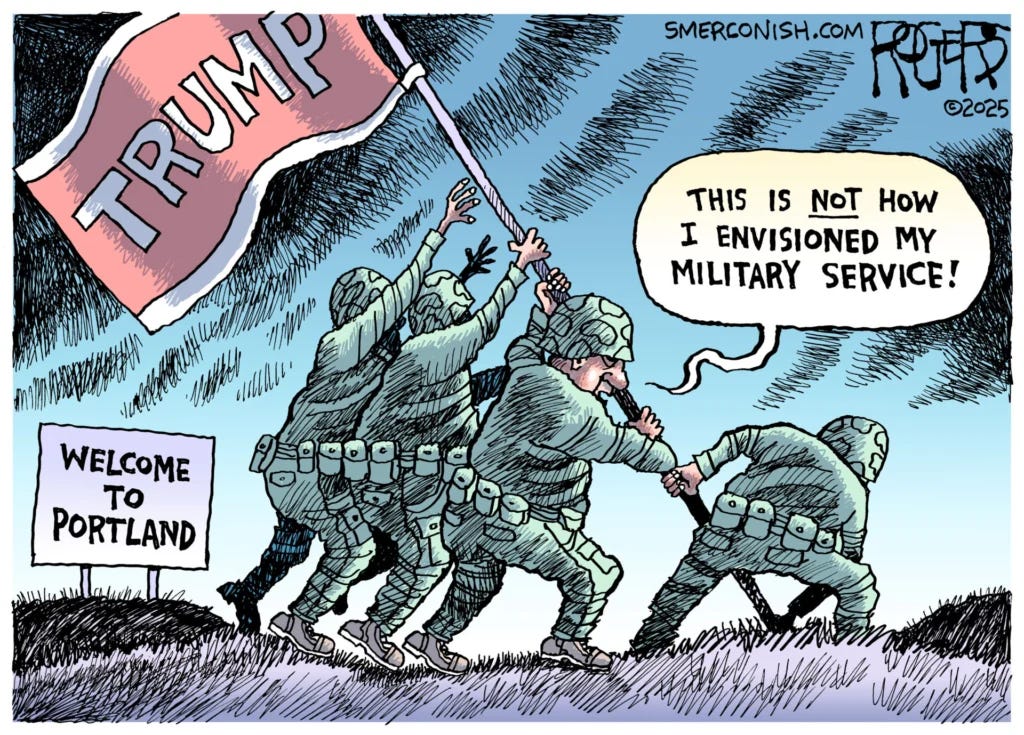
Political poison spreads to the military?
This past week was not an aphrodisiac for an embrace of US political stability with Hegseth gathering the military leadership for a heavily covered “cluster of circles.” Trump made his case for the military training in some of the US cities (blue ones) that are among the lead locations of GDP generation (services) and financial and tech hubs. He dubbed them the “enemy within.” The rumor mill had Trump wanting to send the legendary 82nd Airborne (nicknamed the “All American Division”) into Portland OR. Maybe he is saving the “Screaming Eagles” of the 101st for San Francisco or NYC? The authoritarian behavior is getting worse by the day.
Putting so many dedicated military commanders in one place to get chewed out and lectured by a slick-haired cretin who is their new boss could not be a confidence builder for international investors or many domestic consumers. The Afghanistan and Iraq Wars saw almost 2 million service members deploy. One would assume they could draw someone more qualified out of a hat.
For his part, Hegseth only got the job by MAGA political pressure in a razor-thin vote (51-50 with Vance the tie breaker as VP). That vote put a wholly unqualified Fox morning show host in a position where he can dictate the careers of brave leaders with a lifetime of service under their belts. It was a new low, but it also does not scream “prudent, intelligent sovereign governance.”
The dollar of course ended lower on the week, making tariffs even costlier on a dollar basis. As has been covered in the headlines, the dollar is going through its worst period in decades.

I’m a warrior. Be like me. Deus Vult!
As I watch all this unfold, I can’t help but think back to the 1960s and early 1970s in my youth and the many WWII and Korean war vets I had the honor to meet from my father’s activities in the Legion and VFW.
Remembering events like DAV (Disabled Vets) barbecues and fund raisers and 1st Marine conventions makes you shake your head at the spectacle of last week. The parades, the people you know in the color guard marching and the national pride and patriotism all meant something. The world changes and evolves (in this case, changes), but Hegseth speaking of “decades of decay” was an insult to the military leadership in the room.
All evidence to the contrary…
The Dept of Defense, Congressional Research Services, trade publications (Aviation Week products, Defense News, etc.), the defense contractors that are massive companies in the capital markets and economy, and more defense junkie publications and foreign policy think tanks than you can count routinely provide vast amount of information on the stunning progress and complexity of weapons systems and personnel training that signal anything but decay. Of the leadership now, the situation is more about a sudden “abscess” (Trump, Hegseth) than about past “decay.”
For many of these leaders, we assume they have their share of grievances about top-down strategy (from Bush to Obama to Biden and Trump) about how assets of the greatest military in the world get deployed and used after two decades of Middle East wars.
One could easily speculate they are not looking to spend their time in places like Portland, Chicago, Los Angeles, and San Francisco. The past week was not a good sign of that “misused asset factor” getting reduced. Leon Panetta (ex-head of CIA, Defense) was immediately out countering that “training” should be focused on drones, cyber and terrorism and not crowd control and intimidation of domestic political opponents exercising first amendment rights.
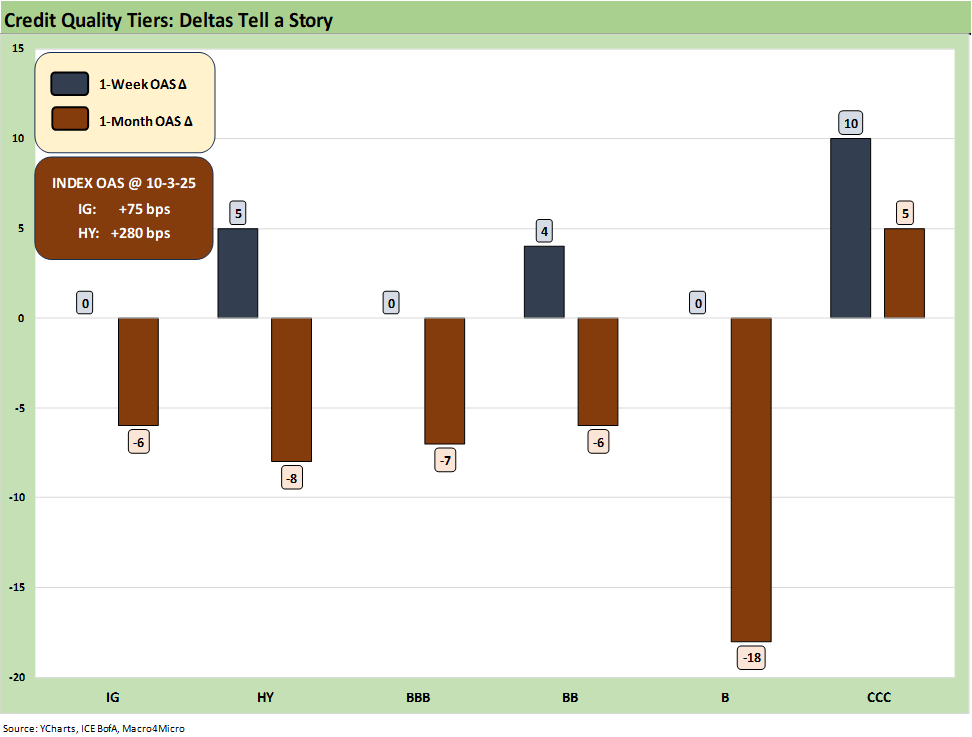
The above chart breaks out the credit spread deltas for IG and HY for the trailing 1-week and 1-month period. We also break out the deltas for the credit tiers from BBB to CCC. With the exception of the CCC tier, we see tighter spreads over the 1-month period with the usual constituent swings in CCC. The past week was quiet overall at the index level.
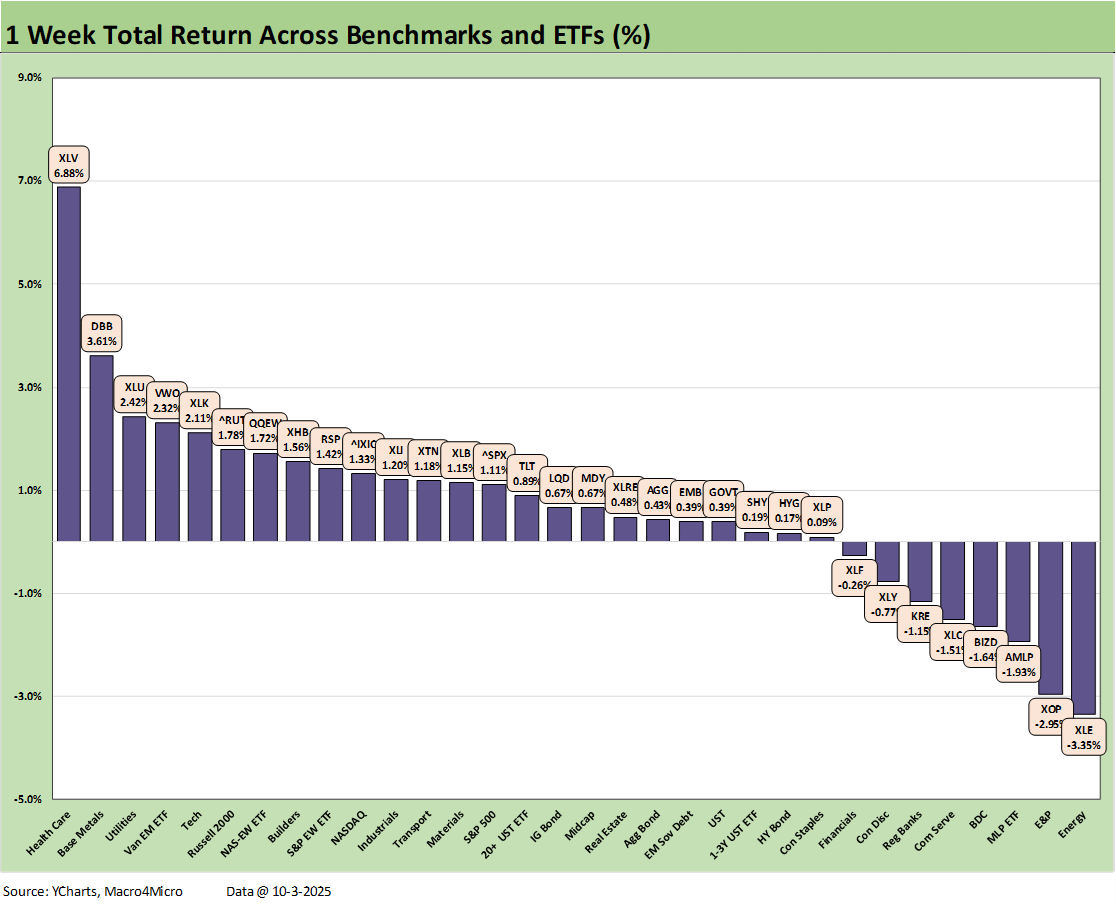
The weekly returns numbers we see for the 32 benchmarks and ETFs we watch came in with a score of 24-8 on the week with all major equity benchmarks positive. The Russell 2000 small caps won the week with a spot in the top quartile with the tech heavy NASDAQ in the second quartile. The Mag 7 heavy S&P 500 was behind NASDAQ in the second quartile. Midcaps were positive but ranked at the top of the third quartile. We see energy take a mild beating this week with the bottom 3 showing XLE, XOP, and AMLP.
We see the 7 bond ETFs we track each week in positive range with the long duration UST ETF (TLT) in the lead of the bond group and IG corporates next with its longer duration. Both were in the second quartile with the remaining 5 bond ETFs in the third quartile.
Health Care (XLV) was a big winner this week even though the mix has been somewhat of a dog for longer trailing periods. XLV saw big moves in the week across major constituents with Eli Lilly, Pfizer, Merck, Thermo Fisher, and Amgen making double-digit moves. The erratic tariff threats ebb and flow but have more recently eased back to where patented pharma have easy solutions where they can evade the tariffs by breaking ground and starting a process in the US. Some deals were getting struck with some large cap names, but there remains a considerable amount of chaos in health care from tariffs (and potential retaliation). Health insurance is part of the shutdown drama taken is tandem with the Medicaid cuts of the tax bill (OBBB).
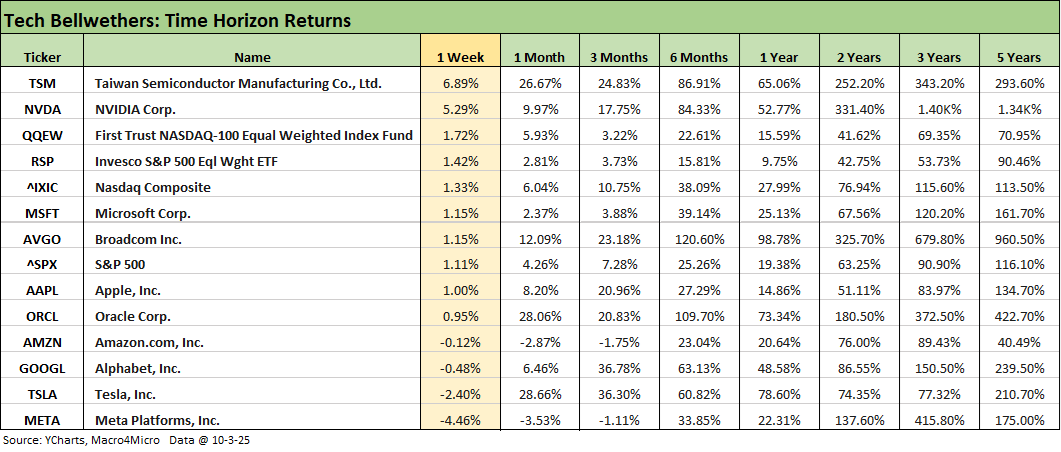
The week saw Taiwan Semi and NVDA carry the week, but we also see 5 of the Mag 7 below the S&P 500. Oracle was also below the S&P 500, which for its part was below the Equal Weight S&P 500 ETF (RSP). The Equal Weight NASDAQ 100 (QQEW) was #3 behind the big 2 chip players, so that meant this was not a mega tech week overall.
Some chatter around how NVIDIA was generating revenue by investment in customers was making the rounds. The idea was that revenue generation was somewhat circular with NVIDIA investing in its AI customers. That “circular comment” of course makes sense since they use the money to buy NVDA products. The two situations, then vs. now, are still very distinct.
Many of us remember the “vendor finance” excess of the late 1990s where Lucent, Nortel and Motorola among others were making massive loans to customers that the customers would then use to deploy into the telecom supplier’s top line. In that case, many of the customers were on a debt-financed binge to fund capex with negative cash flow and valuations tied to highly speculative forward revenue models that were not ever realized for many. Some of those failed revenue models did much better later after filing bankruptcy and getting a do-over (or getting rolled up into larger entities).
Many were quick to point out that the situation today is very different. That is of course true, but the parallel is that the product game plan in AI also needs to work out. That is not 100% certain on revenue models. The customers today are not carrying massive debt burdens compared to the late 1990s. It is more about the equity valuation debate.
The current ecosystem with “round trip circular revenue” is driving investment in AI and thus generating more revenue for NVDA. The current supplier-customer ecosystem has a lot of confidence built into it. The revenue models and demand side of the equation for AI products and services will still need to follow through and support the valuations, but that is the same debate going on every day. Will AI products be the monster revenue and profit generator in line with expectations? There is a massive amount of investment relying on AI success from data centers and power to the tech names themselves. A few countries (notably China) are also piling on.
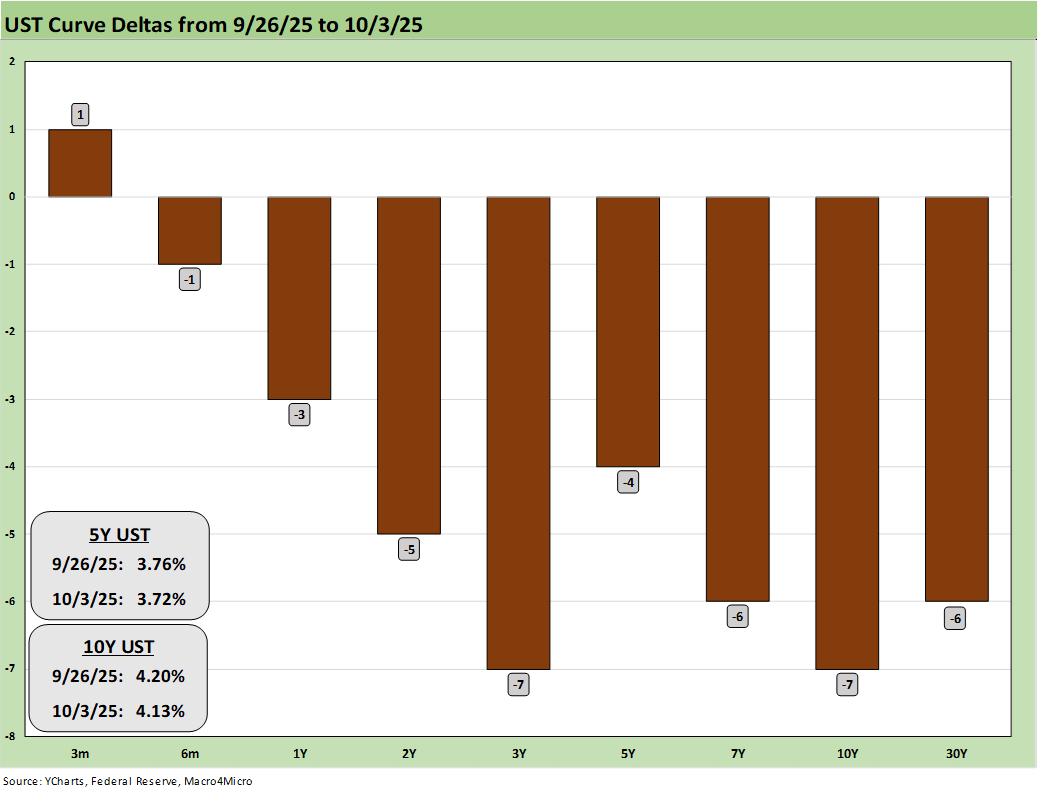
The above chart updates the 1-week UST deltas and we see a shift lower with most in the 5 to 7 bps range. The absence of economic data did not help but JOLTS, ISM and ADP were telling downbeat stories. The clash of the White House and Democrats is teeing up massive federal layoffs at a time when jobs were already under pressure.
The focus on ACA insurance premiums that will be in the mail could cast a pall over the consumer sectors as the reality of household costs weigh in. We will not be getting CPI and detailed payrolls for a while unless the Democrats back off from the shutdown and play the “open your new health insurance premiums and blame Trump” card. That would entail some Democrats in the Senate backing down (or a small subset of them).
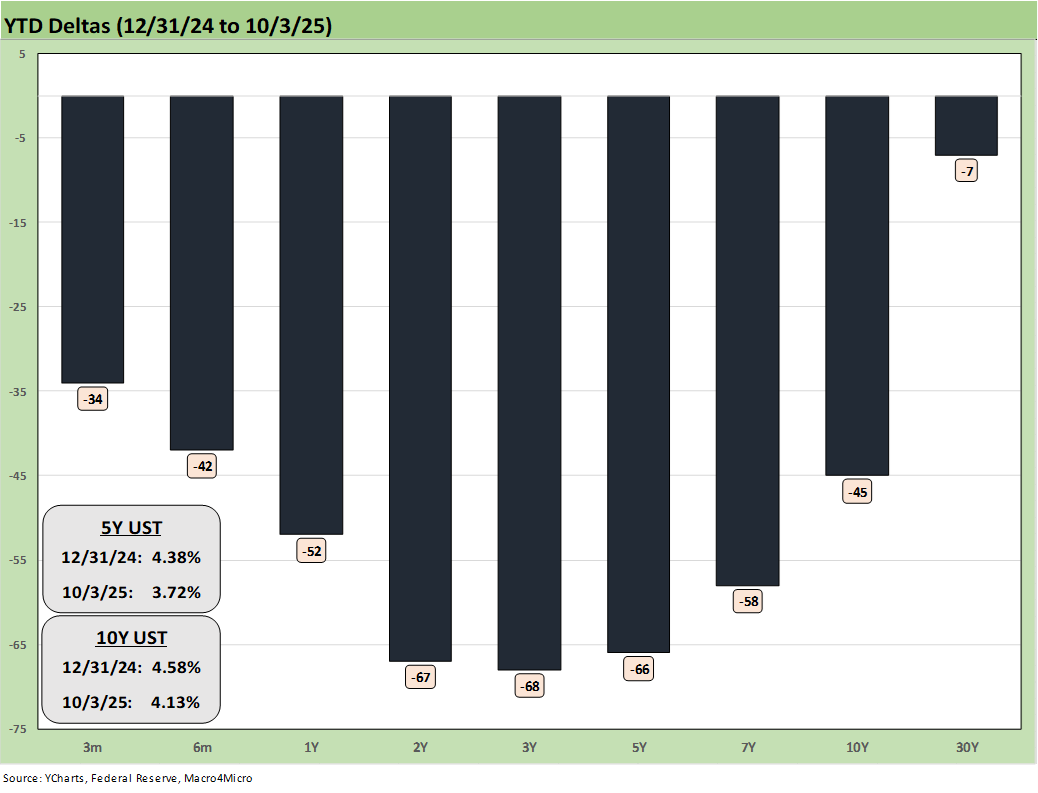
The above chart updates the YTD UST deltas where the bull steepener is still very much in place. The absence of inflation data makes it less of a threat on the long end, but the bad news will come at some point with so many tariffs in the queue likely to come alongside bad news in growth and payroll. That means stagflation risk remains high.
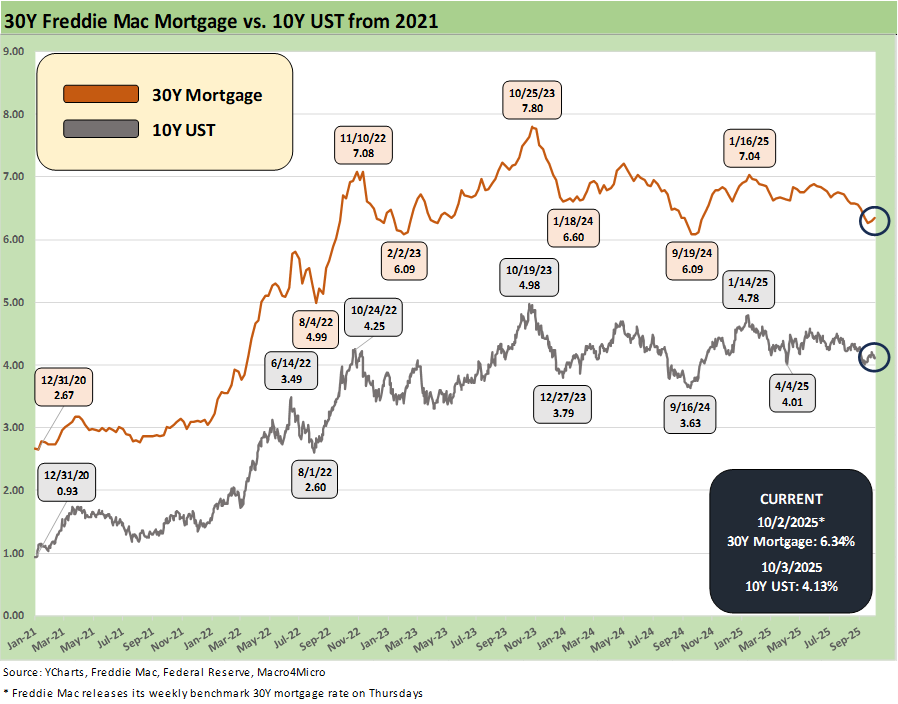
The above chart updates the running 10Y UST vs. the 30Y Freddie Mac mortgage benchmark (set Thursday at 6.34%). The Friday close on the Mortgage News Daily survey was also 6.34%.
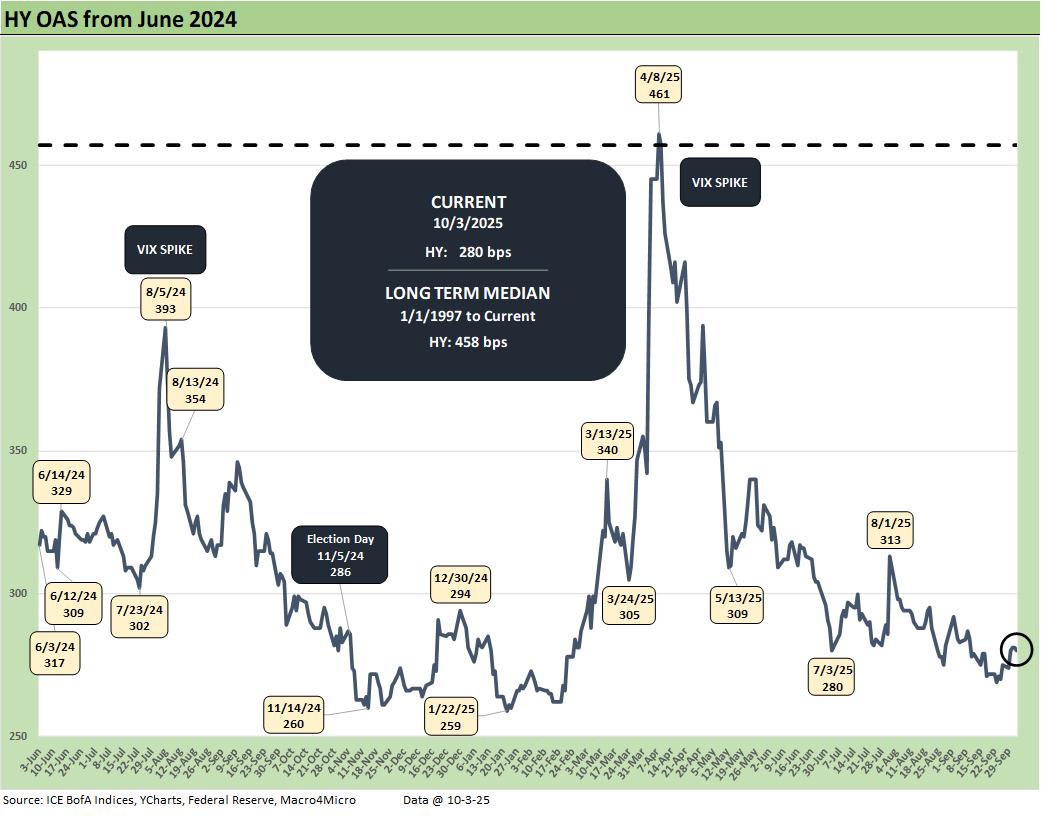
The above chart plots the HY OAS from June 2024, and we see a +5 bps move wider on the week to +280 bps from +275 bps and from +272 bps the prior week. That HY index OAS is still in the bubble zone of June 2007.
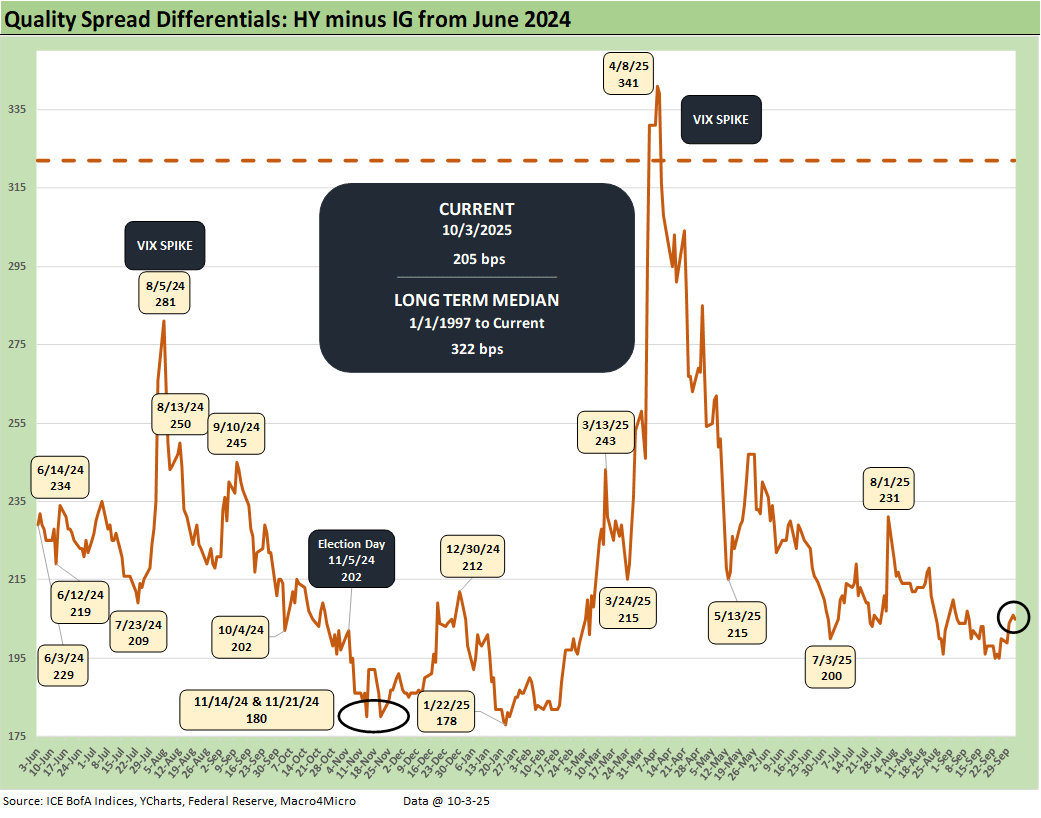
The above chart updates the quality spread differentials for HY vs. IG with “HY OAS minus IG OAS” +5 bps higher on the week to +205 bps from +200 with HY +5 bps wider and IG flat on the week.
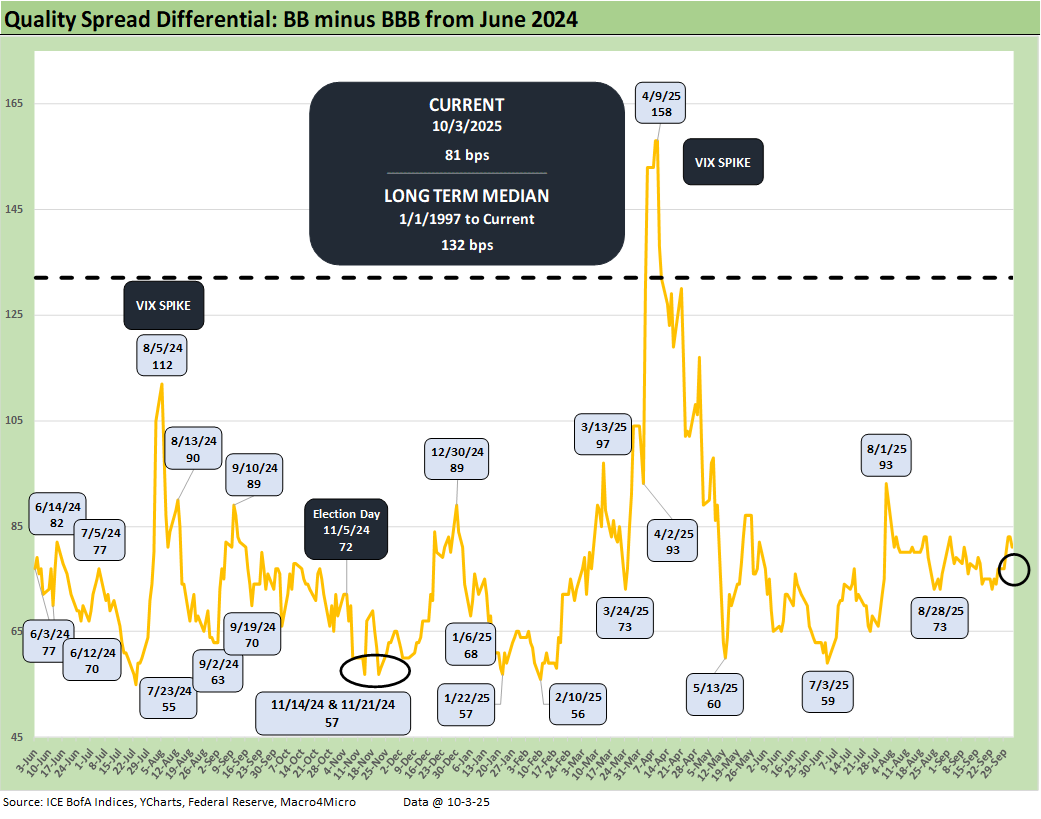
The above chart shows the “BB OAS minus BBB OAS” quality spread differential, which widened by +4 bps to +81 bps over the week with the BB tier +4 bps wider and the BBB tier flat. The BBB vs. BB OAS differential remains wide to the early July level around +59 bps and +56 bps in Feb 2025.
See also:
JOLTS Aug 2025: Tough math when “total unemployed > job openings” 9-30-25
Credit Markets: Cone of Silence Ahead? 9-29-25
The Curve: Easing Anxiety at Bat, Tariffs on Deck 9-28-25
Market Commentary: Asset Returns 9-28-25
Mini Market Lookback: Market Compartmentalization, Political Chaos 9-27-25
PCE August 2025: Very Slow Fuse 9-26-25
Durable Goods Aug 2025: Core Demand Stays Steady 9-25-25
2Q25 GDP Final Estimate: Big Upward Revision 9-25-25
New Homes Sales Aug 2025: Surprise Bounce, Revisions Ahead? 9-25-25
Credit Markets: IG Spreads Back in the Clinton Zone 9-22-25
The Curve: FOMC Takes the Slow Road 9-21-25
Market Commentary: Asset Returns 9-21-25
Mini Market Lookback: Easy Street 9-20-25
FOMC: Curve Scenarios Take Wing, Steepen for Now 9-17-25
Home Starts August 2025: Bad News for Starts 9-17-25
Industrial Production Aug 2025: Capacity Utilization 9-16-25
Retail Sales Aug 2025: Resilience with Fraying Edges 9-16-25
Credit Markets: Quality Spread Compression Continues 9-14-25
The Curve: FOMC Balancing Act 9-14-25
Footnotes & Flashbacks: Asset Returns 9-14-25
Mini Market Lookback: Ugly Week in America, Mild in Markets 9-13-25
CPI August 2025: Slow Burn or Fleeting Adjustment? 9-11-25
PPI Aug 2025: For my next trick… 9-10-25
Mini Market Lookback: Job Trends Worst Since COVID 9-6-25
Payrolls Aug 2025: Into the Weeds 9-5-25
Employment August 2025: Payroll Flight 9-5-25
JOLTS July 2025: Job Market Softening, Not Retrenching 9-3-25