
Market Commentary: Asset Returns 11-9-25
The shutdown is now grounded in ego and point-of-no-return dynamics after an ugly election “morning after.” The impact is spreading.


Could this be getting serious?
The week was a rough one for asset returns as noisy post-election headlines refocused the markets on SNAP, affordability, and broad policy dysfunction that is taking an economic toll. The services and goods markets inevitably feel the reverberating multiplier effects with the economic data still mostly in the dark. That said, the reality is in the aisles and within payroll actions, but the information there is erratic and piecemeal.
The UMich Consumer Sentiment for November is back down to the June 2022 all-time lows with 50.3 for Nov 2025 vs. 50.0 for June 2022. The false statements on where inflation stands now vs. the post-election period are not helping build confidence that the tariff architects see the problem. The facts are that a broad range of CPI metrics are higher now than in Dec 2024. Those are just factual numbers and not hard to check. Even Energy is worse now when one looks to the actual Sept CPI numbers vs. Dec 2024 (see Mini Market Lookback: All that Glitters… 11-8-25, CPI September 2025: Headline Up, Core Down 10-24-25).
Tech was the main victim this week, but 14 benchmarks and ETFs posted positive returns with 18 negative in our group of 32 benchmarks/ETFs. The large cap benchmarks were in the red. The Russell 2000 small caps were also negative for the week and joined the S&P 500 and NASDAQ in the bottom quartile. NASDAQ was second to last while the Tech ETF (XLK) was dead last.
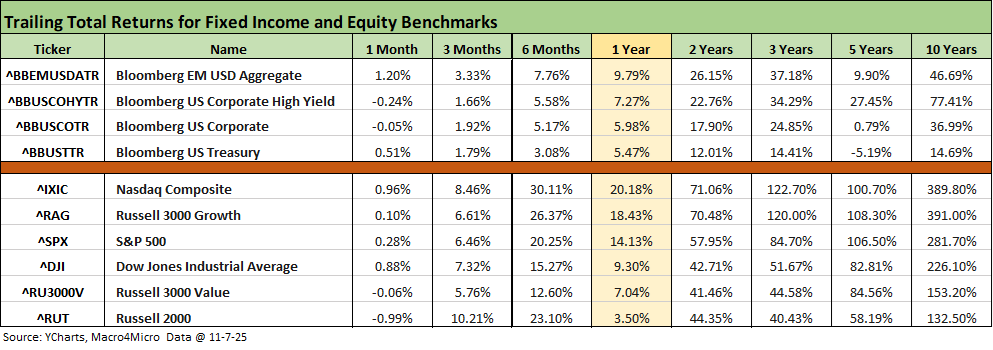
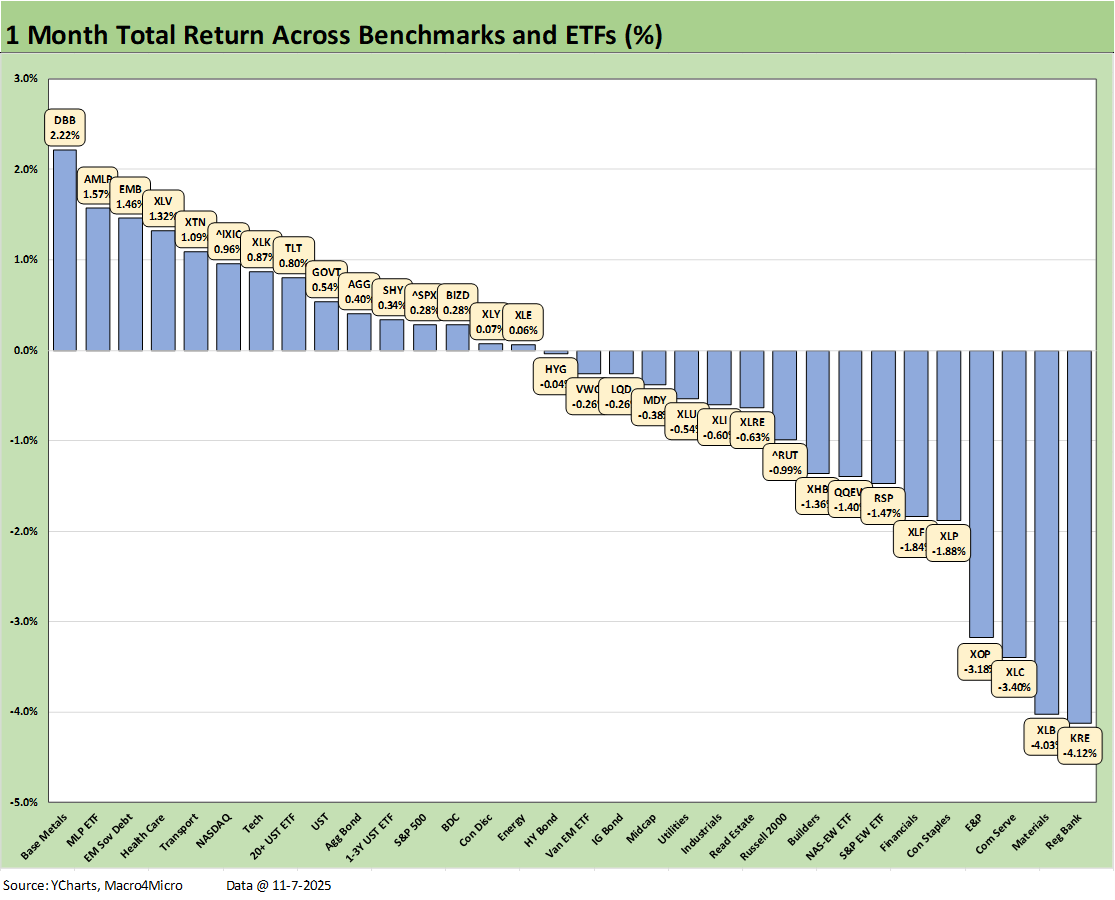
This week brought some negative numbers back into the picture over the 1-month period. In recent updates, generally the only block in negative range was the 5-year UST benchmark. The 1-month returns above pushed HY and IG Corporate benchmarks into the red on the fixed income side. In equities, we see the Russell 2000 small caps in the red and the same for Russell 3000 Value. The Russell 3000 Growth benchmark is now only barely positive. Overall, that signals trouble for the US-centric small caps.
The rolling return visual
In the next section, we get into the details of the 32 ETFs and benchmarks for a mix of trailing periods. Below we offer a condensed 4-chart view for an easy visual on how the mix of positive vs. negative returns shape up. This is a useful exercise we do each week looking for signals across industry groups and asset classes.
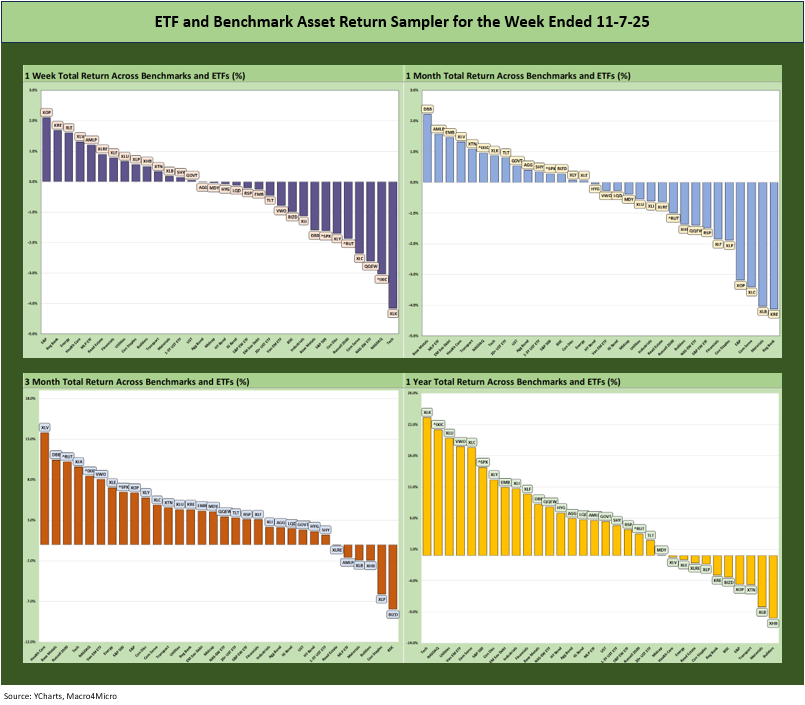
The positive vs. negative symmetry above is gradually swinging toward more negatives to close out the year. The YTD profile is detailed further below, and it remains impressive at 28-4. That said, Trump’s chances of seeing the S&P 500 beat the total return performance of 2024 and 2023 are waning with YTD at +15.6% vs. back-to-back returns over 25% for 2024 and 2023. That was the first time since the late 1990s.
The Magnificent 7 heavy ETFs…
Some of the benchmarks and industry ETFs we include have issuer concentration elements that leave them wagged by a few names. When looking across some of the bellwether industry and subsector ETFs in the rankings, it is good to keep in mind which narrow ETFs (vs. broad market benchmarks) get wagged more by the “Magnificent 7” including Consumer Discretionary (XLY) with Amazon and Tesla, Tech (XLK) with Microsoft, Apple, and NVIDIA, and Communications Services (XLC) with Alphabet and Meta.
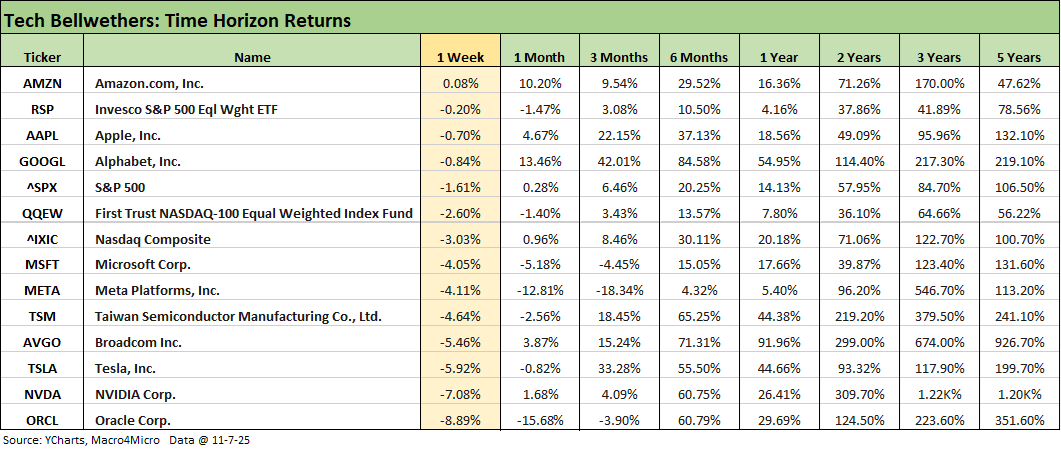
We already looked at the tech bellwether pain of the past week in our Mini Market Lookback: All that Glitters… (11-8-25). Only Amazon was able to generate a slightly positive return for the week. Among interesting data points were Meta, Microsoft, and Oracle in negative range for the 3-month time horizon. All of the lines are in double-digit returns for 6 months except Meta with only +4.3%. Meta was also the only name in the “Mag 7+3” (+3= Oracle, Broadcom and Taiwan Semi) to be in single digits over the trailing 1-year.
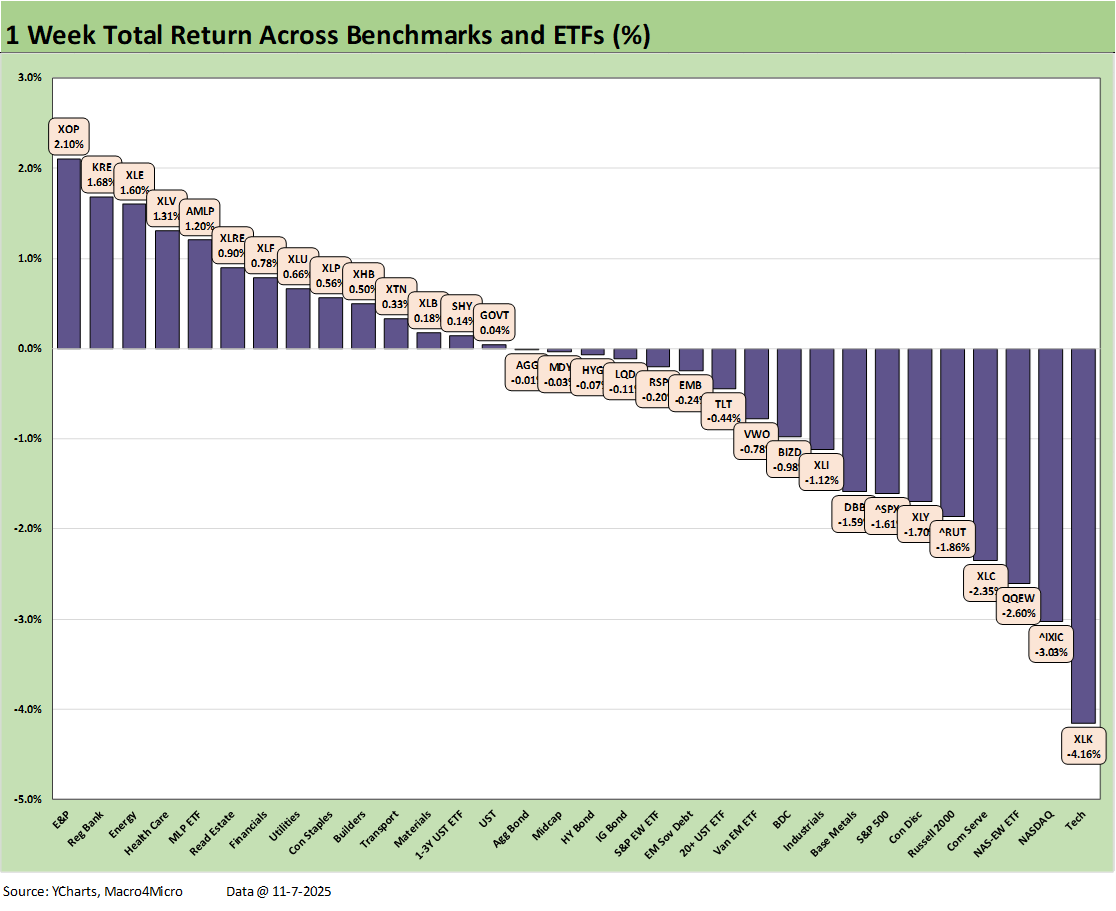
We looked at the 1-week results already in our Mini Market Lookback: All that Glitters… (11-8-25). The tech beatdown is evident in the Tech ETF (XLK) on the bottom at -4.2%, NASDAQ second to last at -3.0%, and the Equal Weight NASDAQ 100 ETF (QQEW) 3 slots off the bottom. Rounding out the tech residents in the bottom 5 is the Communications Services ETF (XLC) which is 4 off the bottom.
Energy bounced back into the top 5 this week with E&P (XOP), Energy (XLE), and Midstream (AMLP). Regional Banks ETF (KRE) and Health Care (XLV) rounded out the Top 5. We see 5 of 7 bond ETFs in negative range.
The 1-month score at 15-17 shows all 7 bond ETFs in positive range with EM Sovereigns (EMB) and the long duration UST ETF (TLT) in the top quartile. The benchmarks in equities are spread around with NASDAQ in the top quartile, the S&P 500 in the second quartile, and the Midcaps and Russell 2000 small caps in the third quartile. The Equal Weight S&P 500 (RSP) with the Equal Weight NASDAQ 100 (QQEW) are in the bottom quartile.
Regional Banks ETF (KRE) are sitting on the bottom after a mixed reporting season and too many jitters over private credit after the spate of headlines about “cockroaches” in the latest credit growth market. A credit cycle will be coming, but the extrapolation from a few bad deals struck us as extrapolation run amok. The originators and deal architects are not all created equal in their due diligence and portfolio monitoring skills.
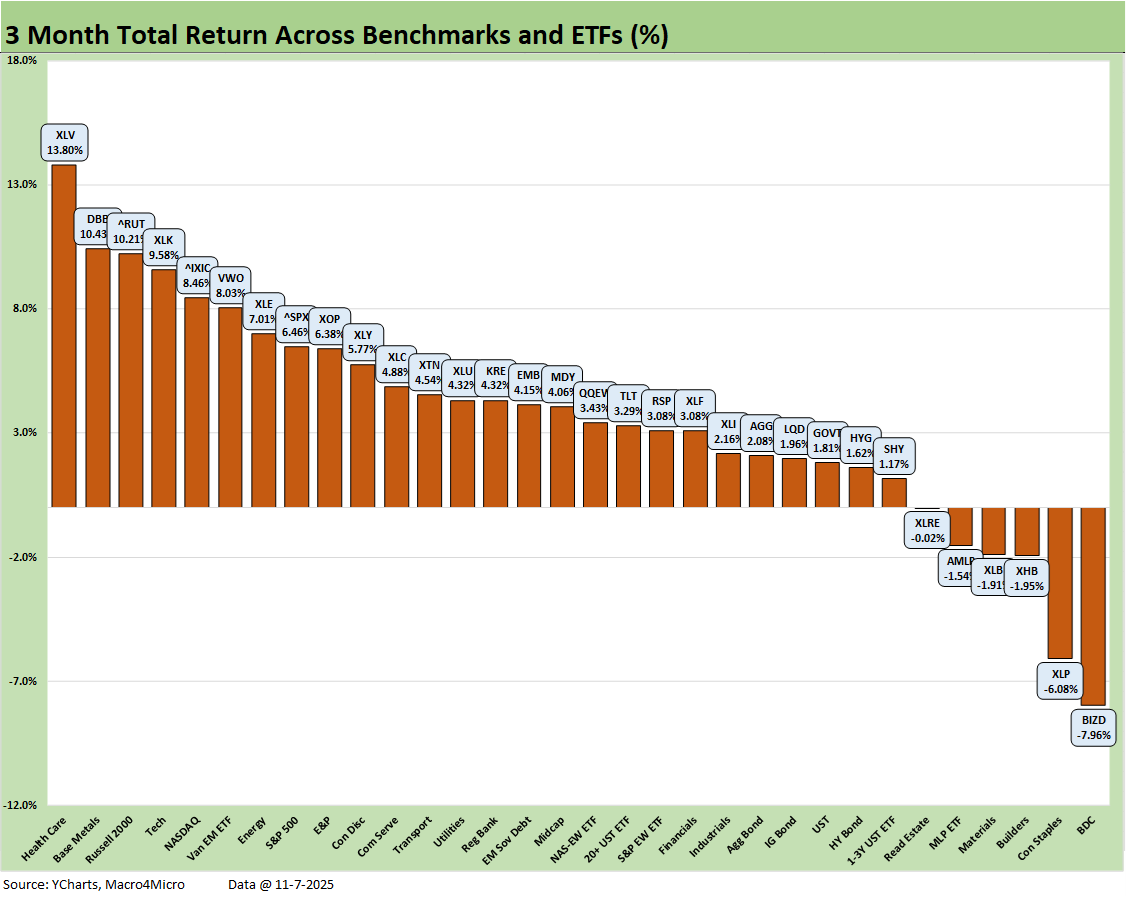
The 3-month returns still show a clearly positive bias at 26-6 with all 7 bond ETFs positive. The bottom dwellers include some of the more interest rate sensitive ETFs (XHB, XLRE, XLP) or more cyclically exposed (XLB, BIZD). We see the dividend-heavy AMLP as lagging with energy with fundamentals still tied to more energy infrastructure capex planning. AMLP is a safe coupon clipper.
The winners include Health Care (XLV) at #1 on the back of some solid pharma rallies with Base Metals (DBB) at #2. Despite the recent fade, Russell 2000 was a solid #3 ahead of Tech (XLK) and the NASDAQ rounded out the top 5. The S&P 500 also rode the tech strength into the top quartile while Energy (XLE) and E&P (XOP) got some relief across this 3-month period following a tougher YTD and LTM period.
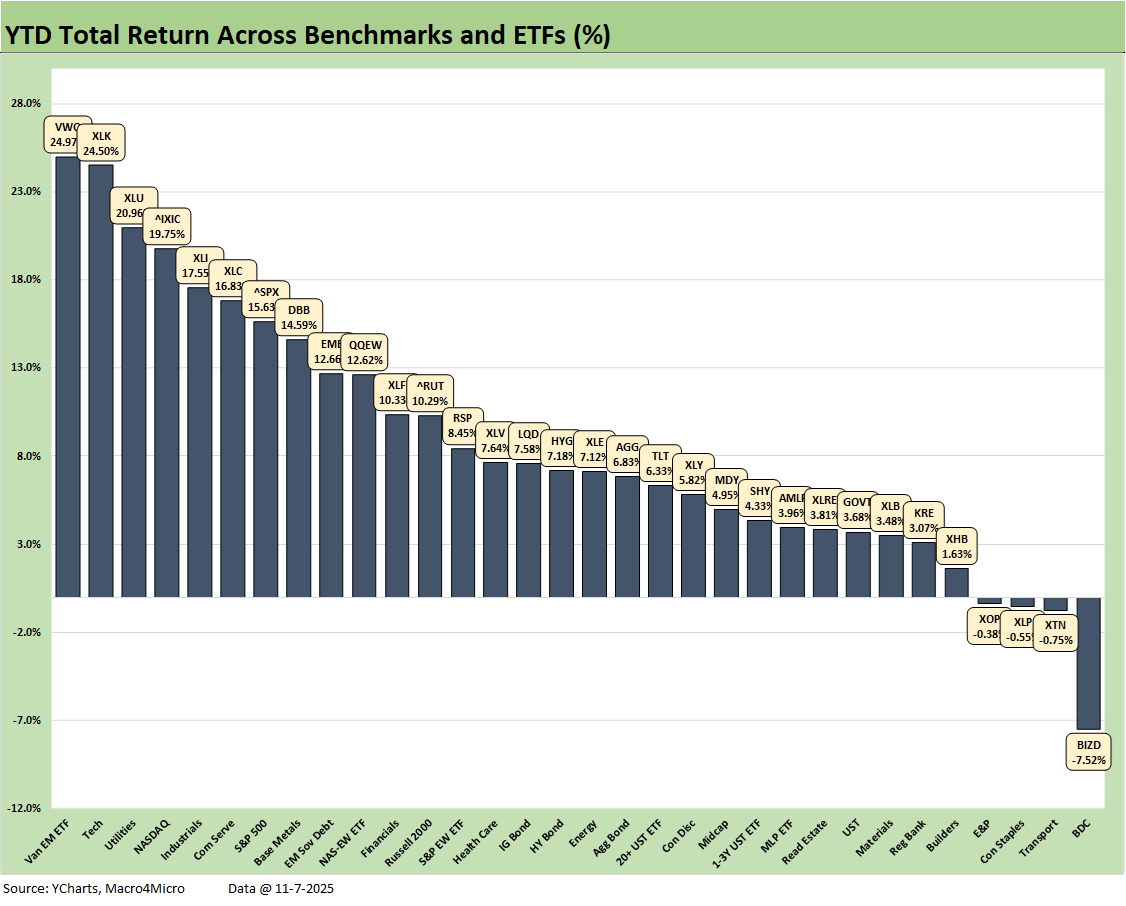
The YTD period has some bragging rights at 28-4 after a very good run for much of the year for tech, utilities, and industrials. EM Equity (VWO) is in the #1 slot and got a lot of benefits from currency trends in the context of a weak dollar. Tech drove half the top quartile with Tech (XLK), NASDAQ, the S&P 500 (heavy tech weightings) and Communications Services (XLC).
The 7 bond ETFs are all positive with EM Sovereigns (EMB) just missing the top quartile with GOVT on the bottom of that peer group at the top of the bottom quartile. Behind EMB we see IG Corporate (LQD) in the second quartile just ahead of HYG.
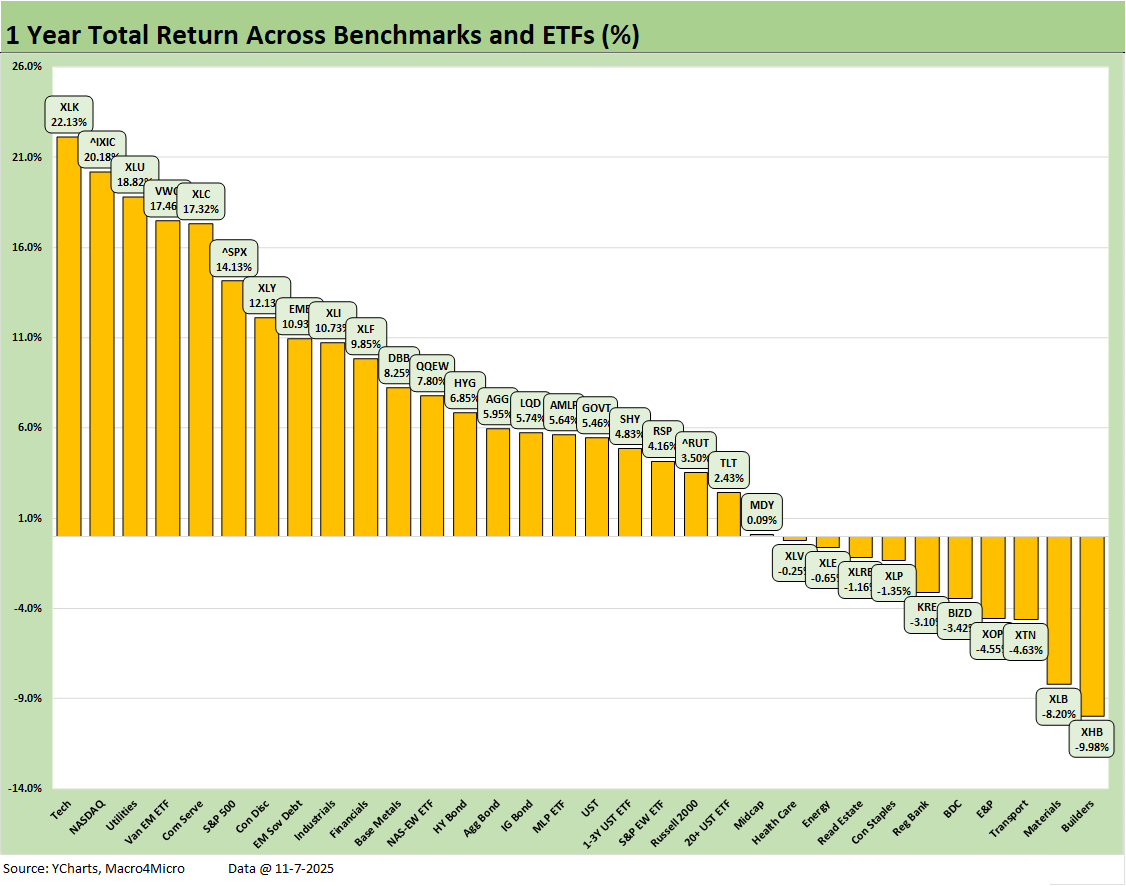
The LTM period posts a score of 22-10 with some of the usual suspects in the red with the main common theme being interest rate sensitivity with a few more tied into industry specific worries. Homebuilders (XHB) are on the bottom with stubborn mortgage rates, tariffs driving costs higher (per the NAHB), and consumers struggling with a combination of low confidence and payroll worries. Monthly household budgets will be getting worse with the direction of health insurance premiums. For many, health care and food will bring zero sum effects on other spending.
As covered in the prior YTD chart, the S&P 500 will need to finish 2025 in impressive fashion to match the 2024 and 2023 S&P 500 returns. The year 2024 was Part Two of the best 2-year run in the S&P 500 since the late 1990s, so that sets a high bar for the Trump stock market (see Footnotes & Flashbacks: Asset Returns for 2024 1-2-25).
The +15.6% YTD return on the S&P 500 is looking up at a 25% bar from 2024 (and even better in 2023) that will be hard to clear. Trump might have to stop calling the US in 2024 a “dead country.” While he was out bragging about record stock markets this week, we can say the following: “the only Presidents ever to reach record stock markets since 1980 were…ALL OF THEM.”
See also:
Mini Market Lookback: All that Glitters… 11-8-25
Credit Markets: Little Shop of Worries 11-3-25
The Curve: Macro Data MIA? Policy Prudence KIA? 11-3-25
Market Commentary: Asset Returns 11-2-25
Mini Market Lookback: Not Quite Magnificent Week 11-1-25
Synchrony: Credit Card Bellwether 10-30-25
Credit Markets: Call Me After Trouble Arrives 10-27-25
The Curve: A Slow Pour of Tariffs 10-27-25
Market Commentary: Asset Returns 10-26-25
Existing Home Sales Sept 2025: Staying in a Tight Range 10-26-25
Mini Market Lookback: Absence of Bad News Reigns 10-25-25
CPI September 2025: Headline Up, Core Down 10-24-25
General Motors Update: Same Ride, Smooth Enough 10-23-25
Credit Markets: The Conan the Barbarian Rule 10-20-25
Mini Market Lookback: Healthy Banks, Mixed Economy, Poor Governance 10-18-25
Mini Market Lookback: Event Risk Revisited 10-11-25
Credit Profile: General Motors and GM Financial 10-9-25
Mini Market Lookback: Chess? Checkers? Set the game table on fire? 10-4-25
JOLTS Aug 2025: Tough math when “total unemployed > job openings” 9-30-25
Mini Market Lookback: Market Compartmentalization, Political Chaos 9-27-25
PCE August 2025: Very Slow Fuse 9-26-25
Durable Goods Aug 2025: Core Demand Stays Steady 9-25-25
2Q25 GDP Final Estimate: Big Upward Revision 9-25-25
New Homes Sales Aug 2025: Surprise Bounce, Revisions Ahead? 9-25-25
Mini Market Lookback: Easy Street 9-20-25
Home Starts August 2025: Bad News for Starts 9-17-25
Industrial Production Aug 2025: Capacity Utilization 9-16-25
Retail Sales Aug 2025: Resilience with Fraying Edges 9-16-25
Mini Market Lookback: Ugly Week in America, Mild in Markets 9-13-25
CPI August 2025: Slow Burn or Fleeting Adjustment? 9-11-25
PPI Aug 2025: For my next trick… 9-10-25
Mini Market Lookback: Job Trends Worst Since COVID 9-6-25