
JOLTS Aug 2025: Tough math when “total unemployed > job openings"
We may not get fresh payroll data for a while with the shutdown, but the JOLTS numbers reaffirm the employment headwinds.


BLS headquarters preps for shutdown staffing activity.
Job openings were relatively stable sequentially from July to August 2025, but total openings were down by -422K or -5.5% YoY. Construction (the biggest decline) and manufacturing were both weak, and that does not help the story line that hypes a booming investment pipeline.
The snapshot trend line is that “Hires” and “Fires” were both down MoM and the same for Separations and Quits as the wheels are not turning quickly. Layoffs and discharges were higher YoY in total and in the private sector but essentially flat on the Government line. Federal could see a fresh, even larger purge with the shutdown based on what OMB Head Vought (the Project 2025 leader) has threatened.
The biggest movers in job openings were still in the services lines with lower multiplier effects such as “Health care and social assistance” and “Leisure and hospitality.” Those are the mainstays of the monthly churn and swing lines in payroll reports generally.
The Northeast and South posted the higher YoY declines in job openings with the Northeast at -10.9% and South at -7.9%, respectively.
While the JOLTS report is not ringing recession alarms, the slowing activity underscores the limits of overpromising and the danger of facts. The White House might be happier to see fewer facts for a while that offer transparency into the developing payroll struggles and tariff effects. The FOMC could also use the data for its 2 remaining decision points in 2025.
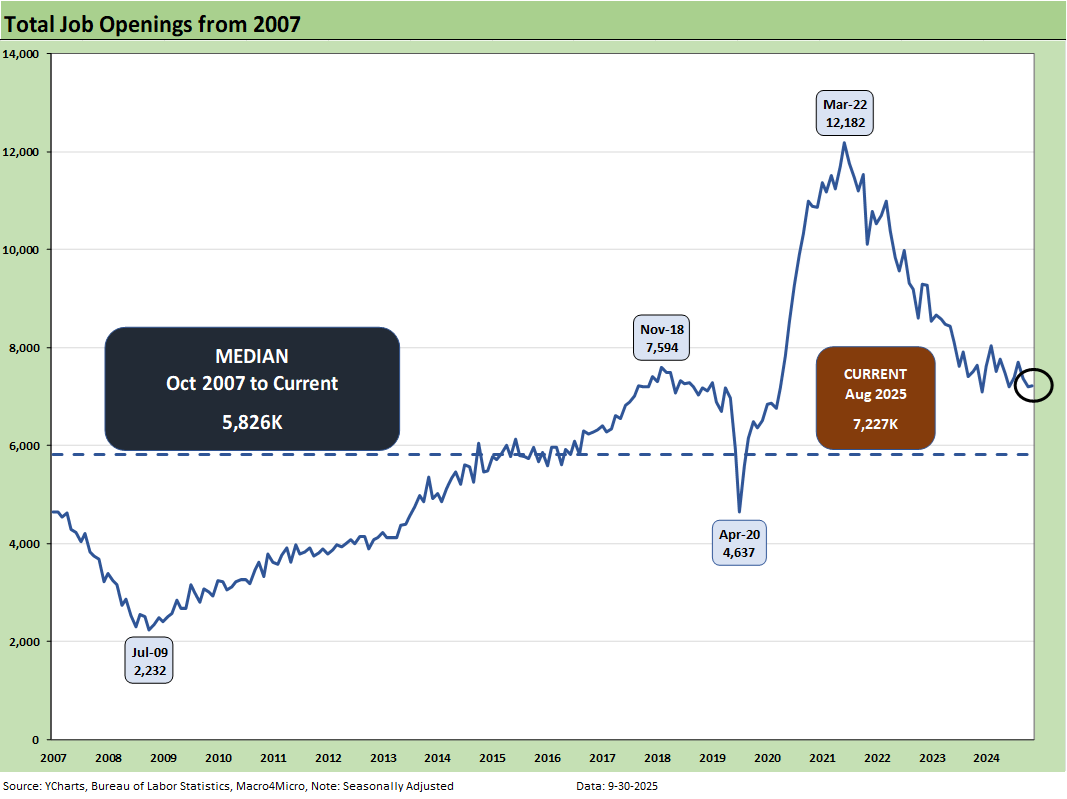
While the JOLTS data is not flashing signs of major trouble, it is signaling a weakening in overall context. Job Openings for August were essentially flat MoM at 7.23 million vs. July’s revised 7.21 million. That 7.23 million in openings is down -5.5% YoY (-422K) from 7.65 million in Aug 2024. Openings remain well above the long-term median from Oct 2007.
That 7.23 million in openings is below the total unemployed from the August payroll report of 7.38 million (see Employment August 2025: Payroll Flight 9-5-25). We are not suggesting those lines ever match up the supply to the need, but that relationship can only be seen as part of an unfavorable trend.
The JOLTS report comes at a 1-month lag, so we would typically be looking to the upcoming payroll release for a more timely read on how the job market played in September. However, given the likelihood of a government shutdown at midnight tonight and yesterday’s announcement out of the Executive Branch that there would be a freeze on data releases until reopening, we anticipate that payroll numbers may not be available for a while.
This data shutdown challenge comes on the heels of Trump’s recent firing of the BLS head and subsequent nomination of a highly inexperienced ideologue with questionable credentials (see Happiness is Doing Your Own Report Card 8-1-25).
We already discussed the concern that Vought at OMB and “Team Project 2025” might use this shutdown as their opportunity to restructure all the data providers and consolidate control (see The Curve: Easing Anxiety at Bat, Tariffs on Deck 9-28-25, Mini Market Lookback: Market Compartmentalization, Political Chaos 9-27-25 ). The current clash gives Team Trump an excuse.
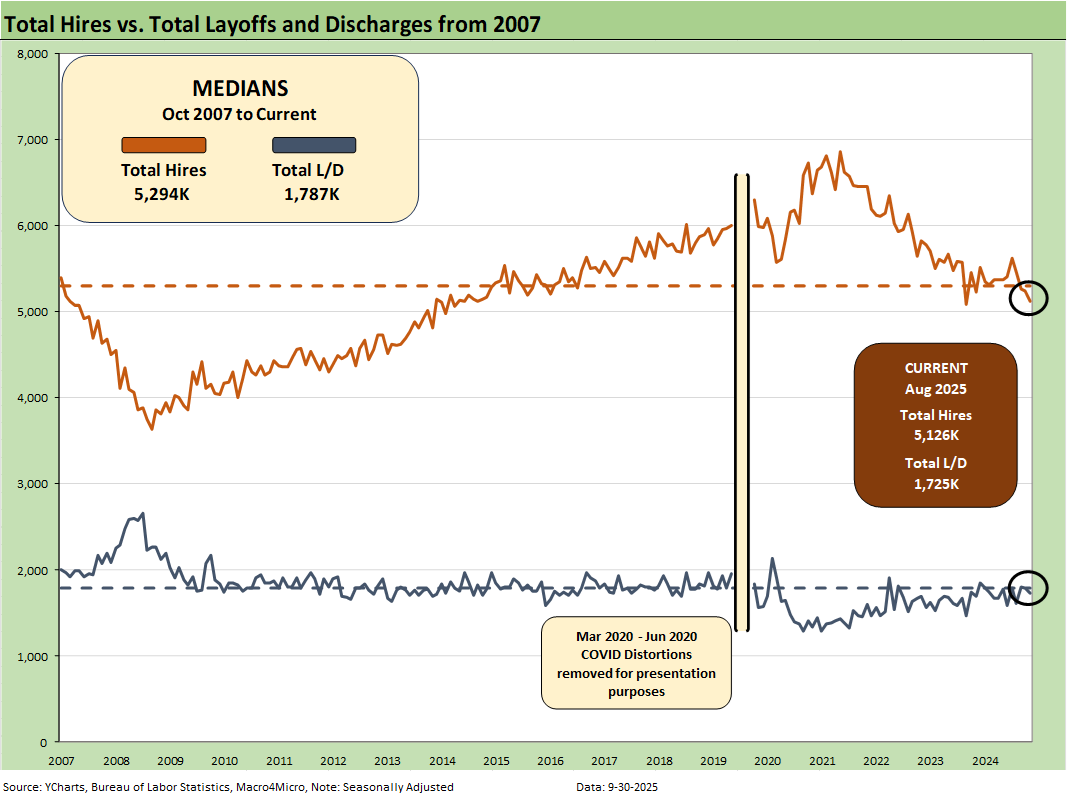
The above chart plots Hires vs. Layoff/Discharges on a SAAR basis. Note: we remove the COVID numbers from several charts to support the visual value for “normal” periods. For COVID distortions, see note at the end of the article.
Hires were down sequentially by -114K and down by -104K YoY. Decreases in Wholesale trade (-43K) and Transportation, warehousing, and utilities (-37K), Accommodation and food services (-50K), and State and local education (-15) were partially offset by gains in Construction (+22).
Notably, the Northeast and South showed significant YoY decreases in hires of -49K (-5.6%) and -184K (-8.4%), respectively, while the Midwest and West posted gains of +63K (+6.0%) and +67K (+5.9%), respectively.
Layoffs/Discharges decreased by -62K MoM, but increased by +28K YoY. MoM increases in Professional and business services (+34K) and Financial activities (+14K) were offset by decreases in Trade, transportation, and utilities (-63K) and Construction (-29K).
Layoffs/discharges in Professional and business services peaked at +545K in June, decreased to 418K in July, but rose again to 452K in August. MoM decreases in the South (-101K) and West (-56K) were offset by increases in the Northeast (+71K) and Midwest (+25).
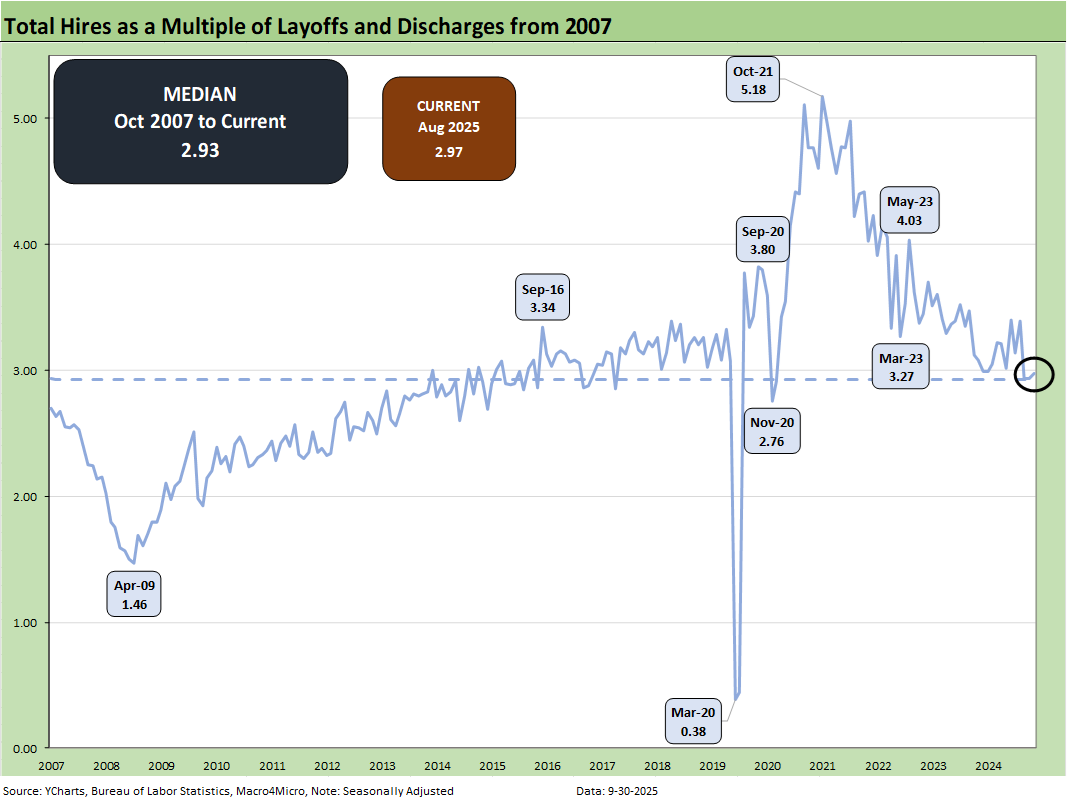
The above chart updates the ratio of Hires to Layoffs/Discharges. The relationship moved significantly lower this month from 3.24 to 2.97 just in line with the long-term median of 2.93 from 2007. The post-2007 period includes the longest recession since the Great Depression (Dec 2007 – June 2009) followed by the longest expansion from June 2009 to COVID (Feb 2020).
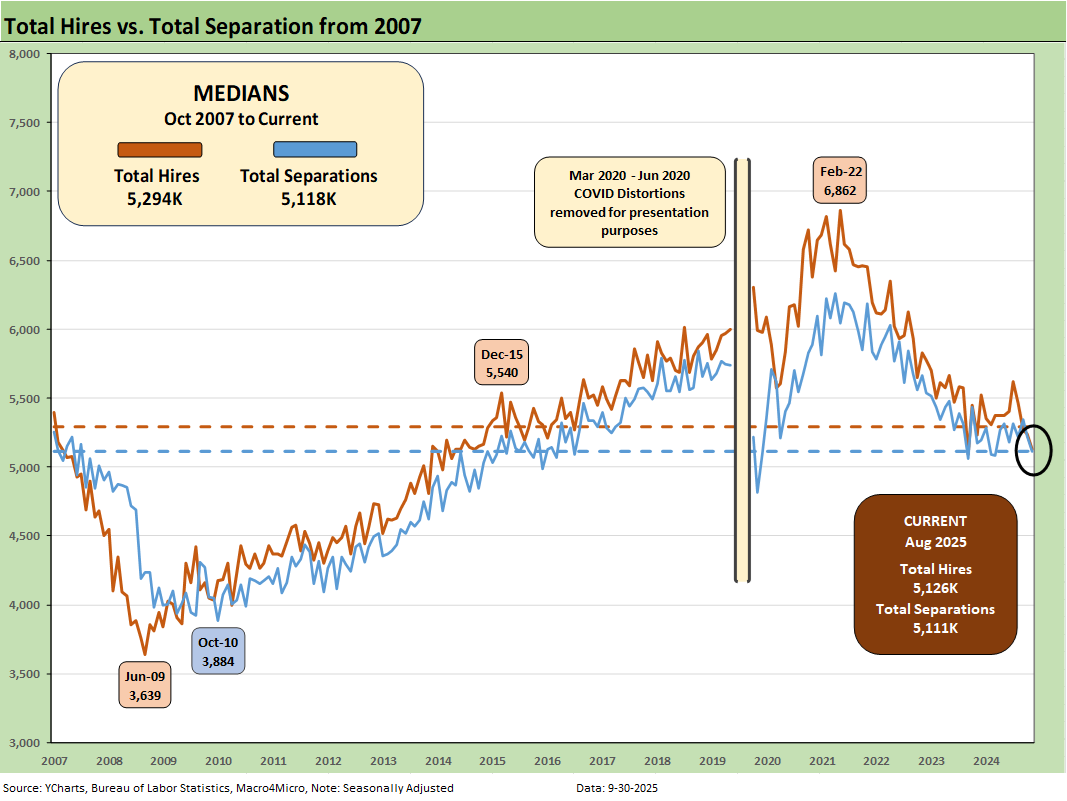
The above chart plots Hires vs. Total Separations on a SAAR basis. Separations include Quits, Layoffs/Discharges, and “Other Separations.” Total Separations were lower by -110 (-2.1%) sequentially and down -1.1% YoY.
For August, “Other Separations” moved higher by 26K (+8.8%) MoM to 295K from the June peak of 335K and was flat YoY.
We typically do not find “Total Separations” particularly interesting as a multi-line net number. But “Other Separations” still might get interesting in a world of mass deportation when people are getting “disappeared.” Did they “quit” by not showing up for work or did they get “othered?” There is also the uncertainty of how the de facto labor force gets measured and how many are “off the books.”
Overall, the ICE numbers have been low versus election rhetoric but the visuals of armed masked men with no IDs along with the violent removal process has been a toxic political flashpoint and a frequent, disturbing visual on social media. The very generous budget allocation to ICE will hopefully bring more training, discipline, and professionalism to the process. Or not.
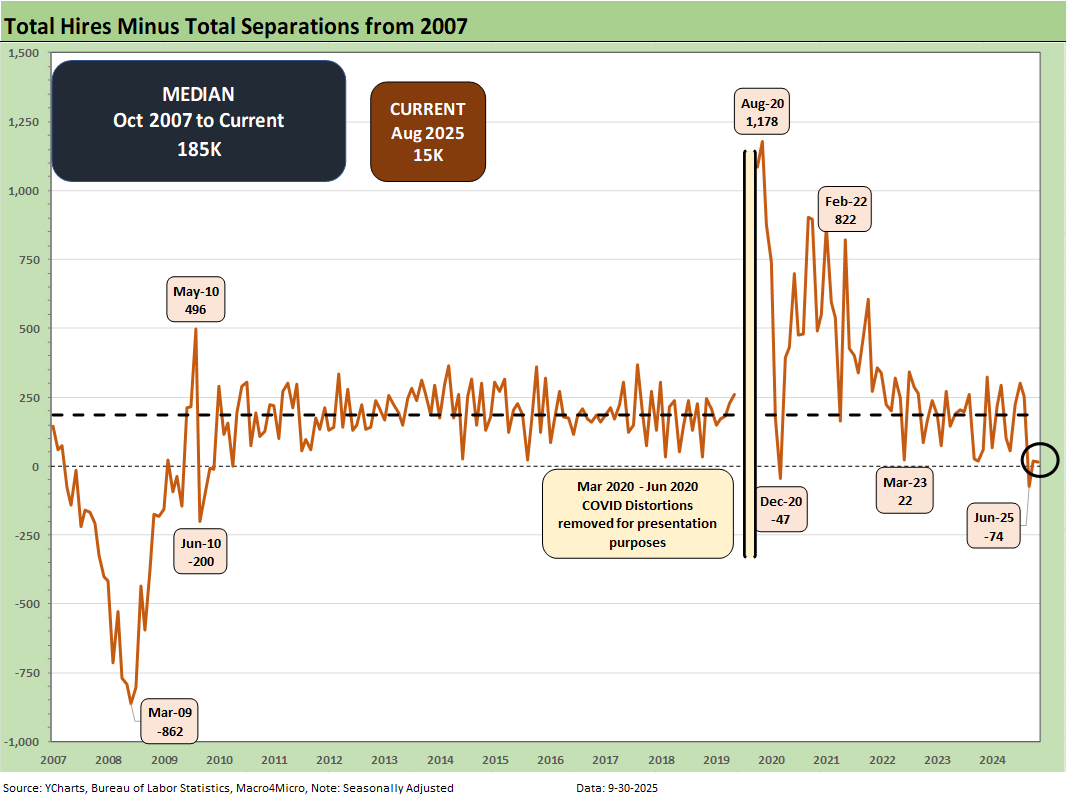
The Hires minus Total Separations differential is plotted above. We recently had some major revisions. Layoffs/Discharges for June had been revised upward by 192K, so that offers another negative data point in payroll trends. For August, Hires decreased -114K and Total Separations moved lower by -110K. The net number above has moved notably lower in recent months to +15K and is dramatically below the long-term median of +185K. The current differential is a weak number.
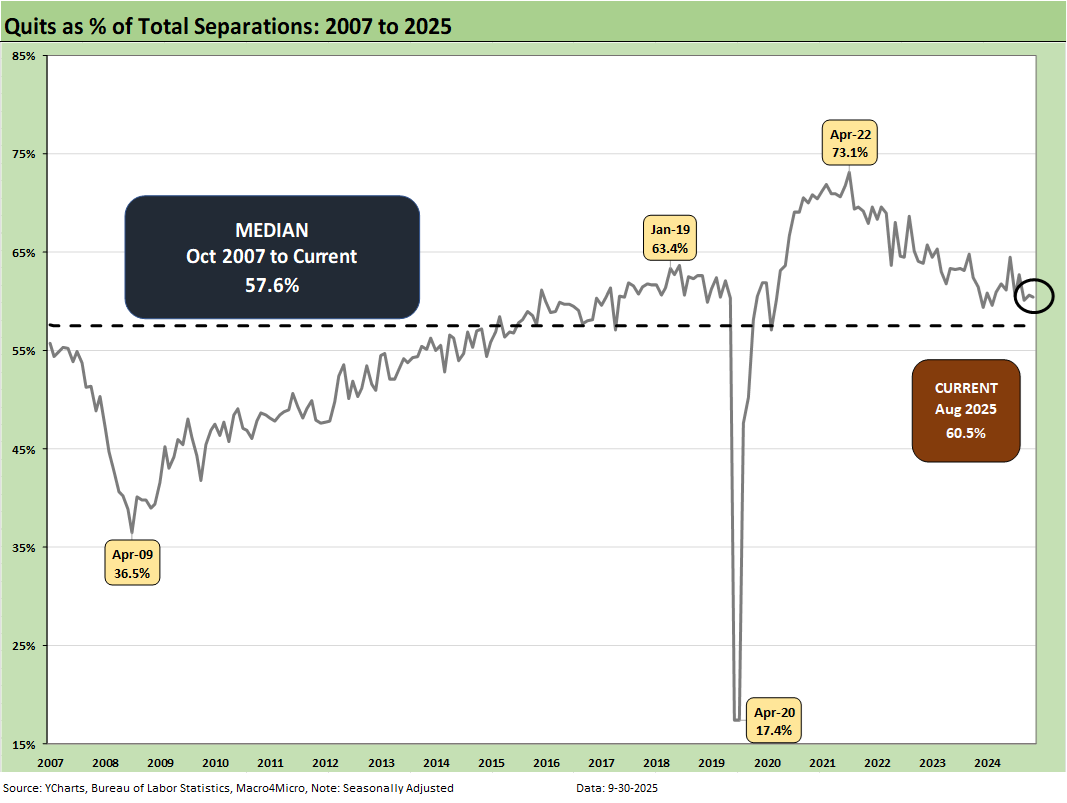
The time series for Total Quits as a % of Separations (SAAR basis) moved lower MoM to 60.5% from 62.1% and is above the long-term median of 57.6%. The classic “Quits Rate” is measured by Total Quits as a % Total Employment, and that metric moved lower on the month to +1.9%, down from 2.0%. The Quits rate is down slightly YoY from 2.0% to 1.9%.
The bottom line on JOLTS is that is continues the steady stream of signals that point at a softening economy that is likely to arm the FOMC with more easing ammo but only if they get more comforts around tariffs and price impact on goods.
NOTE ON COVID DISTORTIONS
The Hires vs. Separations time series make for interesting numbers but tough charts to plot visually given how much the spike in Separations/Hiring during COVID distorted the numbers from March 2020 to June 2020. The swings literally were off the charts. For presentation purposes, we adjust the charts above to exclude the raw data for those months to get a better vantage point on somewhat more normal times. Compared to COVID, the credit crisis seems “normal” in terms of the job count moves.
For disclosure purposes, Separations across March 2020 (16.3 million), April 2020 (11.6 million), May (4.7 million), and June (5.2 million) were running against Hires in March (5.2 million), April (4.0 million), May (8.1 mi/lion), and June (7.4 ml/lion). We remove those from the charts to get better scale visuals on the periods that precede and follow as the market saw 50-year lows in unemployment in 2022. Wild swings were had by all as industries saw shutdowns and layoffs in the COVID recession. The long-term medians from 2007 to 2022 for Hires and Separations were very close.
Almost 28 million Separations combined in March-April 2020 was a brutal reminder of that period.
See also:
Credit Markets: Cone of Silence Ahead? 9-29-25
The Curve: Easing Anxiety at Bat, Tariffs on Deck 9-28-25
Market Commentary: Asset Returns 9-28-25
Mini Market Lookback: Market Compartmentalization, Political Chaos 9-27-25
PCE August 2025: Very Slow Fuse 9-26-25
Durable Goods Aug 2025: Core Demand Stays Steady 9-25-25
2Q25 GDP Final Estimate: Big Upward Revision 9-25-25
New Homes Sales Aug 2025: Surprise Bounce, Revisions Ahead? 9-25-25
Credit Markets: IG Spreads Back in the Clinton Zone 9-22-25
The Curve: FOMC Takes the Slow Road 9-21-25
Market Commentary: Asset Returns 9-21-25
Mini Market Lookback: Easy Street 9-20-25
FOMC: Curve Scenarios Take Wing, Steepen for Now 9-17-25
Home Starts August 2025: Bad News for Starts 9-17-25
Industrial Production Aug 2025: Capacity Utilization 9-16-25
Retail Sales Aug 2025: Resilience with Fraying Edges 9-16-25
Credit Markets: Quality Spread Compression Continues 9-14-25
The Curve: FOMC Balancing Act 9-14-25
Footnotes & Flashbacks: Asset Returns 9-14-25
Mini Market Lookback: Ugly Week in America, Mild in Markets 9-13-25
CPI August 2025: Slow Burn or Fleeting Adjustment? 9-11-25
PPI Aug 2025: For my next trick… 9-10-25
Mini Market Lookback: Job Trends Worst Since COVID 9-6-25
Payrolls Aug 2025: Into the Weeds 9-5-25
Employment August 2025: Payroll Flight 9-5-25
JOLTS July 2025: Job Market Softening, Not Retrenching 9-3-25