Existing Home Sales Sept 2025: Staying in a Tight Range
September existing home sales continued the trend of rising prices and inventory but tepid sales volumes.
Sequential uptick in new homes sales volumes in 3 of 4 regions (Midwest declines) and higher YoY saw 3 of 4 post increases (the West was flat). Inventories are stubbornly high and were up sequentially from August (+1.3%) but up much more YoY at +14%.
There is still no getting around the reality that existing home sales remain depressed in the low 4 million handle range, inventories are high, and the low 6% handle mortgage rates remain a headwind given the 3% and 4% handles on so many mortgage holders.
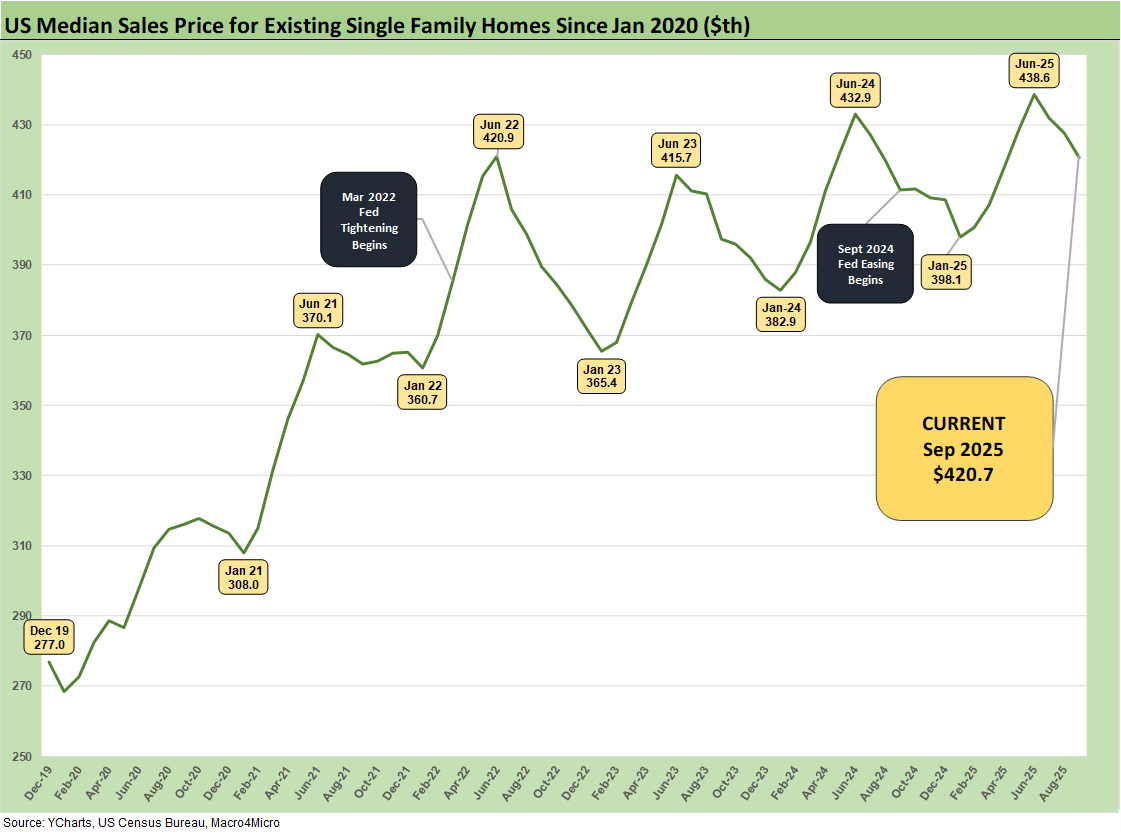
The $420.7K sales price for existing single family ticked lower sequentially, but higher YoY and remains a long way from the $277K price at the end of 2019. The $415.2K median price for all home types in Sept 2025 marked the 27th month of YoY price increases at a time when 6% handle mortgages dwarf those seen in the refinancing boom years and ZIRP period before the tightening cycle of 2022.
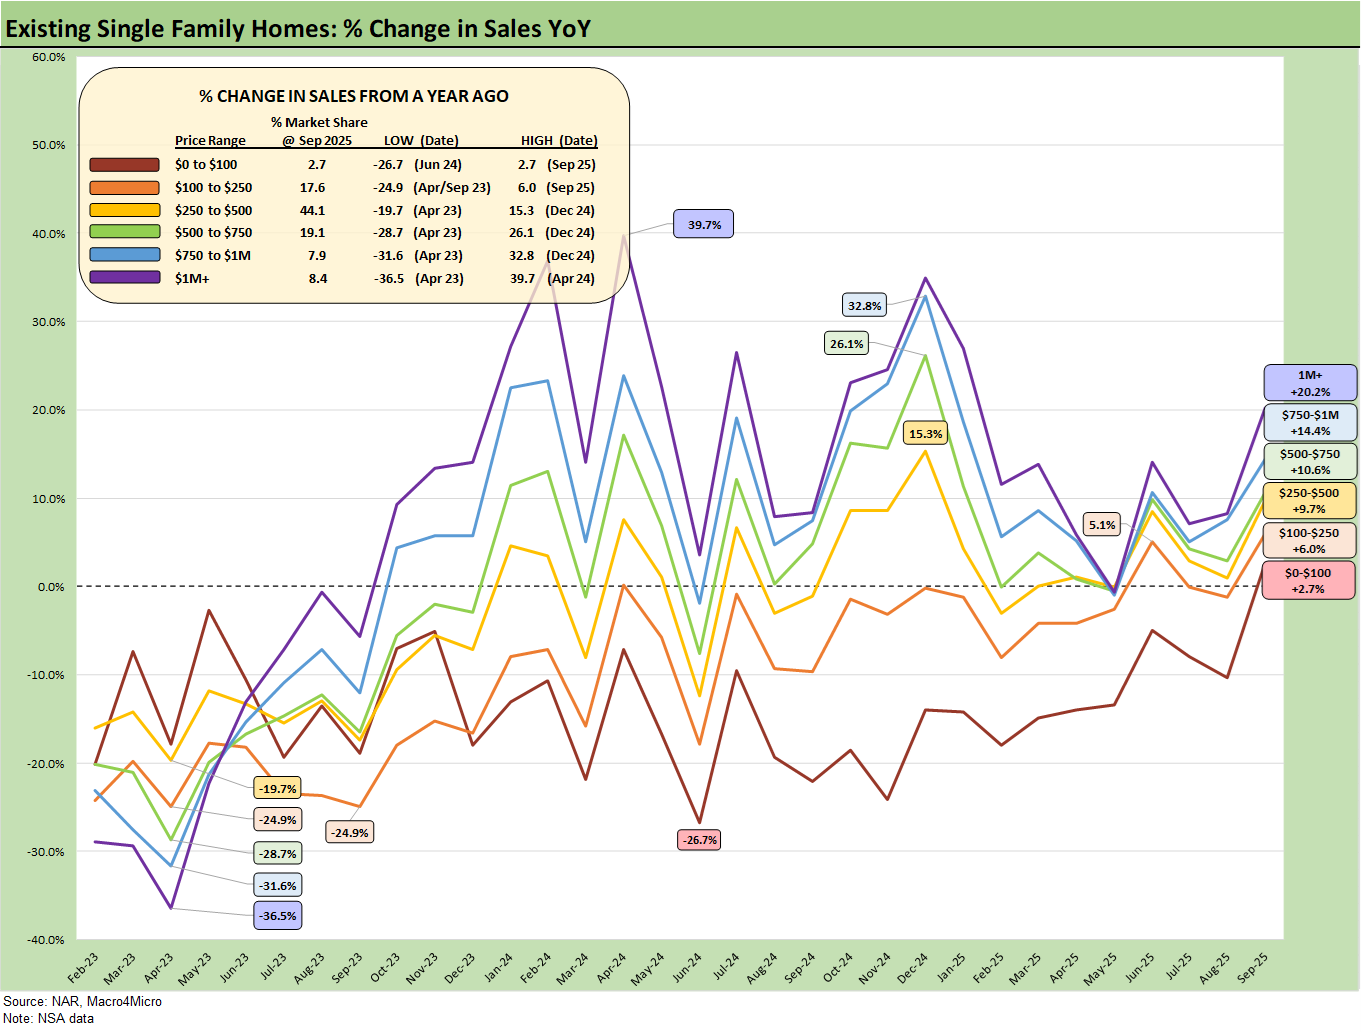
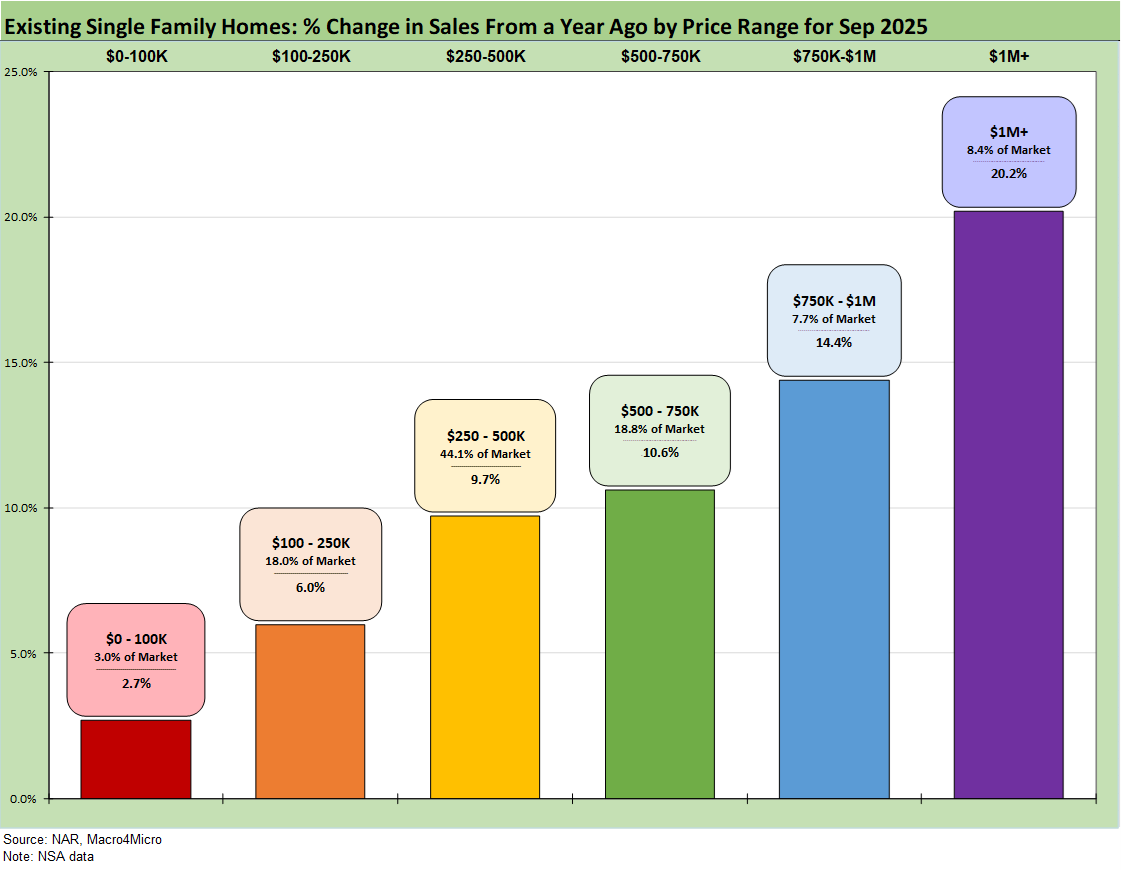
The above chart shows the sales volume deltas by price tier for Sept 2025, and we see increases for all 5 price tiers with dramatic increases from lowest price tier (+2.7%) to the highest price tier (+20.2%). We look at this mix from a different angle in the final chart in this collection.
With the Sept Fed cut of -25 bps and anticipated cuts totaling another -50 bps by year end (-25 bps Oct and -25 bps Dec), mortgage rates have slowly migrated back to the low 6% handle. That is giving both buyers and sellers across the tiers some relief, but the history of the Sept 2024 and 4Q24 FOMC easing reminds us that fed funds do not set mortgage rates, which for their part are more tied to the 10Y UST.
The threat of UST curve steepening pushing rates higher in the long end in 2026 is not gone given stubborn inflation and the gradual increase seen in numerous product groups in the CPI report. Headline inflation in Sept is right around where it was in Dec 2024 with CPI for All Items ex-shelter up by almost a point (see CPI September 2025: Headline Up, Core Down 10-24-25).
Recent declines in prices since June are helpful but not material. The significant uptick in the high price tiers tells a story of the K-shaped recovery in the broad economy and consumer sectors. While conditions have improved, the lower price tiers are still under pressure based on mortgage qualifications and monthly payment stress.
The slow growth in the lower tiers vs. more impressive moves in higher price tiers is a pattern we have seen frequently over the past year. That pattern seems likely to remain a factor unless Fed action or a more measured set of inflation numbers can help with mortgage rates getting back into the low 6% zone an upper 5% range.
The rising price trends sustain the affordability pressures with mortgage rates a very important variable in monthly payments. The barrier to selling in a “move up” trade, to downsize, and/or to make an empty nester change still reflects the “locked in” mortgage problem of trying to sell a 3% or 4% mortgage house and then taking on a 6% mortgage on other side of the trade. That is a well-known and much-discussed problem at this point (“golden handcuffs” etc.). Such trends also undermine move up sales/purchases.
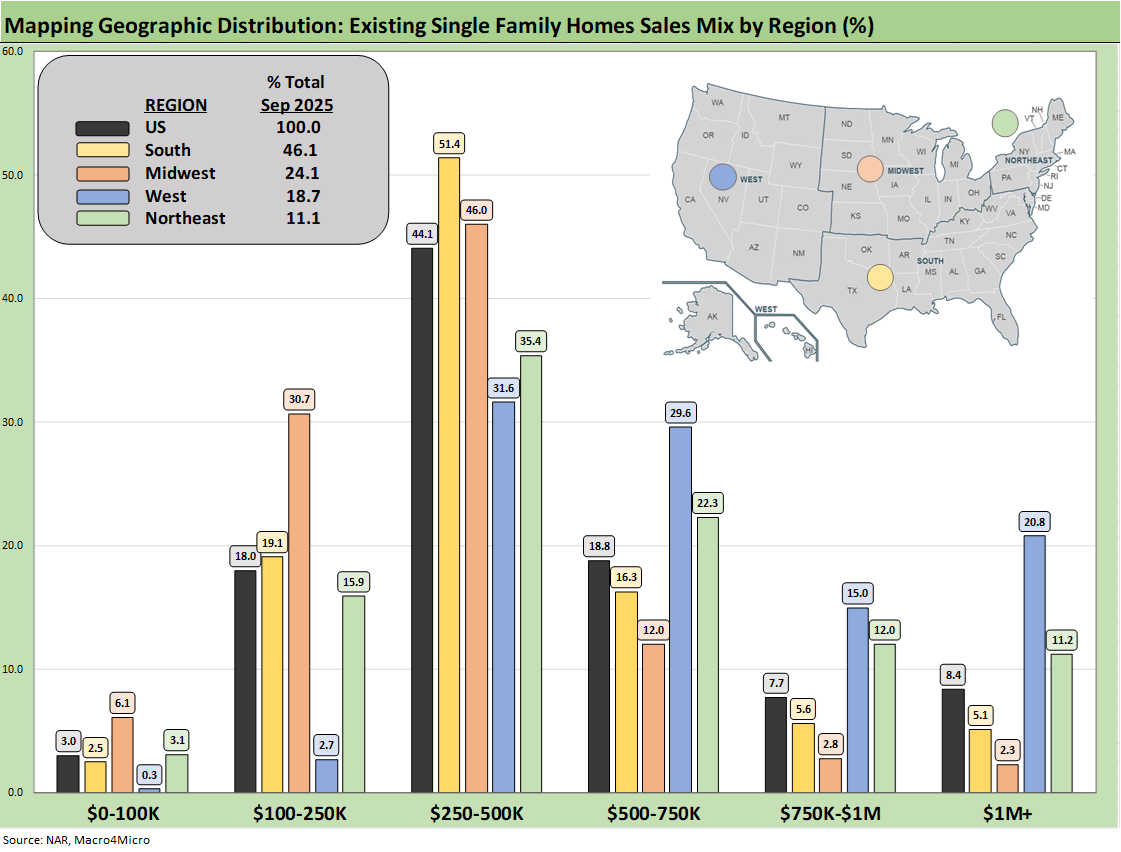
The above chart shows the geographic mix of volumes and details on price mix by region. The South is the main event in single family volumes whether new or existing at around 46%.
For the bar chart, we break out the mix for each region by price tier. For example, the South shows over 51% of its existing home sales volume in the $250k to $500K range and around 16% of its sales in the $500 to $750K bucket. The bars for each region add up to 100%.
The high cost of homes in the West (notably California) is clear enough in just by glancing at the bar chart with almost 21% at prices over $1 million. The second highest in the $1 million club is the Northeast at over 11%.
We see a big concentration in the $250K to $500K bracket for all regions at over 44% of the total and a heavy weighting in the $100K to $250K bracket for the Midwest at over 30%. The map explains what states are in each Census region. There is a very wide range of home price profiles in the West and Midwest.
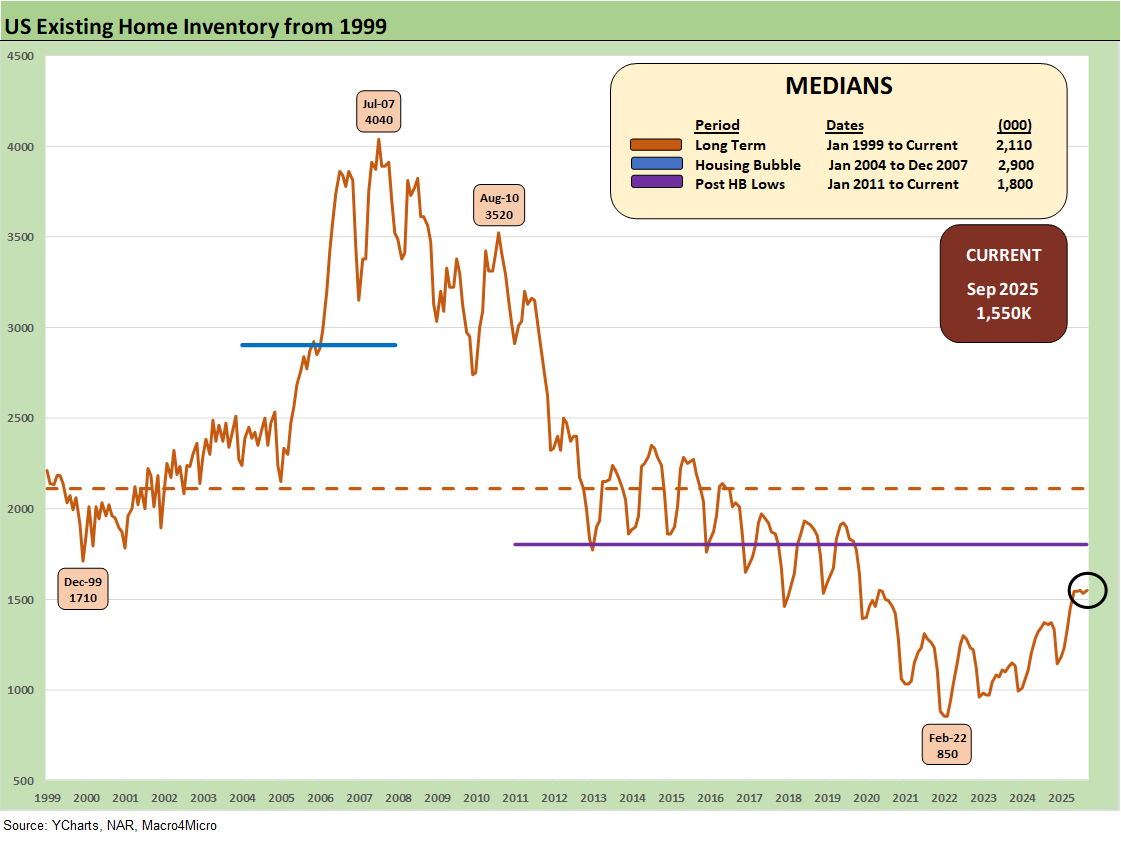
Inventory was essentially flat MoM at 1.55 million units but +14.0% higher YoY. The existing home inventory balance has shown a steady rise off the sub-1 million lows of 2022-2023. Inventory had risen into the 1.3 million handle range in 2024 before dipping back down to a recent low of 1.14 million to close out 2024. We have bounced off those numbers in 2025 to get back to the current 1.55 million.
We see the Feb 2022 lows at 850K above when demand was very high just before the tightening cycle kicked into gear in March 2022. Separately, single family home inventory is up by +13.4% YoY and up +0.7% sequentially. Condos and Co-op inventory is up by +15.0% YoY and +3.1% from Aug 2025.
The ability of prices to push higher in the face of rising YoY inventory has been one of the more multilayered issues across price tiers and regions. Whether it is the time-honored gap between seller and buyer or the belief that a sharp yield curve move could favor one side or the other, volumes suffer (and brokers are not too happy either).
We see many in the housing trade focusing on 6.0% as the trigger point for a sharp rise in sales. As noted earlier, the mortgage market was last at 6% in Sept 2024 around the FOMC easing but only briefly before the UST curve went higher and steeper and took mortgage rates along with it. Fed funds cuts in the fall of 2024 (that was -100 bps in 3 moves) were not magic for mortgages then, and the stagflation risks are higher today.
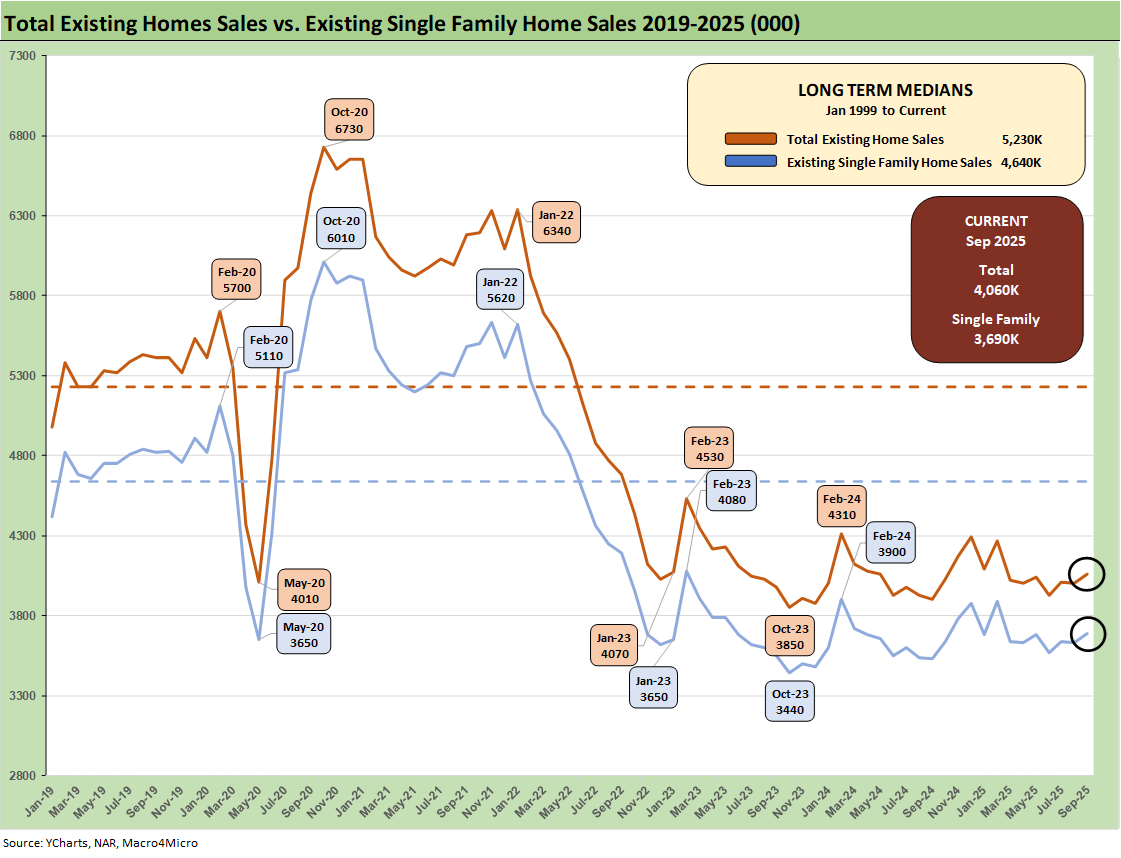
The above two-sided chart updates the trend line in total existing home sales vs. new single family homes. August new home sales numbers are reflected in the chart. We will not get updates on new home sales from US Census Bureau until the shutdown ends.
With mortgage rates shifting into the low-6% range again (Freddie Mac’s benchmark at 6.19% at 10/23, Mortgage News Daily survey at 6.19% on 10/24), the affordability headwinds are lighter but still a barrier for many buyers in looking across the highest volume price tiers.
We see a continued rise in inventory and higher median prices YoY, which show that the existing home sales market remains in somewhat of a state of dysfunction. The single family MoM median price decrease to $420.7K from June’s $438.6K in part reflects the end of the peak selling season and some mild rebalancing in this challenging housing market.
The trends reinforce the view that there are some “expectation challenges” in the buyer and seller ranks.
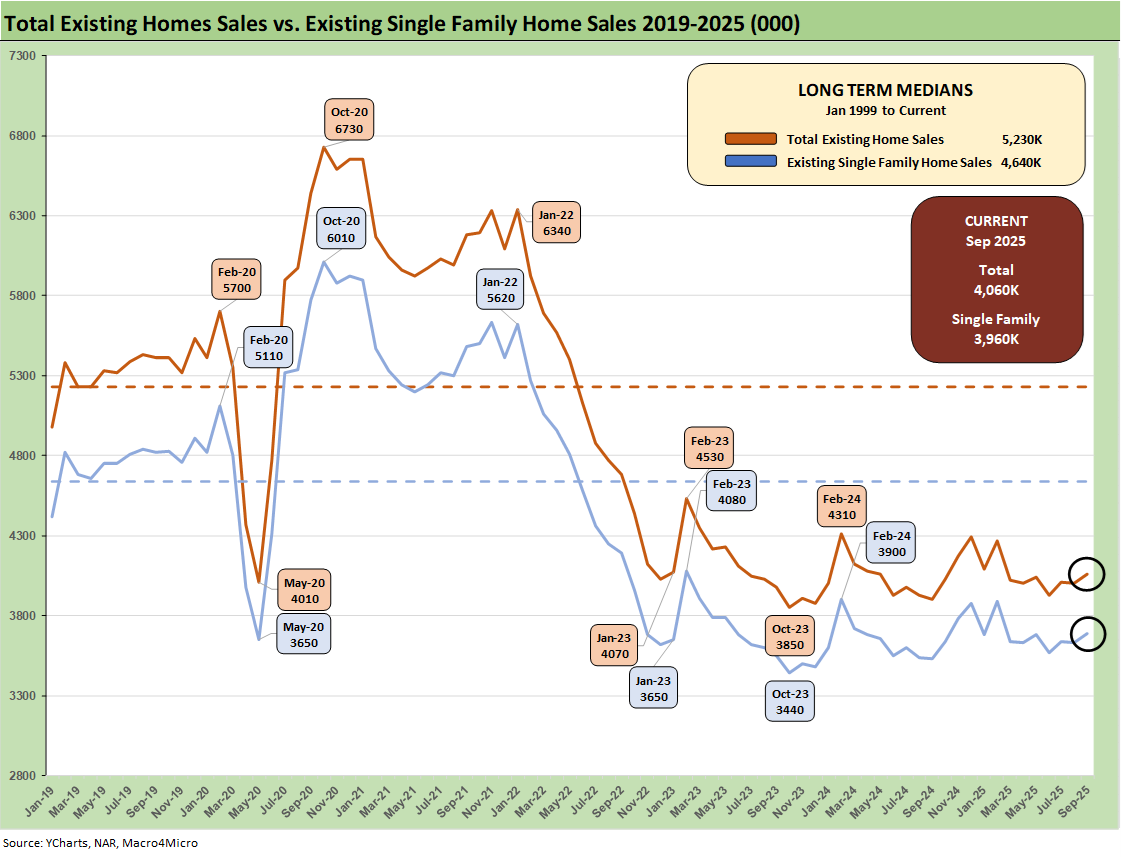
The above chart breaks out the timeline for single family alone of 3.69 million vs. total existing home sales of 4.06 million, which is well below the long-term median (from Jan 1999) of 5.23 million for total existing homes. Single family was +1.7% sequentially and +4.5% YoY (SAAR). The lower line is ex-condo/ex-co-ops. We saw 370K in condos and co-ops in Sept 2025, flat to 370K YoY in Sept 2024 and flat to 370K in Aug 2025.
The above chart updates the median price for existing single-family homes at $420.7 K after June 2025 hit a record $438.6K. The median price in Sept 2025 is dramatically above the $308K level back in Jan 2021 and $277K in Dec 2019 when mortgage rates were in a different zip code.
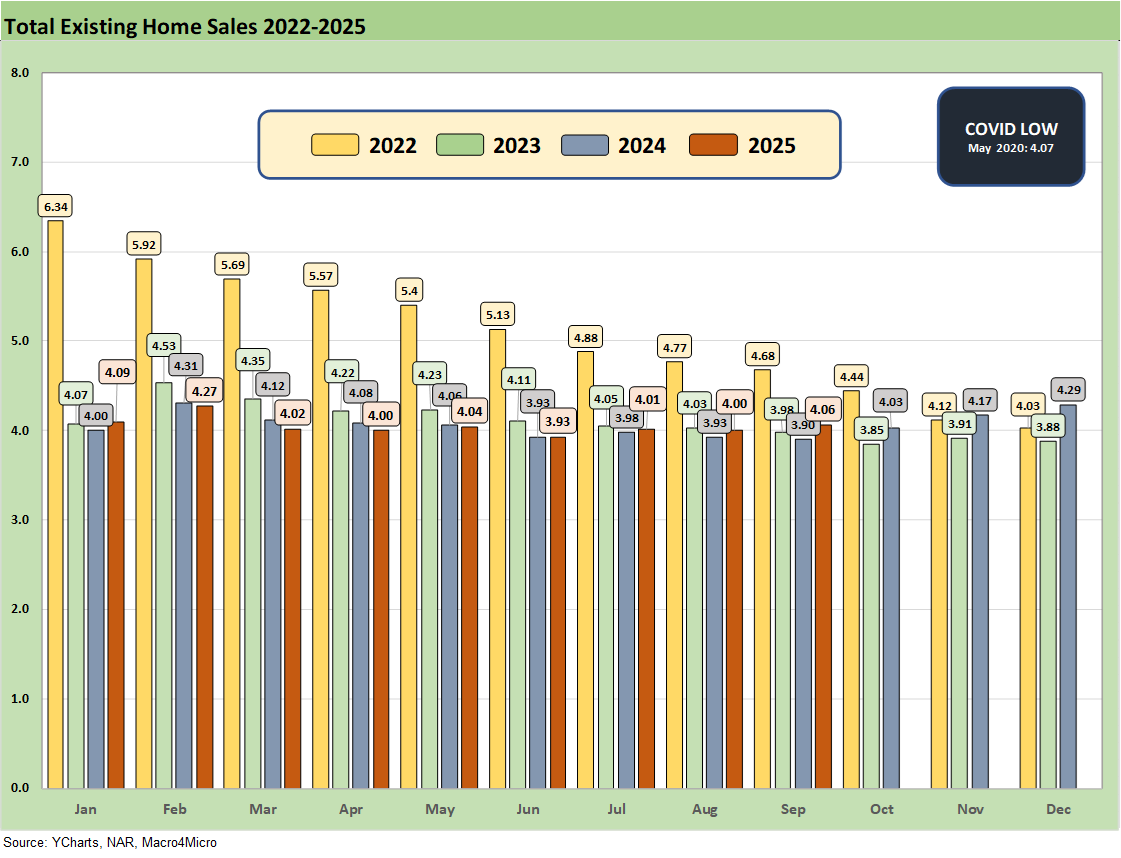
The above chart updates the monthly existing home sales across the timeline from Jan 2022 through Sep 2025. The existing home sales volume is a long way from the mid-6 and high 5 million handles of 2021 and then into early 2022 when many homeowners refinanced, and new buyers locked in low mortgages. ZIRP ended in March 2022 and then the UST migration began.
The Sep 2025 total of 4.06 million is slightly below the May 2020 COVID trough of 4.07, so the current run rates remain quite low in cyclical context. We had a few more sub-4 million handles along the way as noted in the chart, so this has been a brutal period for real estate brokers.
The above chart revisits the topical area addressed earlier on the existing home sales deltas by price tier. The largest tier is the $250K to $500K at over 44% of sales volumes, and that tier was at +9.7% in a month coming off the peak selling season.
The challenge for the lower tier buyer is somewhat evident this month with the $100K to $250K tier at +6.0% in a tier that comprises 18% of volume. The $500K to $750K tier is 18.8% of the market and was up by +10.6% for Sept. We see the $1+ million up by +20.2% for Sept. The highest price tier is +8.4% of the market.
Positive trends overall still get back to the reality of low volumes and the obvious trend that homebuyers with more money are better off.
See also:
Mini Market Lookback: Absence of Bad News Reigns 10-25-25
CPI September 2025: Headline Up, Core Down 10-24-25
General Motors Update: Same Ride, Smooth Enough 10-23-25
Credit Markets: The Conan the Barbarian Rule 10-20-25
The Curve: My Kingdom for 10 Cuts 10-19-25
Market Commentary: Asset Returns 10-19-25
Mini Market Lookback: Healthy Banks, Mixed Economy, Poor Governance 10-18-25
Mini Market Lookback: Event Risk Revisited 10-11-25
Credit Profile: General Motors and GM Financial 10-9-25
Mini Market Lookback: Chess? Checkers? Set the game table on fire? 10-4-25
JOLTS Aug 2025: Tough math when “total unemployed > job openings” 9-30-25
Mini Market Lookback: Market Compartmentalization, Political Chaos 9-27-25
PCE August 2025: Very Slow Fuse 9-26-25
Durable Goods Aug 2025: Core Demand Stays Steady 9-25-25
2Q25 GDP Final Estimate: Big Upward Revision 9-25-25
New Homes Sales Aug 2025: Surprise Bounce, Revisions Ahead? 9-25-25
Mini Market Lookback: Easy Street 9-20-25
FOMC: Curve Scenarios Take Wing, Steepen for Now 9-17-25
Home Starts August 2025: Bad News for Starts 9-17-25
Industrial Production Aug 2025: Capacity Utilization 9-16-25
Retail Sales Aug 2025: Resilience with Fraying Edges 9-16-25
Mini Market Lookback: Ugly Week in America, Mild in Markets 9-13-25
CPI August 2025: Slow Burn or Fleeting Adjustment? 9-11-25
PPI Aug 2025: For my next trick… 9-10-25
Mini Market Lookback: Job Trends Worst Since COVID 9-6-25


