
Synchrony: Credit Card Bellwether
We dig into what Synchrony tells us about consumer credit quality with its connection points to almost 70 million Americans.


Synchrony (SYF) as a bellwether and consumer indicator: With all the debate going on around consumer asset quality, the direction of “sentiment/confidence” benchmarks, and the propensity of households to spend, we keep looking for good indicators closer to the trenches. That is, we want to add more information to track beyond the monthly PCE release (income and outlays) or the PCE lines in GDP updates. We thought it worthwhile to add a leading consumer credit bellwether to the collection. Transaction trends (volume, frequency, payment rates, value growth, etc.) tell a story, and the 3Q25 numbers at SYF support the consumer resilience theme.
Company reports beat BLS and BEA data these days: We like using bellwethers generally across industries to get a read on the macro direction of household habits and the consumer sector. We chose a leading credit card player that can be used as another indicator. SYF is close to being a pure play on credit cards, so they are a good pick as a large cap with a long history (as a unit of GE before the 2014 IPO and 2015 split-off). SYF also offers extensive, granular quarterly disclosure generated off a wide range of “partners” in retail and spending groups in their five “Platforms.”
SYF has a very wide range of partners and customers in their channels: SYF touches almost 70 million consumers, so that is a useful starting point for extrapolation from the consumer level while we also track big ticket sectors such as housing and autos. SYF only has a single digit % mix of lower credit tier customers, so the challenge of subprime risk is a separate channel to track with other issuers. The “partner” mix includes major mega-retailers including digital leaders with household names such as Amazon and Walmart/Sam’s Club in the mix. Headline names come along with myriad regional retailers and selling groups. SYF details the range of partners and related location counts on its site.
Credit trends at Synchrony are stable: The “stable outlook” from the rating agencies for SYF are easily defended based on SYF balance sheet health and asset quality. We are not looking to play bank analyst on SYF or to place SYF credit quality or relative value in the peer group context of the banks. We are more zeroed in on what the operating performance, asset quality metrics, and the overall platform strategy of this major credit card and consumer finance bellwether says about the consumer sector resilience factor. That is a hot topic at this point in the cycle and notably with payrolls under a cloud and some subprime headlines creating some excitement (e.g. Tricolor).
SYF operating performance has won over the stock market: Profitability, asset quality metrics, and balance sheet health paints a picture of stability in credit but the equity markets vote has been favorable also as we detail below. SYF’s risk profile as a bank (technically an S&L Holding Company under the OCC umbrella) brings regulatory checks (including the FDIC ) and a very high mix of deposit funding at the bank level at 85% of total funding. For macro extrapolation, SYF 3Q25 offers inputs on transaction volumes and payment rates, so the directional color adds value. In SYF’s case, they had been defensive in recent periods and had tightened credit, but they are shifting modestly again given the favorable credit trends they have experienced. As we have seen with a number of banks, SYF has been releasing reserves from a very large allowance. SYF’s reserve cushion is north of 10% as detailed below.
Net interest margins and yields vs. charge-offs bring good news: As a financial subsector, credit cards are riskier than auto loans and residential mortgages. The net interest income margins in 3Q25 of 15.6% can be framed against a loan receivables yield of 21.9%. That type of yield and more than adequate reserves and prudent provisioning policies offer a comfort zone and a lot of room to absorb surprises.
SYF equity performance in the context of broader benchmarks stacks up favorably: The objective operating numbers show impressive stability across a wild period of inflation, tightening, and tariff worries since 2019 that underscore consumer sector resilience. Over the past 5 years, SFY equity return beat the S&P 500, the small cap Russell 2000, and the Midcaps while also trouncing the Financials ETF (XLF). That performance comes in a mature business where SYF has executed well while embracing creative technology solutions and channel strategies to serve more consumers/borrowers. Basically, it is an interesting company.
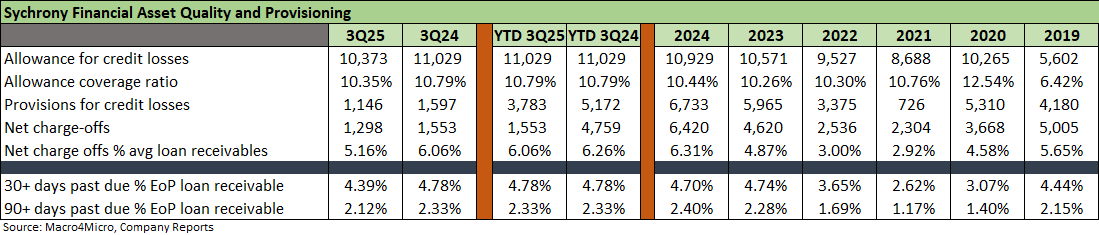
The asset quality trends have been favorable through 3Q25: The quality performance has allowed SYF to release more reserves and stay ambitious in its stock buybacks. Delinquencies and charge-off rates are down YoY in 3Q25 with a reserve allowance cushion of +10.35% vs. 3Q25 charge-off rates of 5.16% in 3Q25 (down from 6.06% in 3Q24). The platform strategies cut a very wide path and SYF works with such major players as Amazon and Walmart (a new product plan rolling out with WMT into 2026 after its earlier deal ended in 2018).

The game is about capturing the consumer and the right partners: The visual above on “CareCredit” struck us as one of the opportunities that allows SYF to tap into such a wide range of partners. Healthcare is one of the largest sectors in the economy (18% of GDP). As we detail below, Digital and Wellness are two of the targeted growth areas. In the sections that follow, we run through some of the more interesting disclosures from what is described as one of the largest “monoline” credit card and consumer lending banks. There are bigger banks with higher credit card market share, but those are the banks that operate across a much wider array of business lines.
Disclosure and details help: The big bank disclosure and granular operating analysis does not offer the array of angles you get with Synchrony. We will dig into Ally in coming days with their stand-alone consumer story, and we always have the “captives” at GM and Ford along with major equipment finance operators such as Deere Capital and CAT Financial for color on consumers and small/mid businesses. For a view on the consumer, we chose Synchrony as the best name to lock in on for a gut check on the consumer and related credit quality patterns at the household level.
The 3Q25 earnings call brought phrases such as the following:
“…we still think the consumer is in pretty good shape. They’ve been very resilient.”
“…pretty optimistic in terms of the trends we’re seeing across the portfolio.”
“…we’re pretty optimistic in terms of everything we’re seeing from the consumer”
“…we’ve begun gradually reversing some of our tightening in areas where we see strong risk-adjusted growth opportunities.”
“…continued strength in our credit performance and acceleration of our purchase volume trends…was broad-based across our 5 sales platforms and all generations.”
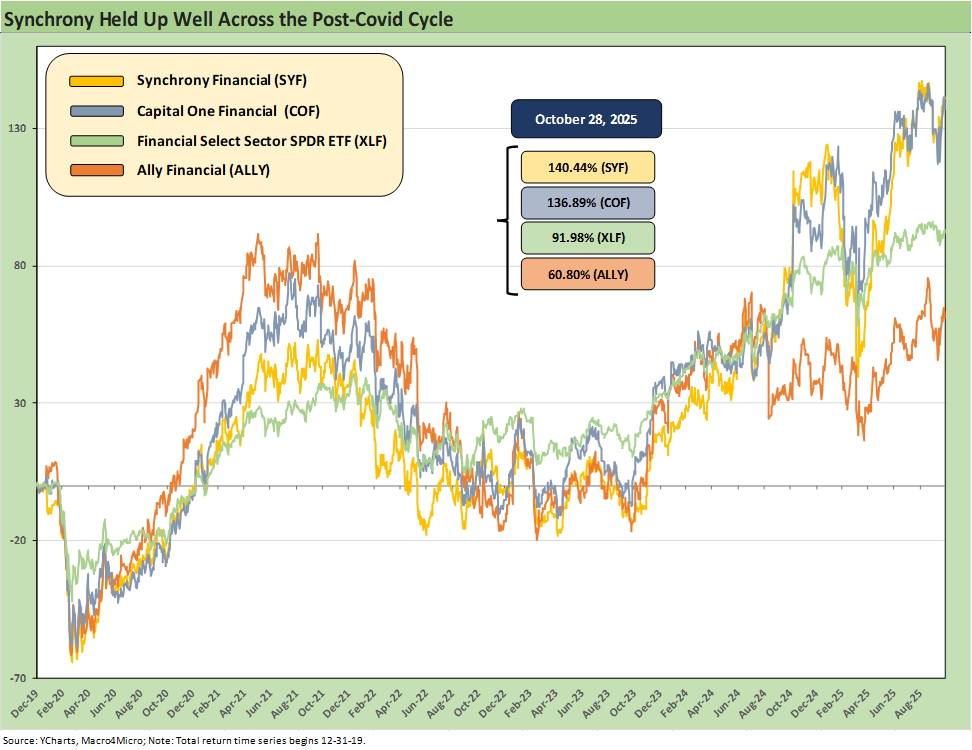
Vote of confidence from the equity markets: The above stock return chart covers the last stretch of time starting in 2019 just ahead of COVID. The SYF equity returns across the years underscore that Synchrony has been a solid performer vs. the broader financials group. The comps above include a notable consumer-exposed bellwether such as Ally, which is an on-the-run choice in the credit markets for many bond investors investing in middle-tier credits. SYF even edged out Cap One (COF) during that timeline. SYF also ran ahead of the broader Financials ETF (XLF). Not shown in the above chart is that SYF beat the S&P 500 and the Regional Bank ETF (KRE) since 2019. We look at more comps and timelines further below.
Cap One as another guide: One major name that beat Synchrony over 10 years was Cap One (COF). COF has grown from a credit card player and “mailbox stuffer” with applications in the “old days” (the 90s) to now being a top 10 bank with a wide range of operations and a market cap over $140 bn. That compares to SYF at $27 bn and Ally Financial at over $12 bn. The impressive success of Capital One’s history is a reminder that a financial operator such as SYF has a lot of ways to grow profitably. Good credit systems and controls and execution have helped them so far.
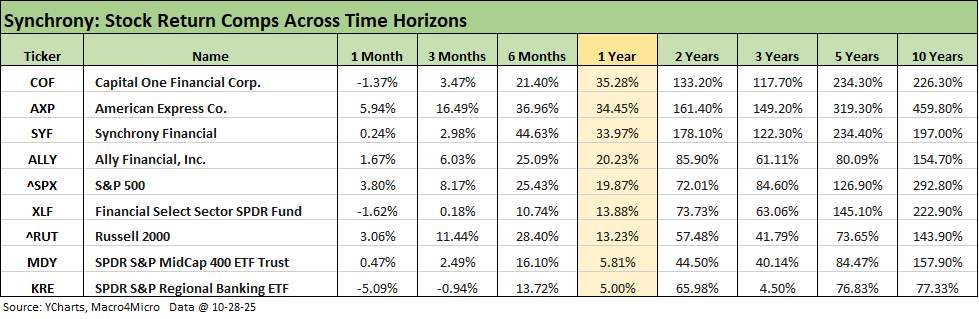
The broader time horizon performance: We look at the broader mix of financials and market comps across various time horizons in the table below. COF still shows the majority of its loans being in credit cards, but consumer credit (e.g. auto loans) and commercial banking are major operations also. The strategic question longer term for SYF vs. COF revolves around where SYF will seek to pursue loan growth. We see SYF as the better one as a consumer proxy for our purposes since they give so much disclosure and in-the-weeds detail. In terms of consumer health, the recent American Express performance and color from 3Q25 is on the “consumer is all right” bandwagon. The minimal AXP charge-off rates agree.
The past cycle saw the consumer shine: The timeline below covers a busy cycle running across a pandemic that saw a return to ZIRP and then a post-COVID consumer spending boom that rolled into an inflation spike and ensuing tightening cycle. SYF held up very well across the timeline with the trailing 1 year showing Cap One, SYF, and American Express well ahead of the S&P 500. SYF put up very strong numbers over 6 months.
Extrapolation value with a lot of data points: SYFs desire is to grow its receivables base in a profitable manner and at healthy net interest margins. That process comes with rigorous disclosure from SYF that offers an extensive array of angles to view the company and consumer spending patterns. The various retail groups and organizations in the partner network offer some useful extrapolation into a bigger macro picture around consumer spending. The PCE lines for goods and services generate 68% of GDP, and credit cards play a big role.
Consumers face a credit test ahead: Markets had been getting consumer credit jitters and were starting to worry about an asset quality cycle that has proven to be relatively immune to the headlines across COVID and the tightening cycle. The latest test for consumers is payroll anxiety, tariff worries, health care cost escalation (notably health care premiums). The worries offer a good reason for us to start tracking Synchrony as one of the bellwether indicators of delinquencies and charge-offs. The lack of macro data from BLS and BEA is not helping at this time since the cyclical transition to slow growth is in evidence. That is, there is cyclical pressure in evidence once you adjust for the GDP distortions from declining imports that juice up headline GDP numbers (see 2Q25 GDP Final Estimate: Big Upward Revision 9-25-25).
SYF’s main focus is credit cards, so the feedback is valuable: We get broad top-down commentary on the consumer sector from the megabanks (JPM, BofA), but SYF earnings calls really dig into the nuances of credit cards and across the five platforms. Examples include how they view student loan borrowers’ credit attributes across time in terms of credit card performance. They also address borrower generation trends and customer profiles along with payment rate color (i.e., maintaining a debt balance vs. pay-down). The vantage point that SYF can bring to consumer habits cuts across hundreds of consumer segments and different products and services (e.g. health care and veterinarians). SYF paints a useful picture.
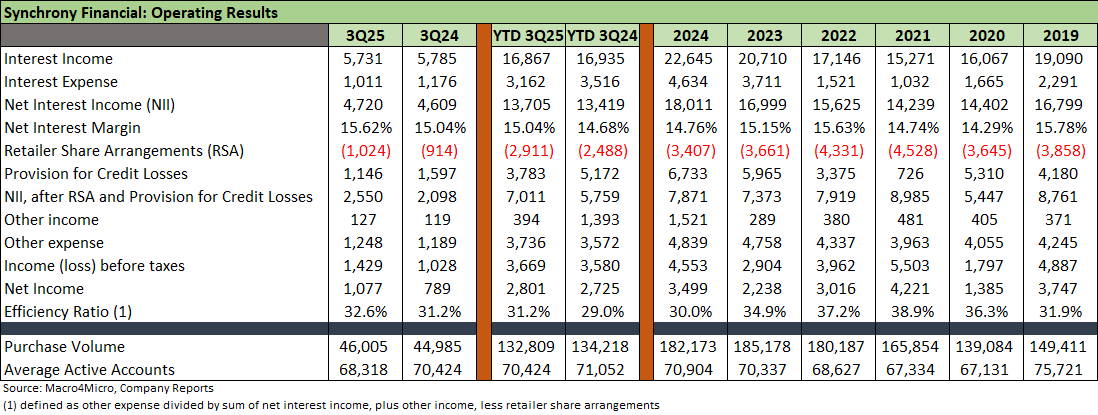
Interest income was essentially flat in 3Q25 and 9M YTD 3Q25 YoY: Interest income climbed off the bottom from 2021 to 2024 along with interest expense. The return to ZIRP with COVID in March 2020 continued across the full FY 2021 period, and that shows up in the income numbers. The very high yields on credit cards never fails to impress at 20% handles (21.9% for 3Q25), and the main challenge for SYF is to be prudent in provisioning based on borrower quality, history, and mix. The moving parts of net interest income shows a net margin of 15.6% in 3Q25 after 14.6% in FY 2024 and 15.1% in FY 2023. The direction of net interest margins (“NIM”) will tie into the FOMC actions and how that flows into deposit costs. Lower provisioning and reserve releases have helped bolster earnings based on favorable asset quality trends.
For 3Q25, purchase volumes grew but were lower YTD: The 3Q25 picture showed purchase volumes higher by 2% to $46 billion (vs. $45 bn in 3Q24). Average transaction value rose YoY for the 4th straight quarter to a modest +0.4%. SYF cited improvement across all credit grades and generations in the portfolio. “Spend frequency” rose by +3.4%. Based on the portfolio performance, SYF even started to ease up on some earlier credit standards tightening. These data points go in the positive column for the health of the consumer sector.
Receivables guidance calls for flat growth in FY 2025: As detailed further below the net receivable balance was slightly lower at -2% and total active accounts down by 3% to over 68 million. Receivable balances can be a function of numerous variables including new business asset transactions (buy/sell receivables), and payment rates by cardholders and how that flows into card balances and interest income.
Asset quality improving: As we cover in the asset quality detail further below, charge-offs remained materially below the loan loss cushion from 2020 to 2025 that averaged above 10%. The provisioning line has some notable distortions in 2021on some major asset sales, some regulatory adjustments, and some reserve releases tied to very favorable charge-off trends in 2021-2022 despite the COVID hangover. Receivables growth kicked into gear again in 2022-2023.
Retailer share arrangements (“RSAs”): The RSA line moves with volumes and partner terms. RSAs are described by SYF as follows: “Most of our program agreements with large retail and certain other partners contain retailer share arrangements that provide for payments to our partner if the economic performance of the program exceeds a contractually-defined threshold. Economic performance for the purposes of these arrangements is typically measured based on agreed upon program revenues (including interest income and certain other income) less agreed upon program expenses (including interest expense, provision for credit losses, retailer payments and operating expenses)…All of these arrangements are intended to align our interests and provide an additional incentive to our partners to promote our credit products.”
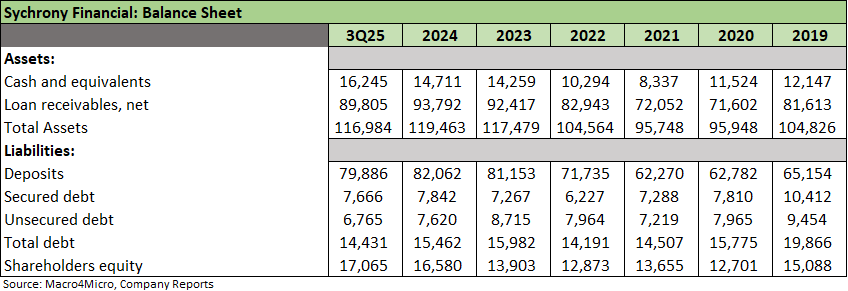
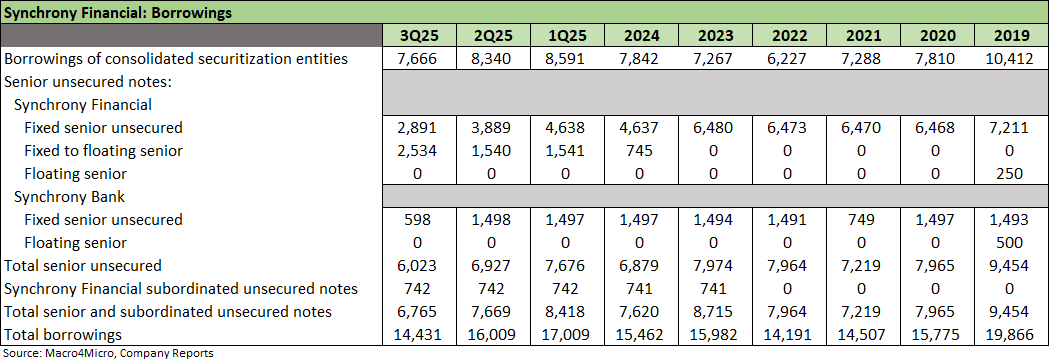
Growth has slowed from the peak: The above table details the balance sheet since 2019. We see a sharp decline in 2020-2021 in loan receivables followed by a rapid rise in earning assets as we detail below in the platform breakouts. The decline in 2025 in loans is expected to reverse in trend during 2026 based on management 3Q25 commentary.
The growth challenge earlier in 2025 was a good news/bad news outcome: The good news was that SYF was more defensive on credit and showed a desire to be prudent. The bad news was more for the equity side that wants to see growth, better asset quality, and higher net interest margins. Basically, growth lagged. Asset quality is objectively better (some reserve releases are not offsides), and now growth is resuming with some easing and new partner deals that should drive more volume into 2026.
“Cuspy” parent credit ratings: The absence of a Moody’s rating on parent unsecured bonds (BBB- S&P, BBB Fitch) raises some eyebrows, but we were never one to set our sundial by what the agencies think. The BBB- rating will intrinsically affect bondholders at the margin, and that is just the reality. The “cuspy” holding company bond rating of BBB- from S&P do not seem to give much credit to Synchrony for its very successful navigation of a credit cycle that included a pandemic, an inflation spike, a major Fed tightening cycle, and recurring predictions by many of the impending doom of the consumer. In contrast, the equity market rewarded SYF performance.
The bank level debt is BBB by S&P and BBB by Fitch: The holding company notch by S&P to BBB- vs. bank level debt also is one that will keep bondholders on alert in the absence of a Moody’s rating. Bondholders will naturally wonder whether there were some disagreements with the one agency. The logical scenario is that there was a dispute years ago when SYF was less “proven” outside of GE, and in the end SYF stayed with the two agencies who were fully on board.
The credit story is favorable in the numbers even if the agencies are not helping: For our purposes (we are not playing bank analyst) it is the direction of consumer asset quality and operating stats that matter more (volume, mix, platform channel color). The excess capital, strong net interest margins, and the level of profitability allow for aggressive buybacks. At the very least, the objective numbers offer some favorable empirical support that SYF has a healthy financial profile.
Favorable balance in funding strategies: The diversity of the capital structure is reassuring given the balance across the various funding markets from the dominant funding layer of deposits to unsecured debt markets at the parent and bank level. The current non-deposit mix is more optimally balanced than 2019 across funding sources in ABS, parent company bonds, bank level debt, subordinated debt, and preferred stock including fixed and floating rate (some on fixed to floating). For 3Q25, deposits were 85% of total funding, unsecured debt 7% and secured debt 8%.
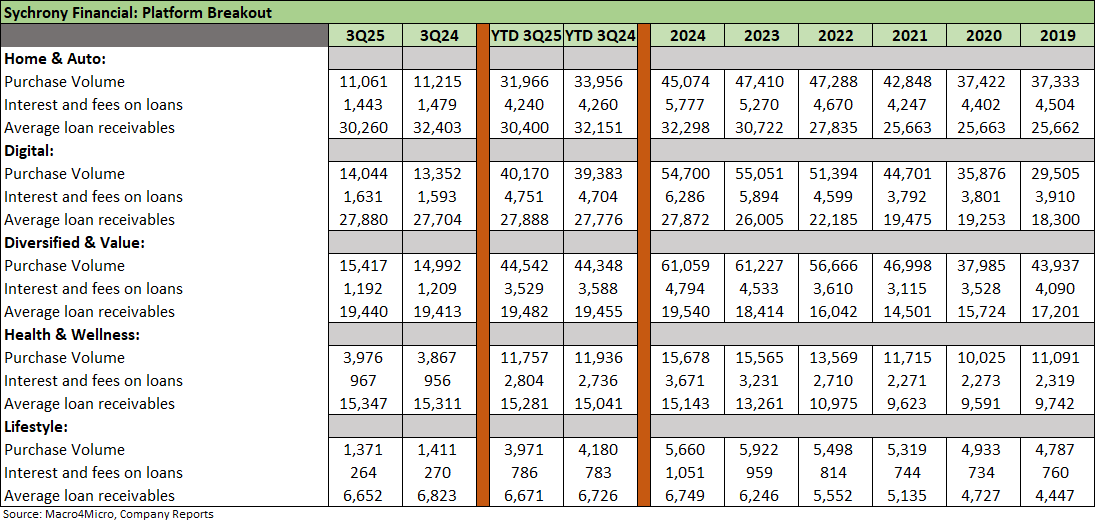
The moving parts across the five SYF platforms tell a balanced story: These breakdowns underscore the impressive range of SYF’s customer base and partners in their credit card operations whether dual branded or private label. Partners run the gamut from highly recognized national and global names (e.g., Amazon, PayPal, Sam’s Club, Lowe’s) to more obscure retailers and payment programs. Each platform disclosure allows investors to frame purchase volume (up 3% in total) and loan receivables (down -2% in total). We see 3 of 5 platforms posting higher purchase volumes. The average receivables balance in 3Q25 posted minimal movement YoY with 3 of 5 slightly higher. Interest income and fees posted small moves also with 3 of 5 lower in 3Q25 YoY.
Well-managed duration of credit card program agreements: The program agreements with the 5 largest partners have expiration dates that range from 2030 to 2035. 22 of the 25 largest programs have expiration dates in 2027 and beyond. In the 9 months ended 3Q25, SYF added or renewed over 40 partners. This is part of the routine details provided as SYF makes ongoing announcements in press releases of their additions and renewals.
Dual branded and co-branded cards: The dual/co-branded mix was 46% of total purchase volume in 3Q25 (+8% vs. last year). Consumer dual and co-branded cards were 31% of total loan receivables at 3Q25. Major product categories also include private label and general-purpose credit cards. SYF saw higher broad-based spending across these programs as well as the Synchrony-branded, general-purpose card. This color is consistent with some of the firm retail sales numbers seen in economic releases as 2025 proceeded, and the signs there signal a resilient consumer sector. SYF cited “continued points of strength coming from restaurants and electronics.”
The platform mix cuts a wide path in retail and digital: We line the platforms up in descending order of receivables. Purchase volume, interest income and fees, and average receivables are detailed. Home & Auto is the only one with a significant decline in receivables but purchasing volume only saw a slight decline. Looking across the timeline, the Digital platform unsurprisingly shows healthy growth. Technology is an obvious catalyst for expansion. In 2024, 57% of applications were via online or mobile app channels (per SYF 10K). Meanwhile, 75% of credit card accounts with balances have activated digital servicing.
“Income share” across the platforms mirrors receivables mix: The income share across FY 2024 was led by Digital (29% of FY 2024 interest and fees) and Home & Auto (27%), Diversified & Value (22%), Health and Wellness (17%), and Lifestyle (5%). Examples of major partners in Home & Autos are Lowe’s and PC Richard. For Digital, we see Amazon and Verizon and payment solution providers such as PayPal and Venmo. Diversified value examples are JCPenney and Sam’s Club. Lifestyle ties into a range of partners including Dick’s Sporting Goods, American Eagle, Guitar Center, Kawasaki, Suzuki among others.
Wellness as a growth market: Health & Wellness includes a range of entities from health focused retailers (Walgreens) to health care providers and SYF’s own CareCredit brand. Health care is a natural target for growth given demographics and the basic reality that health care is around 18% of GDP. SYF’s “CareCredit program is a credit card designed to support your health and wellness wants and needs. It’s a way to pay for the out-of-pocket costs at over 285,000 locations nationwide including treatments, procedures and more…”
The Ally business line acquisition broadened the mix: SYF acquired the Ally Financial point-of-sale financing business in a $2.0 billion cash deal. This acquisition and related mix flows into Home & Autos and Wellness. Growth business lines and specialty areas include roofing, HVAC, and windows, as well as in cosmetic, audiology, and dentistry. These were part of the rationale for the deal.
The trends in asset quality have been favorable in credit cards: The moderately favorable trends in asset quality for SYF as of 3Q25 mirror the color from JP Morgan and BofA in their 3Q25 numbers. Cap One as a consumer finance and credit card giant also gave favorable asset quality results. The spend trends, payment rates, and asset quality performance is pushing back against the theme of a consumer in trouble. For SYF, that comes with the asterisk of a heavy base of prime quality borrowers and creditworthy households.
SYF posted lower delinquency rates and lower charge-offs: The 3Q25, YTD and annual numbers are broken out in the chart, and delinquencies and charge-offs are ticking lower. Charge-offs during the reporting period were 5.16% in 3Q25 vs. 6.06% YTD and 6.31% in FY 2024. SYF offers supplemental disclosure with monthly numbers. The late months of 2024 wound down the monthly 30+ day delinquency rates in the high 4% range vs. the low 4% range or each month of 3Q25. Charge-offs in 3Q25 declined sequentially to 5.16% from 5.70% in 2Q25 and from 6.06% YoY from 3Q24. The charge-off rates by month in 3Q25 are in the low 5% range each month after 5.8% in June and a 6.3% in April and 6% handles for each month from Sept 2024 to April 2025. The trend is favorable across the quarters. Asset quality in 2025 is worse than 2021-2022, slightly worse than 2023, but modestly better than 2024.
Credit scoring shows the focus on middle to upper tier consumers: SYF provides useful disclosure on its credit tier mix. SYF uses VantageScore credit data. Per SYF, the scores are set “at origination of the account and are refreshed, at a minimum quarterly, but could be as often as weekly, to assist in predicting customer behavior.” SYF categorizes these credit scores into the following three credit score buckets: (1) 651 or higher (73% of credit cards at 3Q25); (2) 591 to 650, “moderate” credit risk (19% of credit cards); and (3) 590 or less, “weaker” credits (8% at 3Q25).
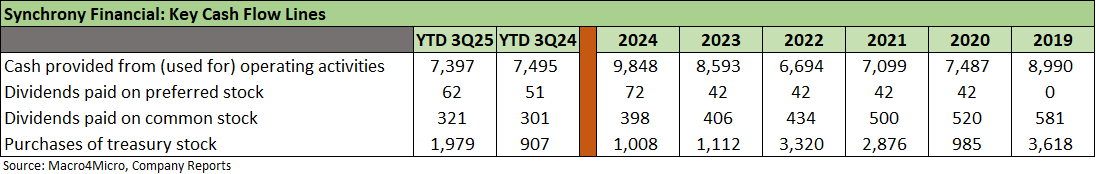
Buybacks dictate the capital allocation story: The cash flow chart above is mostly about tracking the rate of buybacks with the dividend rates tied to a combination of regulatory latitude and the steady decline in share count. The most recent quarter saw $971 million in buybacks in 3Q25 ($1.98 bn YTD). The board approved another $1 bn in buyback authorization for a total authorization of $2.1 bn.
Excess capital comfort and solid profitability support buyback scenarios: The Tier 1 capital ratio at 3Q25 of 14.9% was up modestly from 2024. We look at the SYF capital history in the next chart. The buyback volume is reassuring equity investors while the asset quality and access to capital keeps credit markets happy and offers comfort around funding flexibility and reliability. The decline in dividends in total dollar terms across the cycle is consistent with the dramatic reduction of the share count since the pre-COVID period.
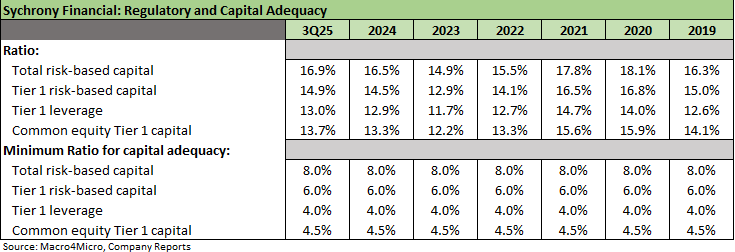
We include the above line items from the 3Q25 10Q and 10K for a convenient look at the actual vs. the minimum capital required. The company has plenty of capital, strong earnings, and a key stock market factor each quarter is the amount and timing of buybacks.
History and Highlights:
Synchrony descends from the legacy consumer credit unit of GE: SYF was formerly GE Capital Retail Finance before its IPO in July 2014 and “split off” from GE In 2015 when GE exchanged its SYF shares for GE stock, leaving SYF as a stand-alone operation and constituent of the S&P 500. The GE unit was the largest provider of private label credit cards in the United States based on purchase volume and receivables. The spin/split off was part of an ongoing break-up of GE into more independent operations. That GE restructuring and business line exits have been ongoing across the decades and accelerated after the credit crisis.
SYF purchased an Ally consumer lending business in 2024: Ally divested the point-of-sale financing business in March 2024 for $2.0 billion in cash. The deal bolstered SYF’s home improvement sector exposure (roofing, HVAC, windows, etc.) and its position in the health and wellness markets. The deal included the acquisition of $2.2 billion in receivables.
SYF divested its Pets Best Insurance in March 2024: The deal was $1.1 bn in pretax gains and $802 million net of tax. The deal came alongside the acquisition of Ally’s consumer business. The realignment of the portfolio reflects the focus on building out the partner network while sustaining a strong capital base and thus buyback potential. SYF heads into 2026 with a strategy focusing on more growth based on what they laid out in the game plan for each platform. Digital and Wellness are key growth opportunities. Major wins such as getting Walmart back in the fold and targeting health care as a growth sector have seen favorable feedback in the equity markets. As detailed earlier, this is all part of the constructive story as reflected in the relative stock performance across numerous trailing periods into 2025.
 |
|