
Mini Market Lookback: All that Glitters…
A rough week for tech stocks as HY spreads moved wider and consumer confidence nears an all-time low.


This past week posted the worst performance for tech since the April Liberation Day sell-off with the major benchmarks all in the red after a battering of key tech names. The 11 S&P 500 sectors showed a favorable balance with 7 positive and 4 negative, but the dominance of the Information Tech sector in the benchmarks at -4.2% carried the day for bears.
The shutdown is breaking the record every day from here with the Democrats pitching a deal with a 1-year extension on ACA subsidies in exchange for a “CR” (continuing resolution). That was immediately rejected. The ACA premiums damage is now highly visible and SNAP benefits continue to pile on the zero-sum game for consumer spending. The fact that the Michigan Consumer Sentiment Index plunged to 50.3, just above the June 2022 record low of 50.0, makes a clear statement.
The election results dominated the headlines for a few days and set off a few more rounds of Trump’s disinformation exercises about “affordability.” Disinformation is easily refuted by a look at the numbers and by citing actual inflation numbers. It seems that simple exercise is beyond the capabilities of mainstream media. They are either cowed by Trump and his FCC henchmen or are as two-dimensional and “light” as they often seem to be.
The consumer feels first-hand some of the inflation. Some samples of YoY CPI line items that are higher in Sept 2025 than Dec 2024 (Biden’s last full month) include: Durable Goods (+1.8% in Sept 25 vs. -1.9% Dec 24), Nondurables (+2.0% in Sept 25 vs. +1.1% in Dec 2024), and Food at Home (+2.7% in Sept 25 vs. +1.8% Dec 24). Goods and Food can clearly be tied to tariffs.
Energy gets a lot of play by Trump, so one CPI line that might surprise includes “Energy Total CPI”, which has risen to +2.8% in Sept 25 from -0.5% in Dec 24. Electricity CPI is at +5.1% in Sept 25 vs. +2.8% in Dec 24. Gasoline is -0.5% in Sept 25 vs. -3.4% in Dec 24. We see Utility piped gas with a CPI of +11.7% in Sept 25 vs. +4.9% in Dec 24. On energy, the role of weaker expected demand vs. OPEC supply pressure is the topic. Trump failing to mention the role of Putin in the 2022 energy CPI spike is old news at this point.
The main win for Trump has been in Services, which has seen a decline to +3.6% in Sept 25 from +4.6% in Dec 2024. At +3.6% CPI, Services of course is not signaling lower prices – just lower inflation. (CPI September 2025: Headline Up, Core Down 10-24-25).
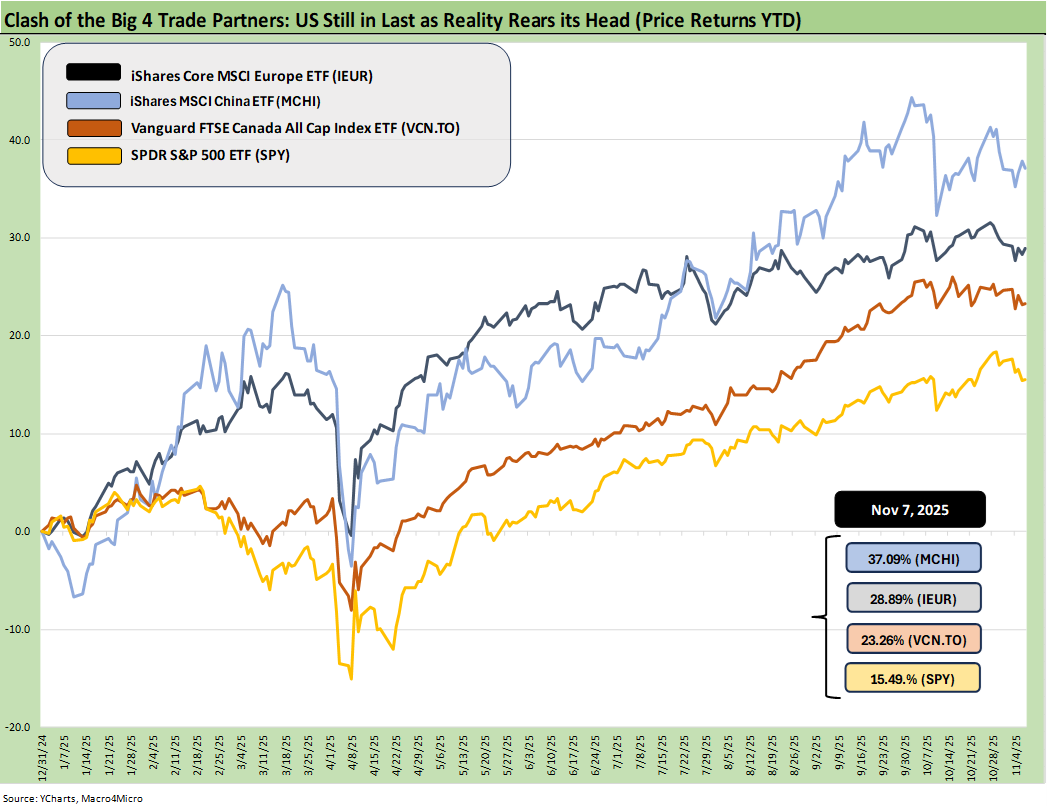
The above chart updates the YTD returns for some bellwether index ETFs for the Big 4 developed market trading partners – the US, Europe, China, and Canada. The aim of the chart is to plot some ETFs that tell a market story for US investors thinking about global diversification. These ETFs are just a useful sample that uses relevant broad market indexes for each region as snapshots.
The goal of this chart is to capture the balance of risks across the broad mix of macro trends (economy, currency) and the sea level industry and company fundamentals rolled up into a US traded ETF. Once again, the US placed dead last YTD with the heavy influence of the dollar plunge in 2025. The dollar has been on the mend the last few weeks after the worst YTD stretch since the 1970s. We look at the 30Y UST vs. the dollar index in our UST Curve weekly that we will publish later.
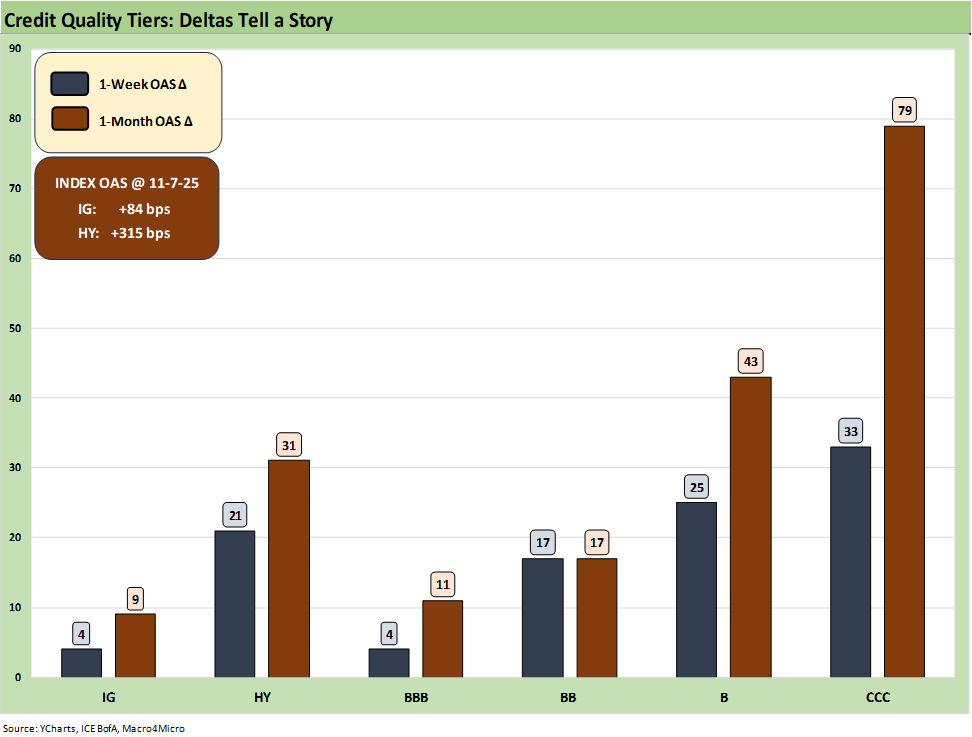
The above chart frames the 1-week and 1-month spread deltas for IG and HY spreads and for the BBB tier and down. At +84 bps, IG is in the area or just above some historical credit cycle tights while HY OAS at +315 bps has again pushed above the higher end of the June 2007 credit bubble month and is more in line with the Oct 2018 cyclical lows. The CCC tier has seen some constituent migration and new names in the CCC index with the post-exchange and post-restructured issuers dropping in at higher spreads.
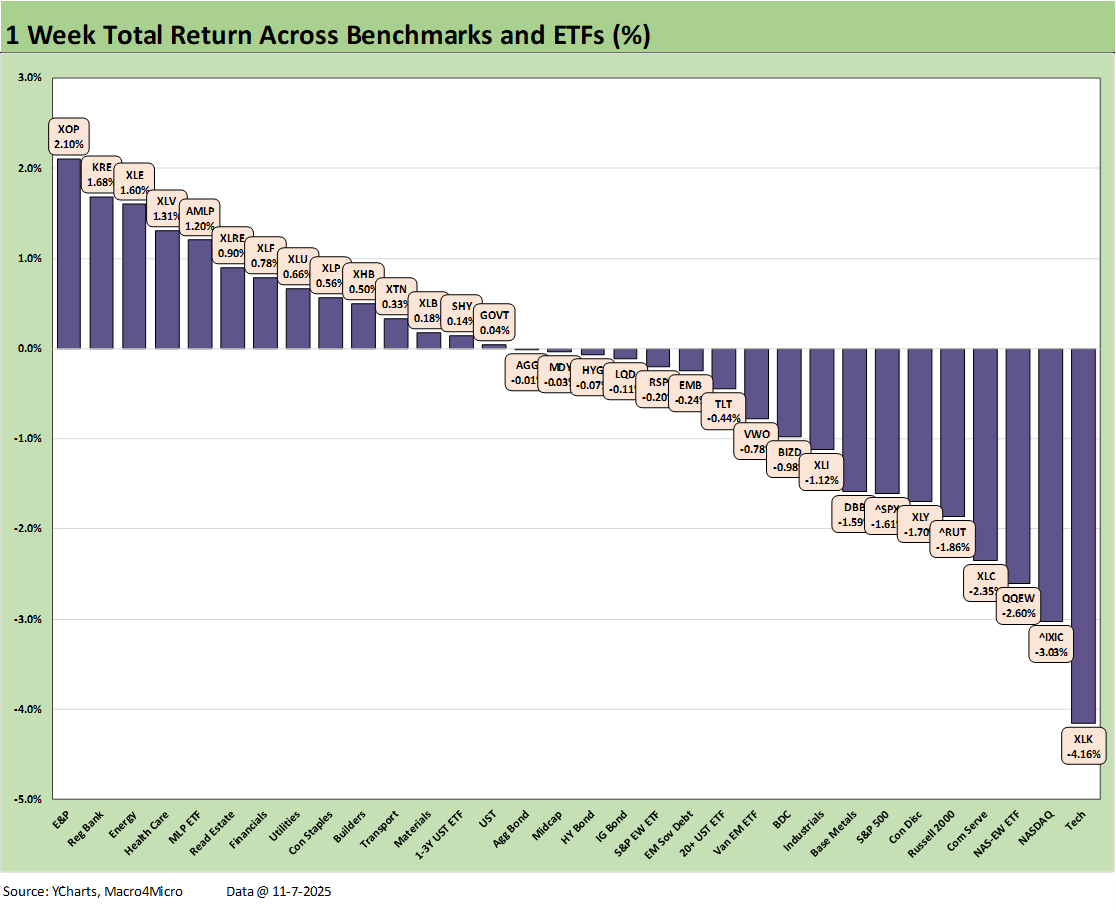
The above chart updates the 1-week returns for our group of 32 benchmarks and ETFs. We see a score of 14 positive and 18 negative returns. The Tech ETF (XLK) is dead last with the NASDAQ, S&P 500, and small cap Russell 2000 all in the bottom quartile in negative return range. NASDAQ was second-to-last, and the Equal Weight NASDAQ 100 ETF (QQEW) was third to last. Communications Services (XLC) was also in the bottom 5.
The top performers include energy-related ETFs in the top 5 with E&P (XOP) at #1, Energy (XLE) at #3, and Midstream Energy (AMLP) at #5. Peak heating season approaches and sanction noise could help in the area of Russian supply-demand. Interestingly, E&P had very little good news this week with WTI ending the week under $60. The 7 bond ETFs saw 5 of 7 negative with the UST curve shift lower from 6M to 7Y as discussed below.
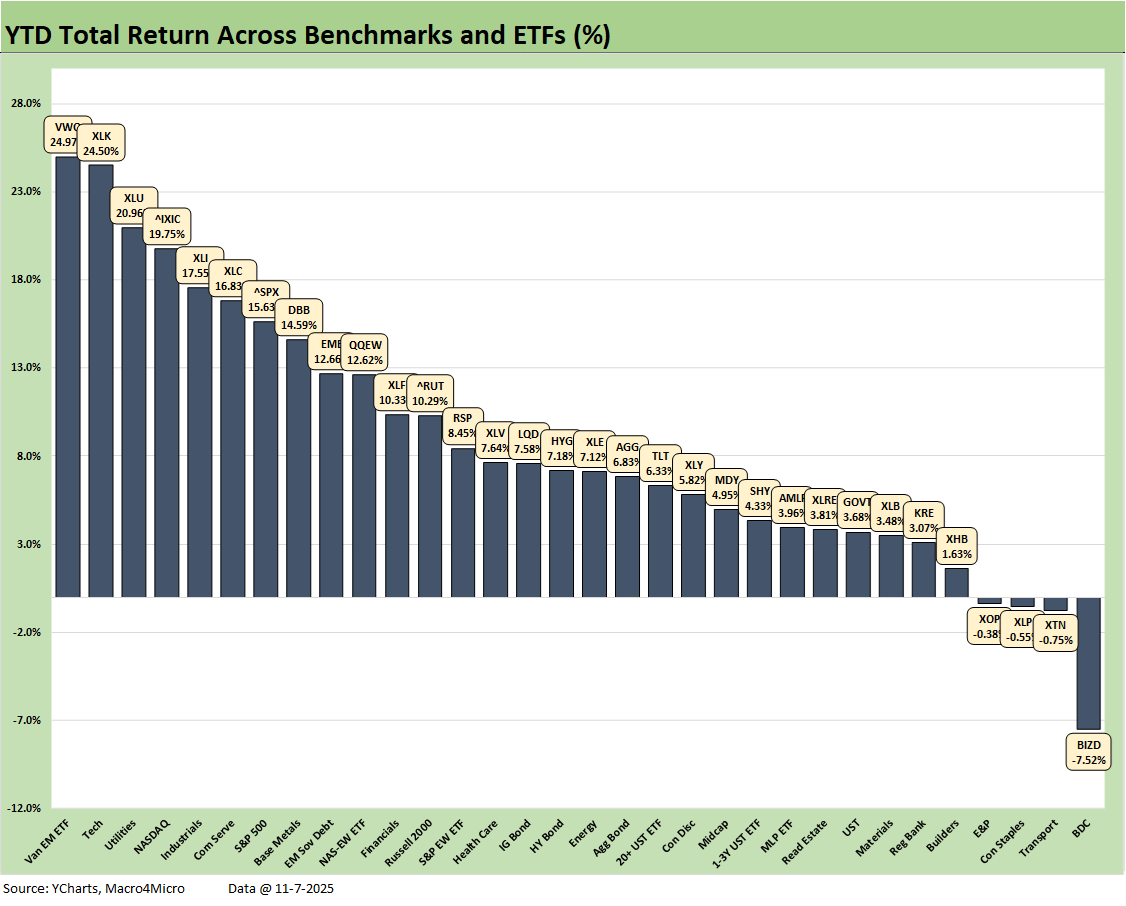
The above YTD return scoresheet is 28-4 with no surprises around the 4 ETFs in the red. We see BDCs (BIZD) lagging in recent periods with Transports (XTN) still facing the challenges of tariffs and rattled freight and logistic services. The defensive and dividend-biased Consumer Staples ETF (XLP) is heavily influenced by the UST curve while E&P (XOP) has felt the weight of oil prices
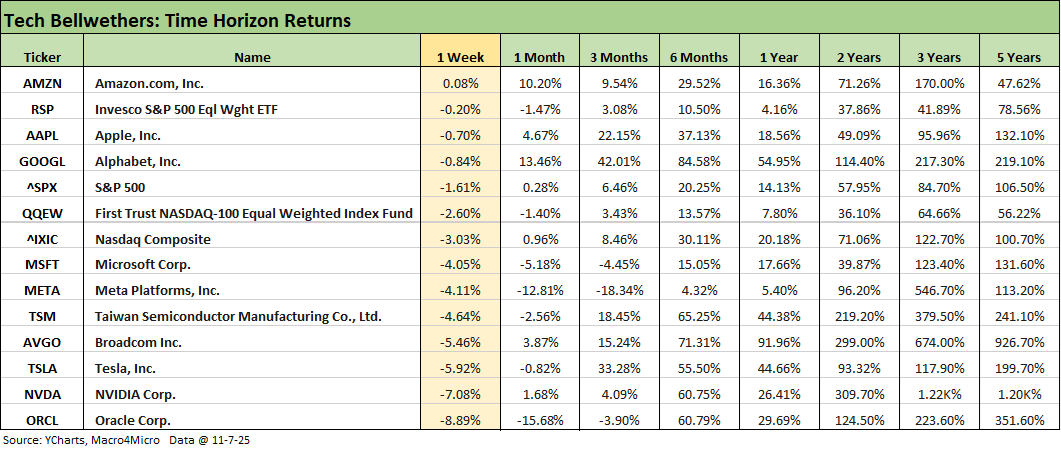
The above chart updates the 1-week returns for the tech bellwethers and benchmarks as only Amazon made it into positive range (barely). We see NVIDIA at -7.1% on the week, and we assume Jensen Huang saying that China will “win the AI race” did not help (he walked it back later).
Away from the very lofty valuations, the AI valuation second-guessing has picked up as the balance sheet intensity of the AI ecosystem is getting more attention with more debt getting layered into the space (on balance sheet or off balance sheet in joint ventures).
Revenue models, the timing and scale of growth, and the late 1990s exercise of assigning valuations from forward revenue models can get investors nervous with massive gains in the sector and plenty of uncertainty on timing. The mega-players are nothing like the debt-heavy, EBITDA-lite, cash bleeders of the late 1990s, but the question of debt demands to fund capex does raise some issues around what the valuation framework will look like in coming years.
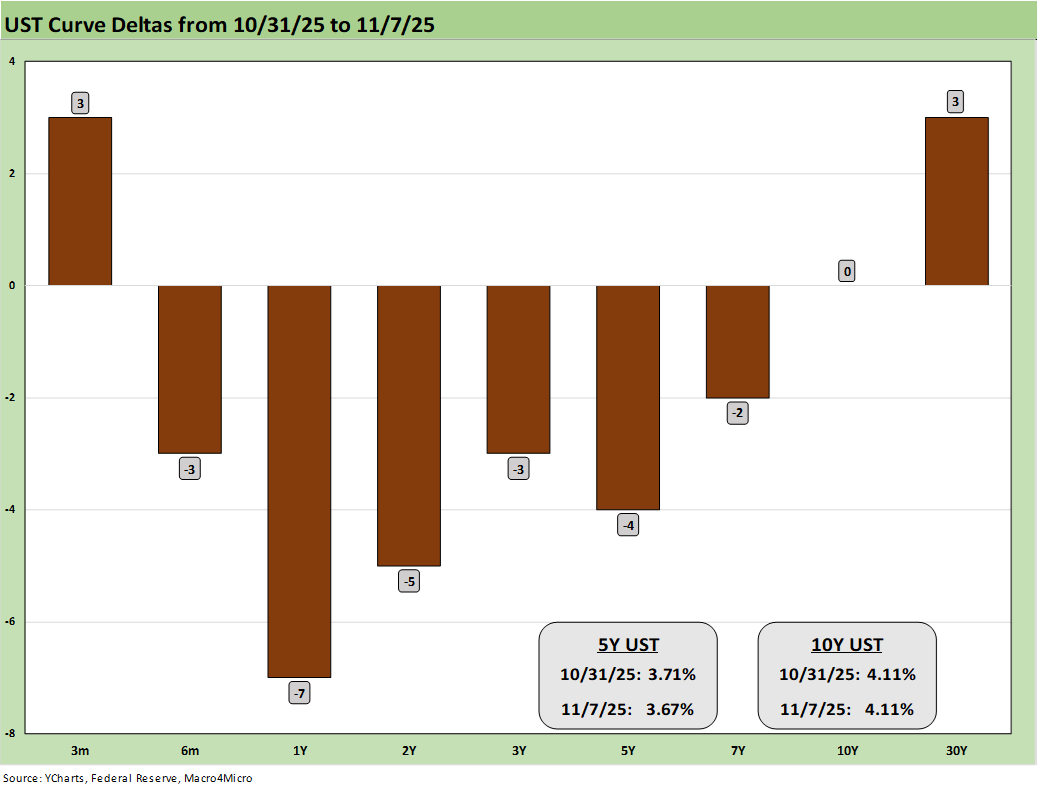
The above chart updates the weekly UST deltas with the 3M and 30Y higher but 1Y to 7Y lower and the 10Y flat. As noted earlier, that sent 5 of the 7 bond ETFs into the red for the week.
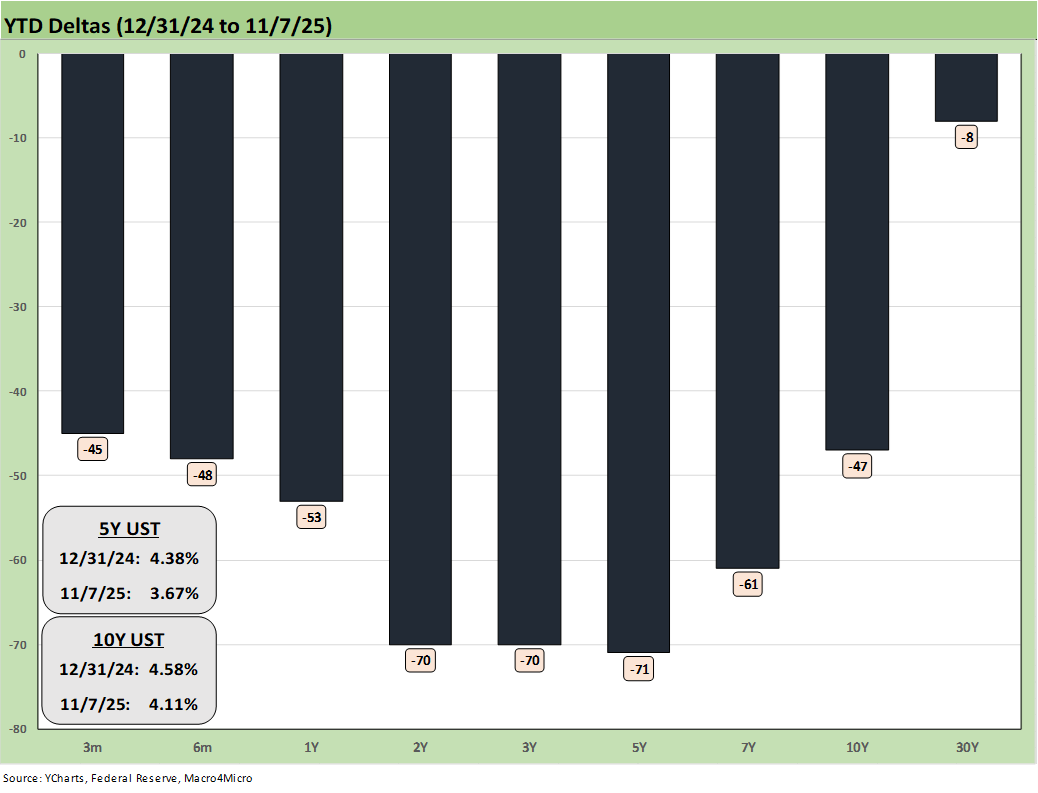
The above chart updates the bull steepener of the UST curve YTD that has rewarded duration and helped the 7 bond ETFs in our group of 32 benchmarks and ETFs post up positive total returns. As noted earlier, EM Sovereigns (EMB) were at the top of the bond ETF peers and took the top slot in the second quartile. The worst performer was GOVT ETF at the top of the bottom quartile.
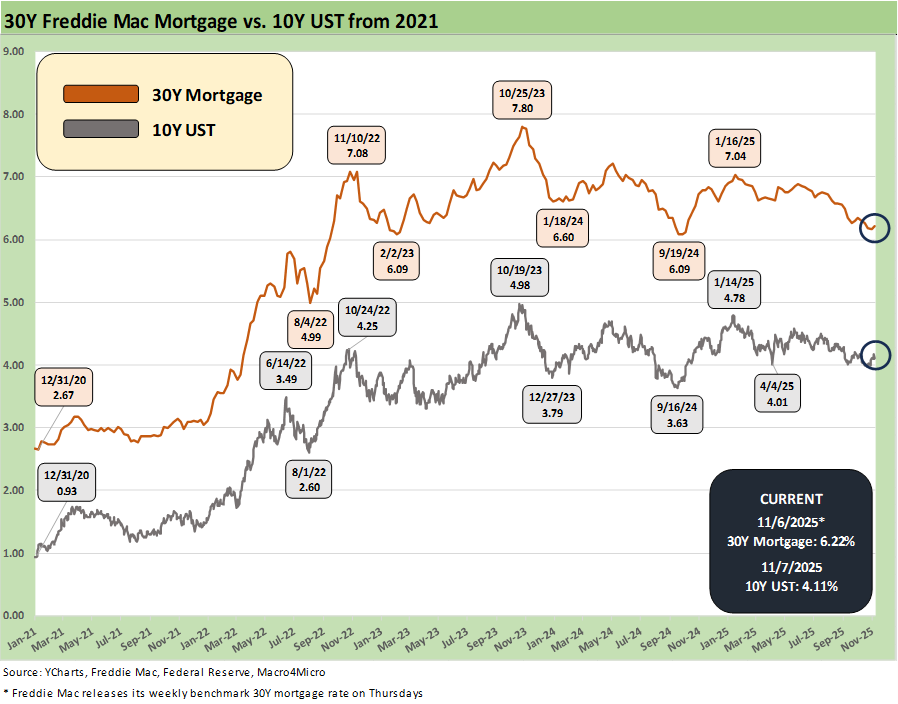
The above chart updates the running Freddie Mac 30Y Mortgage benchmark. The Freddie Mac 30Y edged higher on the week while 10Y UST was flat.
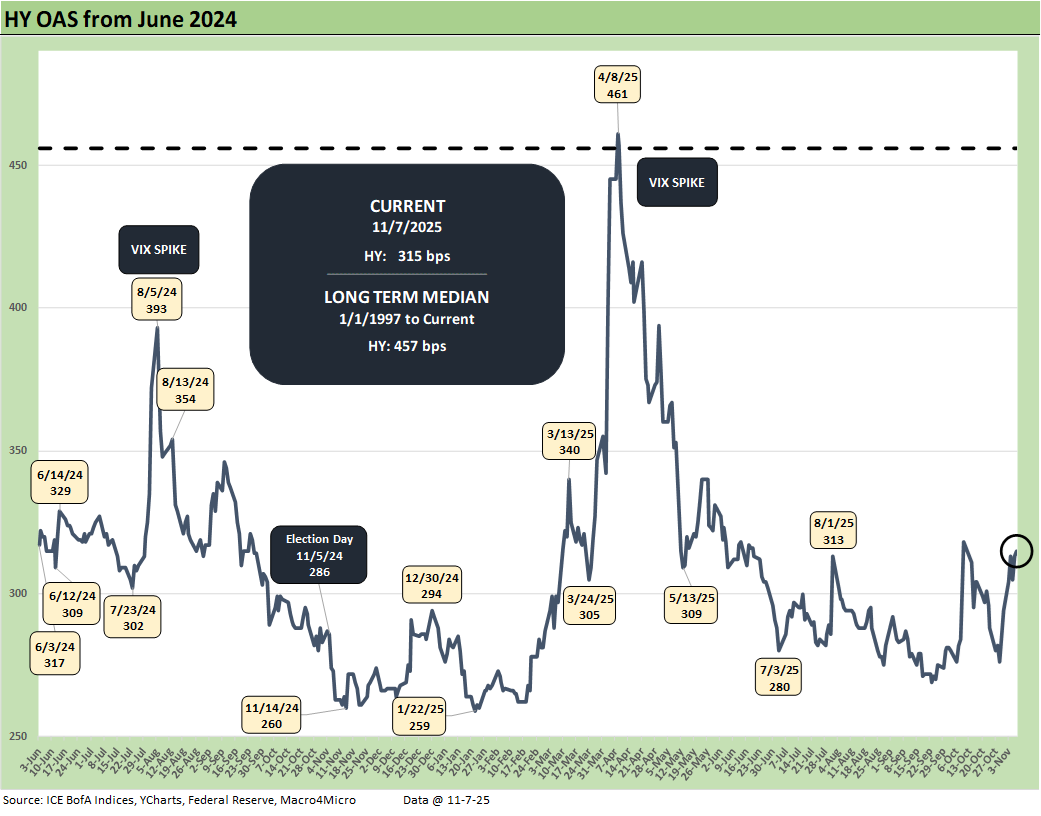
The above chart updates the HY OAS time series with HY OAS +21 bps wider on the week to +315 bps. That +315 bps is in line with the Oct 2018 lows (+316 bps), inside the June 2014 lows (+335 bps) and wide to the Dec 2021 tights (+301 bps).
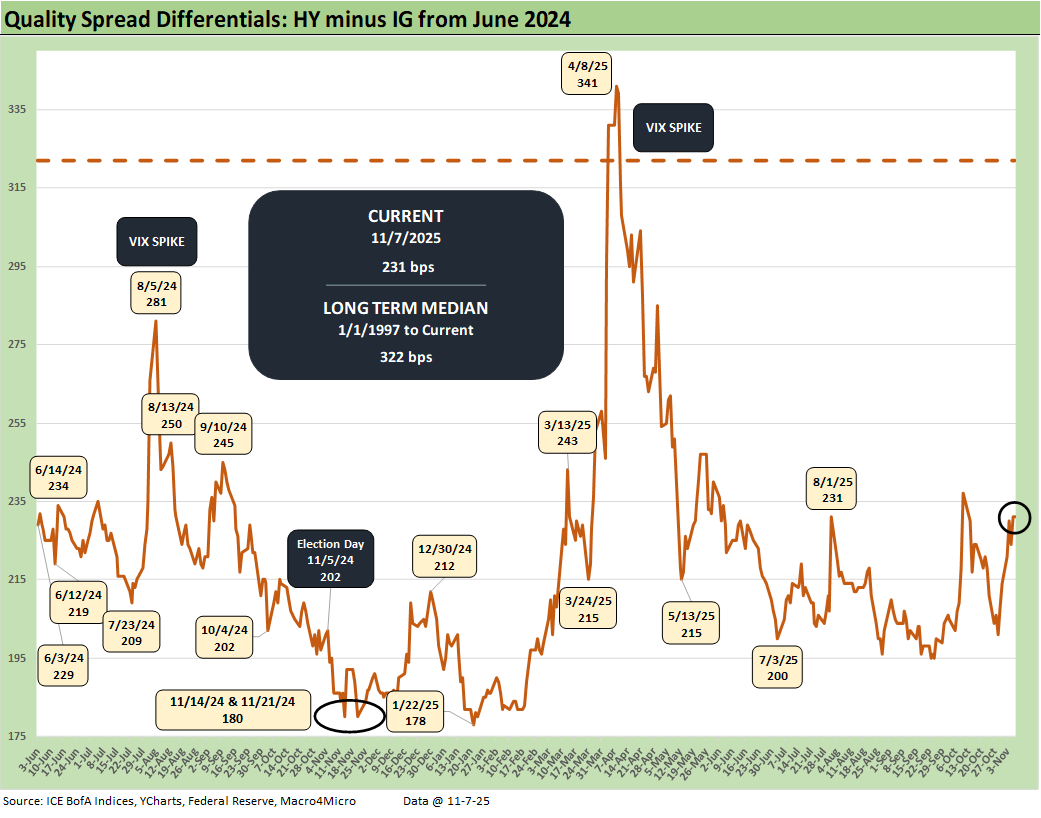
The above chart updates the “HY OAS minus IG OAS” quality spread differentials. This metric widened by +17 bps with HY +21 bps wider and IG +4 bps wider.
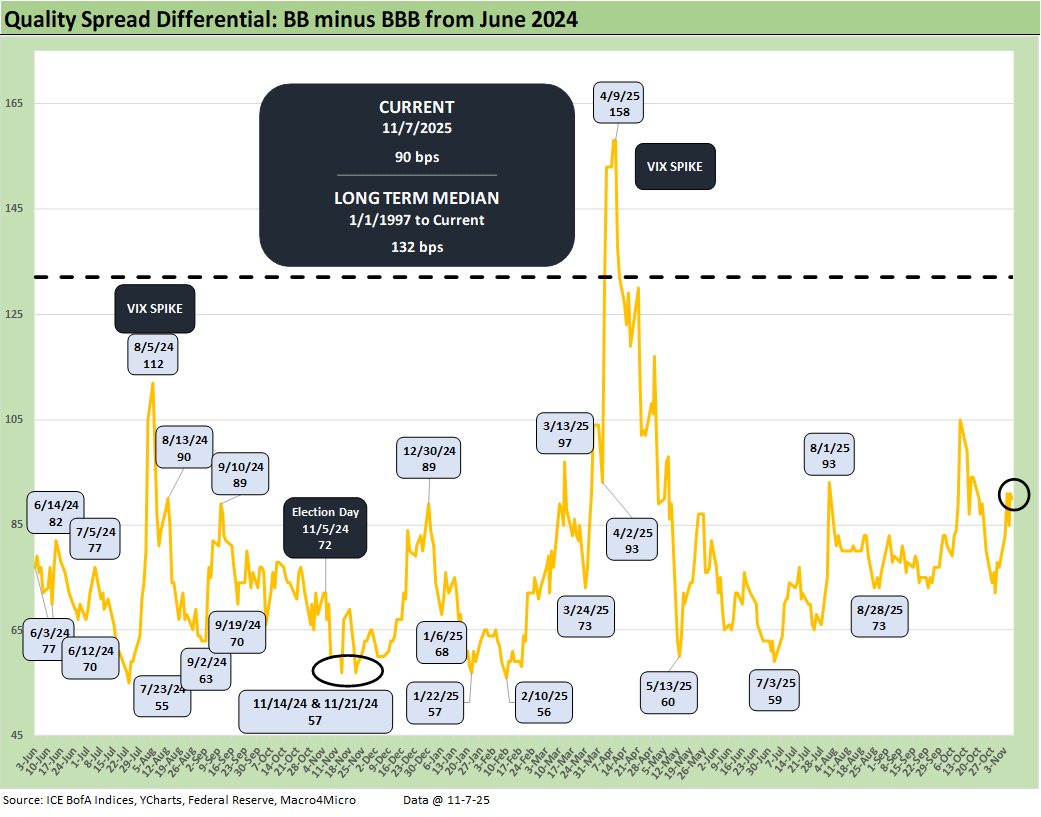
The above chart updates the BB OAS minus BBB OAS quality spread differential as it widened by +13 bps this past week to +90 bps. The BB tier widened by +17 bps with BBBs wider by +4 bps for the +13 quality spread decompression.
See also:
Credit Markets: Little Shop of Worries 11-3-25
The Curve: Macro Data MIA? Policy Prudence KIA? 11-3-25
Market Commentary: Asset Returns 11-2-25
Mini Market Lookback: Not Quite Magnificent Week 11-1-25
Synchrony: Credit Card Bellwether 10-30-25
Credit Markets: Call Me After Trouble Arrives 10-27-25
The Curve: A Slow Pour of Tariffs 10-27-25
Market Commentary: Asset Returns 10-26-25
Existing Home Sales Sept 2025: Staying in a Tight Range 10-26-25
Mini Market Lookback: Absence of Bad News Reigns 10-25-25
CPI September 2025: Headline Up, Core Down 10-24-25
General Motors Update: Same Ride, Smooth Enough 10-23-25
Credit Markets: The Conan the Barbarian Rule 10-20-25
Mini Market Lookback: Healthy Banks, Mixed Economy, Poor Governance 10-18-25
Mini Market Lookback: Event Risk Revisited 10-11-25
Credit Profile: General Motors and GM Financial 10-9-25
Mini Market Lookback: Chess? Checkers? Set the game table on fire? 10-4-25
JOLTS Aug 2025: Tough math when “total unemployed > job openings” 9-30-25
Mini Market Lookback: Market Compartmentalization, Political Chaos 9-27-25
PCE August 2025: Very Slow Fuse 9-26-25
Durable Goods Aug 2025: Core Demand Stays Steady 9-25-25
2Q25 GDP Final Estimate: Big Upward Revision 9-25-25
New Homes Sales Aug 2025: Surprise Bounce, Revisions Ahead? 9-25-25
Mini Market Lookback: Easy Street 9-20-25
Home Starts August 2025: Bad News for Starts 9-17-25
Industrial Production Aug 2025: Capacity Utilization 9-16-25
Retail Sales Aug 2025: Resilience with Fraying Edges 9-16-25
Mini Market Lookback: Ugly Week in America, Mild in Markets 9-13-25
CPI August 2025: Slow Burn or Fleeting Adjustment? 9-11-25
PPI Aug 2025: For my next trick… 9-10-25
Mini Market Lookback: Job Trends Worst Since COVID 9-6-25
Couldn't agree more; your analytical framewrok connecting economic data to public sentiment is always so insightful. Do you see any short-term policy levers that could effectively mitigate the current consumer distress?