
New Homes Sales Aug 2025: Surprise Bounce, Revisions Ahead?
Strong new home sales pushed past mortgage rates and market unease as more builders report weak results.


Need more homes, lower rates, and more optimism.
Very favorable variances for August new home sales came during a month when mortgage rates were struggling and news from the industry was downbeat with respect to demand and pricing. We get Existing Home Sales tomorrow while weak starts were already posted last week (see (Home Starts August 2025: Bad News for Starts 9-17-25)
Mortgage rates will remain a critical swing factor in the weeks to come as inflation anxiety is flirting with stagflation worries. The fear of a bear steepening remains given the recent history after the Sept/4Q24 UST migration as the expected bull flattener in 2024 did not turn out as planned and a fresh bearish move unfolded after the temporary rally during the fall easing actions.
The 2025 bull steepener has supported bond returns, but the mortgage rate relief has not been enough to consistently bolster transaction volume in single family. The August numbers were surprisingly strong and left some in the market scratching their heads.
The crosscurrents of challenging monthly payment math, anxiety around the consumer cycle, and a shortage of housing overall remains a headwind, and the high potential for more labor shortages ahead and lumber tariffs and supplier chain noise will add some gusts on the expense side
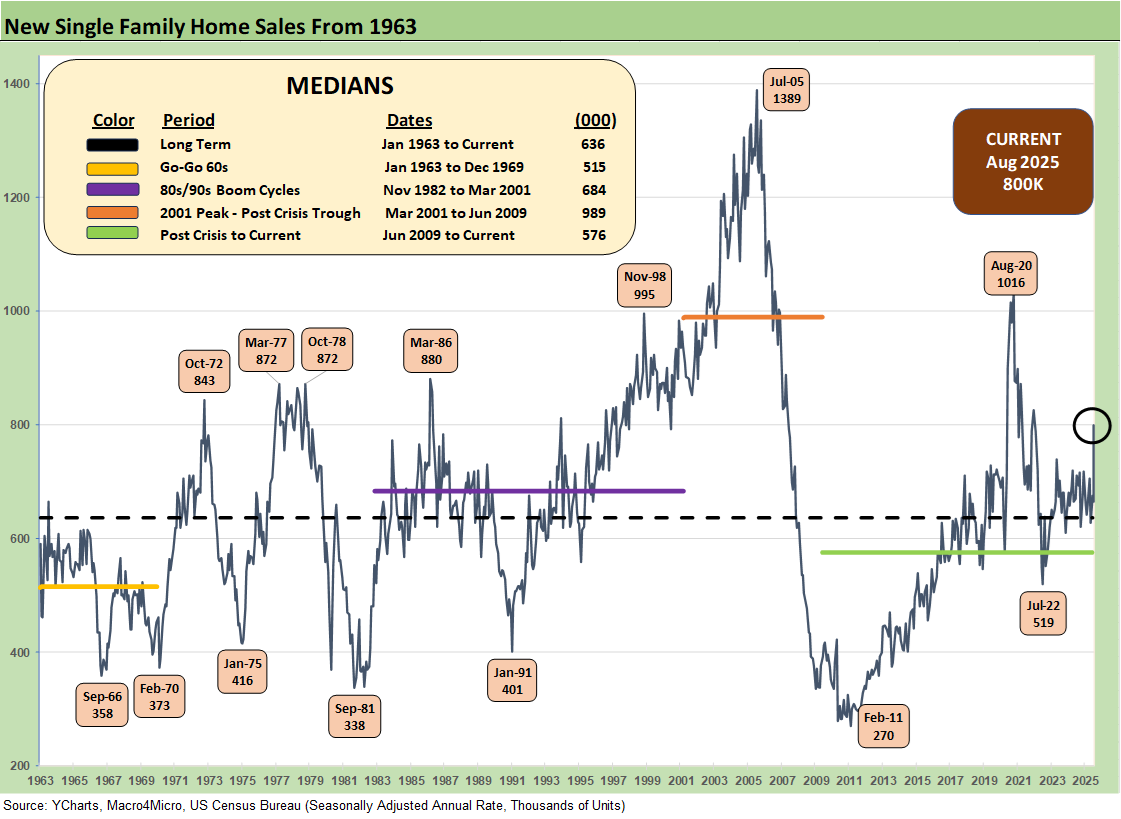
The above chart updates the new single family sales time series from 1963, and the current 800K posts a banner +20.5% sequential increase from the revised July tally of +664K. We saw all 4 regions higher with 3 of 4 posting double-digit sequential gains. The largest region is the South at 66% of total, and the South rose by +24.7% MoM and +21.0% YoY. We see 3 of 4 regions higher YoY with only the #2 region in the West lower. We look at regional trends further below.

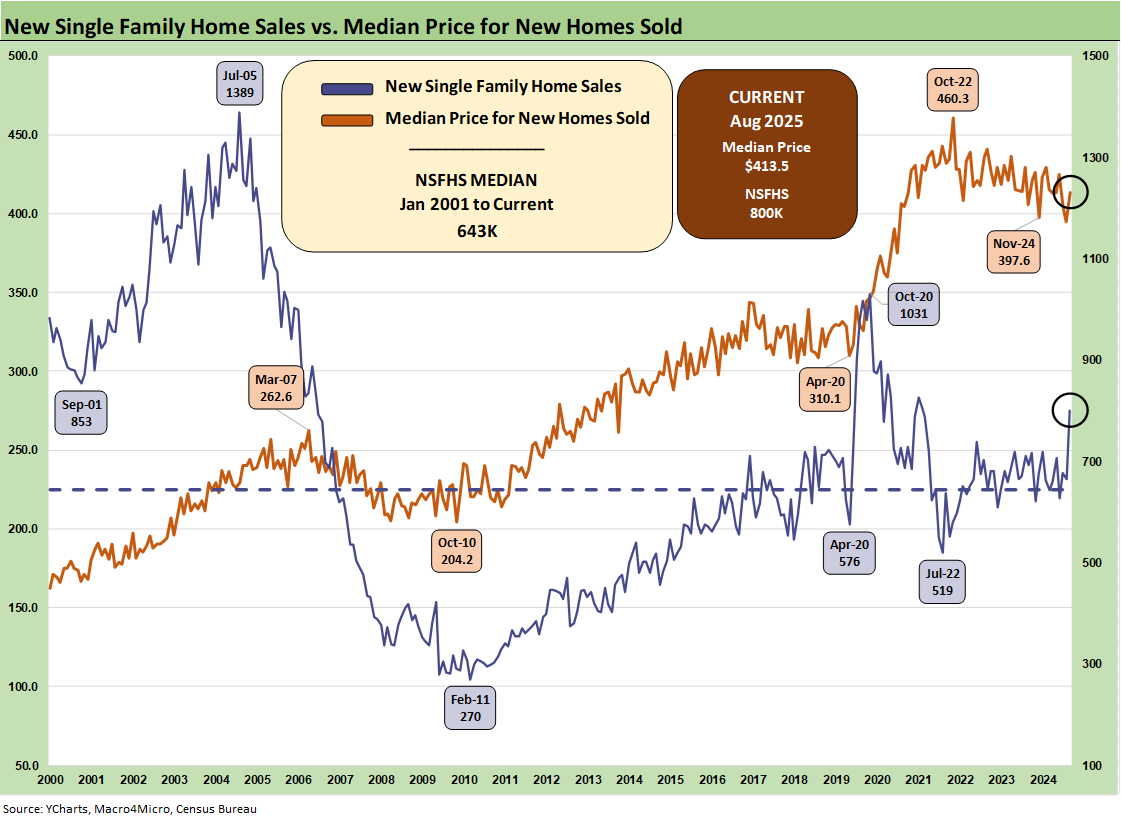
The above two-sided chart shows the sales pattern for the new home sales line since 2000 vs. the median prices, which weighed in at $413.5K for August, up from $395.1K in July (as revised). The fact that prices had trended materially higher across the post-COVID cycle is old news, but the sensitivity of monthly payments is married more to mortgage rates as a critical variable in monthly payments.
Mortgages were stubbornly high in early August before some impressive moves lower in early Sept to around 6.1% before backing up to around just under 6.4% at today’s close in the Mortgage News Daily survey. Mortgage rates remain the primary driver of weaker volumes in the lower price tiers in both new and existing home sales. We get existing home sales tomorrow.
For the largest share of the housing market in the mid-price tiers, the combination of lower prices and in some cases sustained incentives is part of a pattern of gross margin erosion for the builders into 2025. Lennar’s 3Q25 report last week posted up weak margins, so the industry remains in a rough patch waiting for more flavor from the easing cycle and a cleaner read on steepening risk.
Each builder has distinctive geographic mix shifts to consider when framing ASP trends. We look at a number of those trends in our single name coverage (see links at the bottom). The current $413.5K is below the calendar 2024 median of $420.3K and 2023 median of $428.6K.
While prices always come with a very big asterisk of regional mix and product tier shifts, the mixed challenges of cost creep and the sustained need to discount prices or offer incentives complicate the calculus. That means margin squeeze. We saw numerous major builders in 2Q25 reporting season post declining orders and lower unit backlogs in earnings reports. Orders rose for Lennar YoY in their 3Q25 report while YoY backlog was flattish. For LEN, dollar value backlog declined YoY as did interim average sales prices.
The “pace vs. price” topic has been hot again, but there will be a fresh round of action if mortgage rates move sharply in coming weeks. We see highs in “completed home inventory” again in this latest sales report, so the builders could use some more demand right now. Total inventory for sale is slightly lower sequentially.
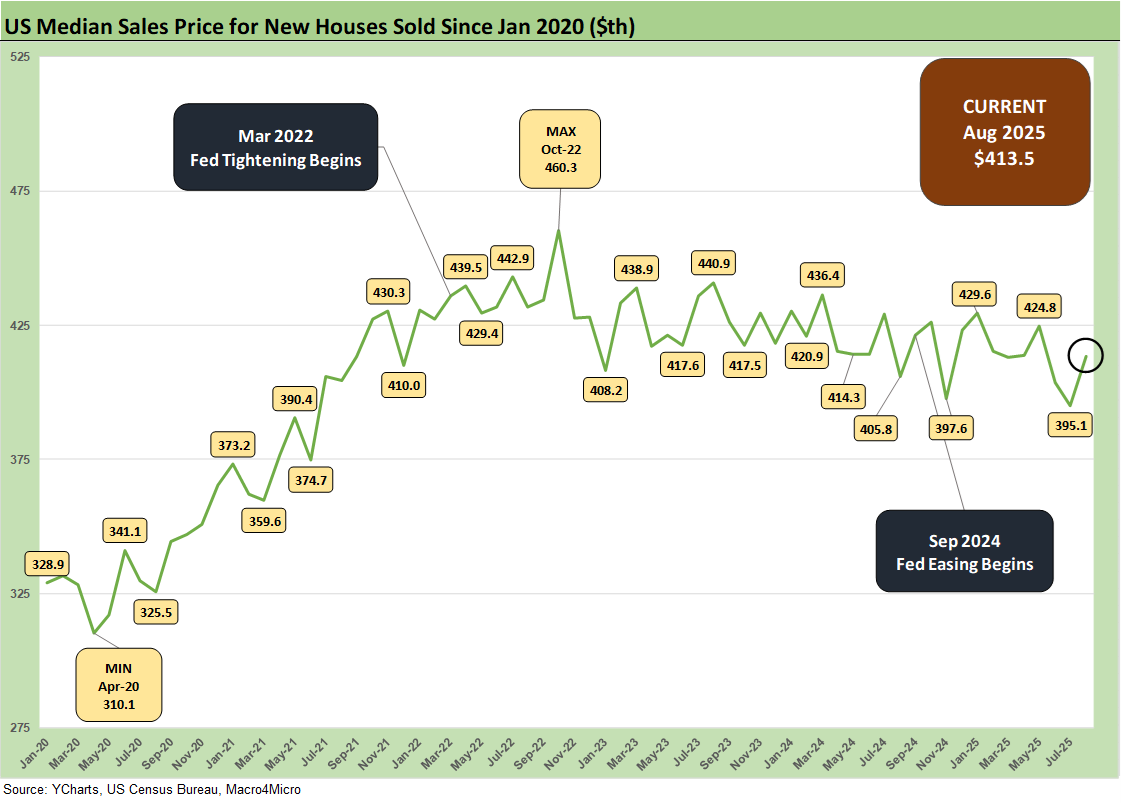
The above chart updates the running median price trends. Builder fears of higher materials and supplier chain costs are not going to do much to relieve homebuilders in their pricing strategies with gross margins softening in 2025. We had two more major builders report this week and last (Lennar and KB Home), and margins were down again. That said, most builders are posting margins still above pre-COVID levels even if down sharply from abnormal margin peaks in 2022.
The word “normalization” shows up more lately in prices and margins, but there are also ample cyclical reasons for prices to react to weaker demand. The builders need to frame how they can get into a gross margin zone that works. The NAHB has put out some numbers for the average home cost from recent tariffs (over $9K per average home).
Beyond lumber, materials costs from Mexico for other building-related supplies such as gypsum will see pressure. The NAHB published an updated commentary on tariffs (see NAHB: How Tariffs Impact the Home Building Industry March 2025, NAHB Members Cite Impact of Tariff Uncertainty on Home Building 5-22-25). That news was not good. We got more color in updates from the NAHB recently (see Framing Lumber Prices 8-25-25, Metals and Equipment Drove Material Prices Higher in June 7-18-25 , Trump Extends Tariff Deadline to Aug. 1, Adds 50% Tariff to Copper 7-9-25).
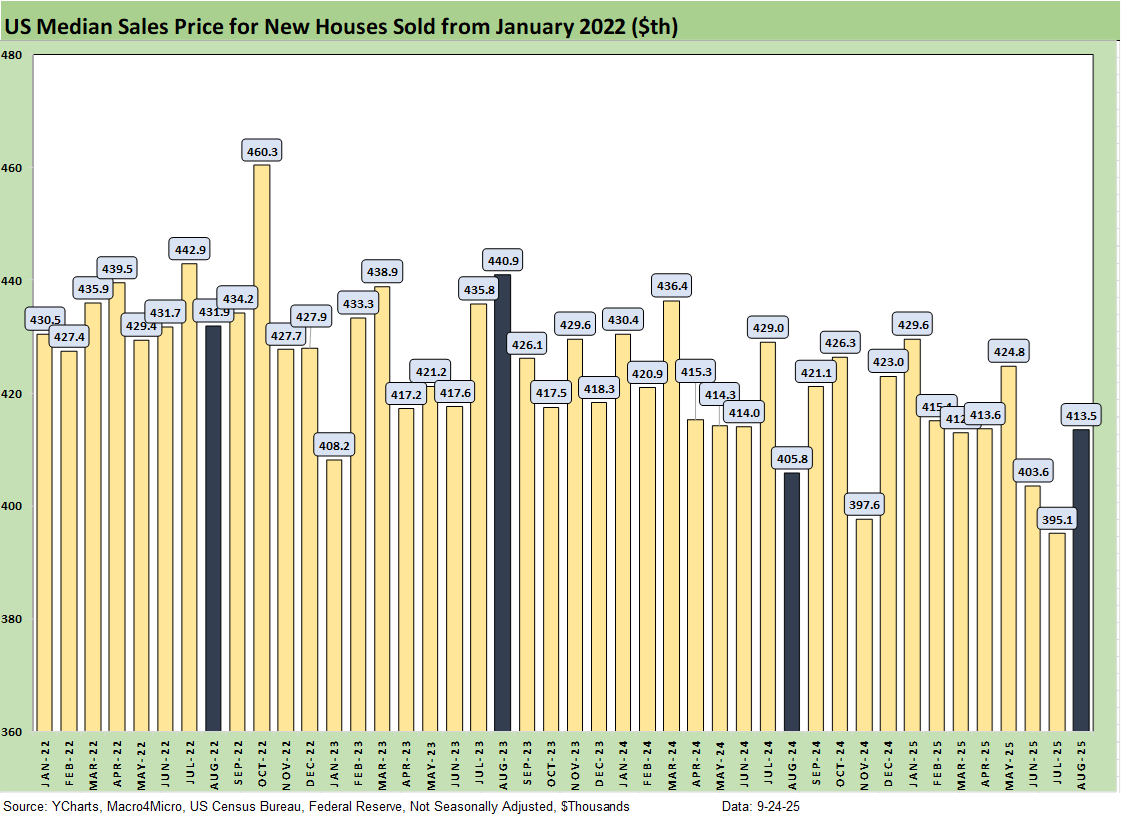
The above chart gives a different visual angle on the median home prices from early 2022. That is a lot of $400K handles with two sub-$400K outliers in Nov 2024 and July 2025. The current $413.5K is a sequential rise after July posted the lowest in the timeline (as revised).
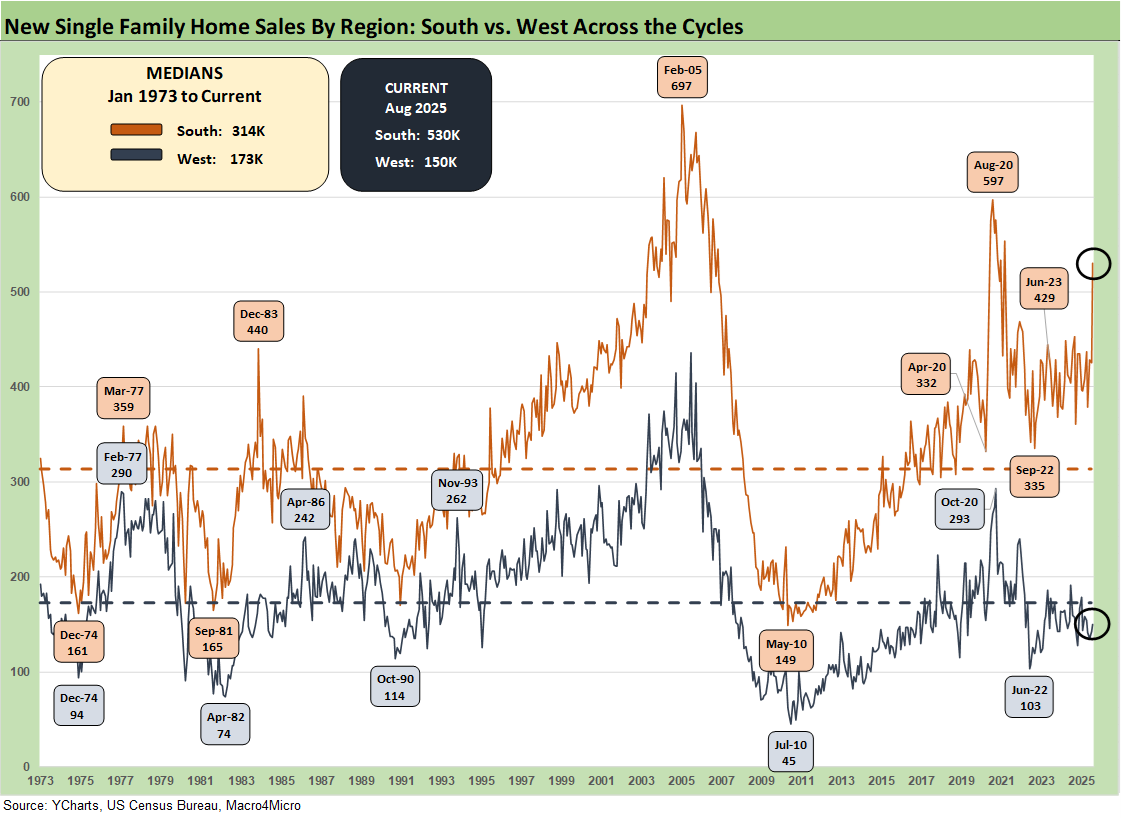
The time series above updates the new single family home sales across the cycles since 1973 for the #1 and #2 regions of the South and the West. The 530K for the South is over 66% of the total of all single family new home sales (SAAR). The South posted a sequential increase +24.7% from July and was +21% YoY. The West at 150K was 19% of the total. For the month, the West was +5.6% sequentially and -5.7% YoY.
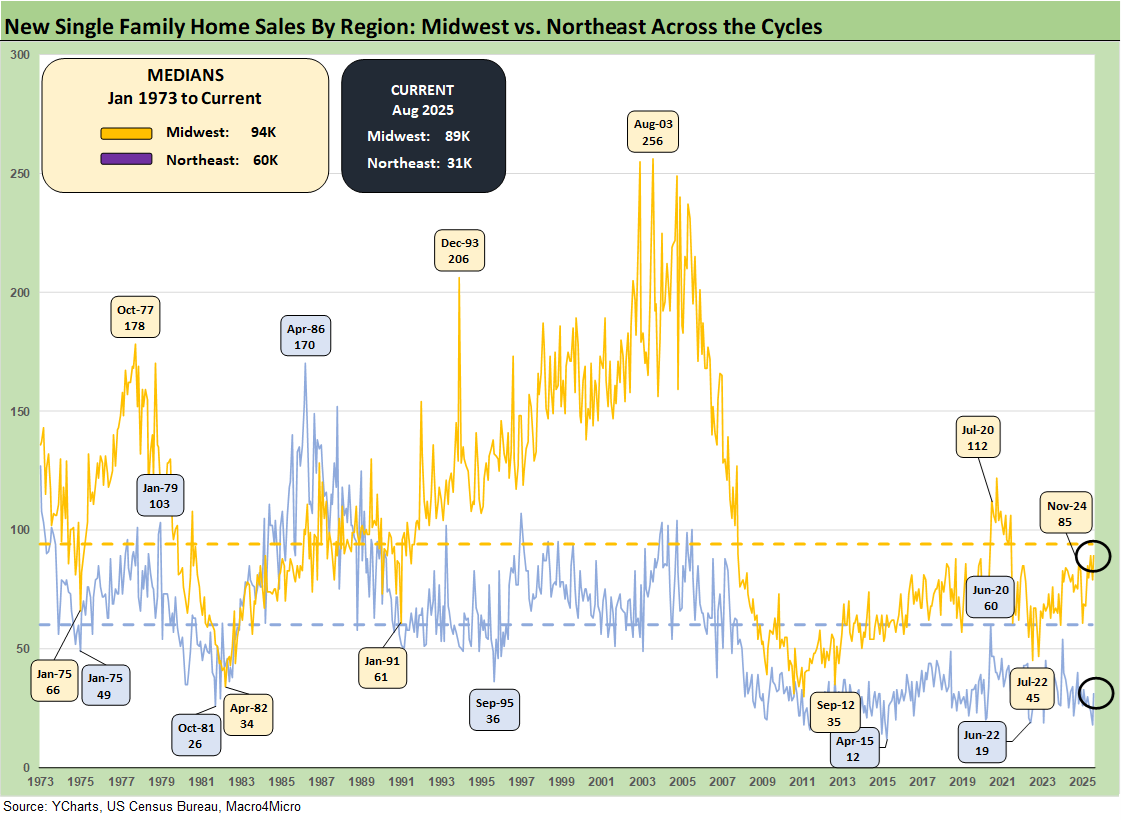
The timeline for new home sales for the smaller Midwest and much smaller Northeast market is detailed above. The Midwest (11% of total) was +12.7% sequentially and +20.3% YoY. The small Northeast market (4% of total) was +72.2% sequentially and +40.9% YoY.
Housing sector:
Home Starts August 2025: Bad News for Starts 9-17-25
New Home Sales July 2025: Next Leg of the Fed Relay? 8-25-25
Existing Home Sales July 2025: Rays of Hope Brighter on Rates? 8-21-25
Homebuilders:
Toll Brothers Update: The Million Dollar Club Rolls On 8-26-25
Taylor Morrison 2Q25: Resilient but Feeling the Same Macro Pressure 7-25-25
PulteGroup 2Q25: Still-Lofty Margins see a Mild Fade 7-23-25
D.R. Horton 3Q25: Material Slowdown Still Good Enough 7-22-25
KB Home 2Q25: Negative Industry Trends Keep Coming 6-25-25
Lennar 2Q25: Bellwether Blues 6-20-25
Credit Snapshot: Meritage Homes (MTH) 5-30-25
Homebuilder Rankings: Volumes, Market Caps, ASPs 5-28-25
Credit Snapshot: PulteGroup (PHM) 5-7-25
Credit Snapshot: D.R. Horton (DHI) 4-28-25
Credit Snapshot: Lennar (LEN) 4-15-25
Credit Snapshot: Taylor Morrison Home Corp (TMHC) 4-2-25
KB Home 1Q25: The Consumer Theme Piles On 3-25-25
Lennar: Cash Flow and Balance Sheet > Gross Margins 3-24-25
Toll Brothers 1Q25: Performing with a Net 2-20-25
Credit Crib Note: Lennar Corp (LEN) 1-30-25
D.R. Horton: #1 Homebuilder as a Sector Proxy 1-28-25
KB Home 4Q24: Strong Finish Despite Mortgage Rates 1-14-25
See also:
Credit Markets: IG Spreads Back in the Clinton Zone 9-22-25
The Curve: FOMC Takes the Slow Road 9-21-25
Market Commentary: Asset Returns 9-21-25
Mini Market Lookback: Easy Street 9-20-25
FOMC: Curve Scenarios Take Wing, Steepen for Now 9-17-25
Industrial Production Aug 2025: Capacity Utilization 9-16-25
Retail Sales Aug 2025: Resilience with Fraying Edges 9-16-25
Credit Markets: Quality Spread Compression Continues 9-14-25
The Curve: FOMC Balancing Act 9-14-25
Footnotes & Flashbacks: Asset Returns 9-14-25
Mini Market Lookback: Ugly Week in America, Mild in Markets 9-13-25
CPI August 2025: Slow Burn or Fleeting Adjustment? 9-11-25
PPI Aug 2025: For my next trick… 9-10-25
Mini Market Lookback: Job Trends Worst Since COVID 9-6-25
Payrolls Aug 2025: Into the Weeds 9-5-25
Employment August 2025: Payroll Flight 9-5-25
JOLTS July 2025: Job Market Softening, Not Retrenching 9-3-25
Hertz Update: Viable Balance Sheet a Long Way Off 9-3-25
Mini Market Lookback: Tariffs Back on Front Burner 8-30-25