
Mini Market Lookback: Healthy Banks, Mixed Economy, Poor Governance
A solid rally off last week’s chaos was joined by lower HY spreads and a modest UST curve rally.


It’s all in the branding on “No Kings.”
The market staged a nice comeback with a low bar to clear after the prior Friday beatdown. The broad market benchmarks were all positive, the S&P 500 had 10 sectors positive and one flat (Financials), and the group of 32 benchmarks and ETFs we track weighed in at 30 positive and 2 negative.
The political ugliness for the current week was wrapped around the “sticks and stones” of the “No Kings” protests (today) dubbed by the right as “I hate America Day” while the left retorts that Mike Johnson is most worried about a “No Pedophile Day” vote in the House. Johnson has still not sworn in the new House Democrat from Arizona since she will be the swing vote on the Epstein document demands. The relevance to the market is that a resolution of the shutdown faces the barriers of the “Fear and Loathing” culture of Washington. Ill will dominates the dysfunction (it must be a day ending in “y”).
The China trade noise eased as Trump backpedals while he mixes up tough talk with a reassuring Mr. Rogers tone to Xi. The market immediately embraced the idea of more pauses and more extensions while the major trade partners still lack binding, detailed trade agreements and the USMCA review is just over the horizon in 2026 (see Mini Market Lookback: Event Risk Revisited 10-11-25).
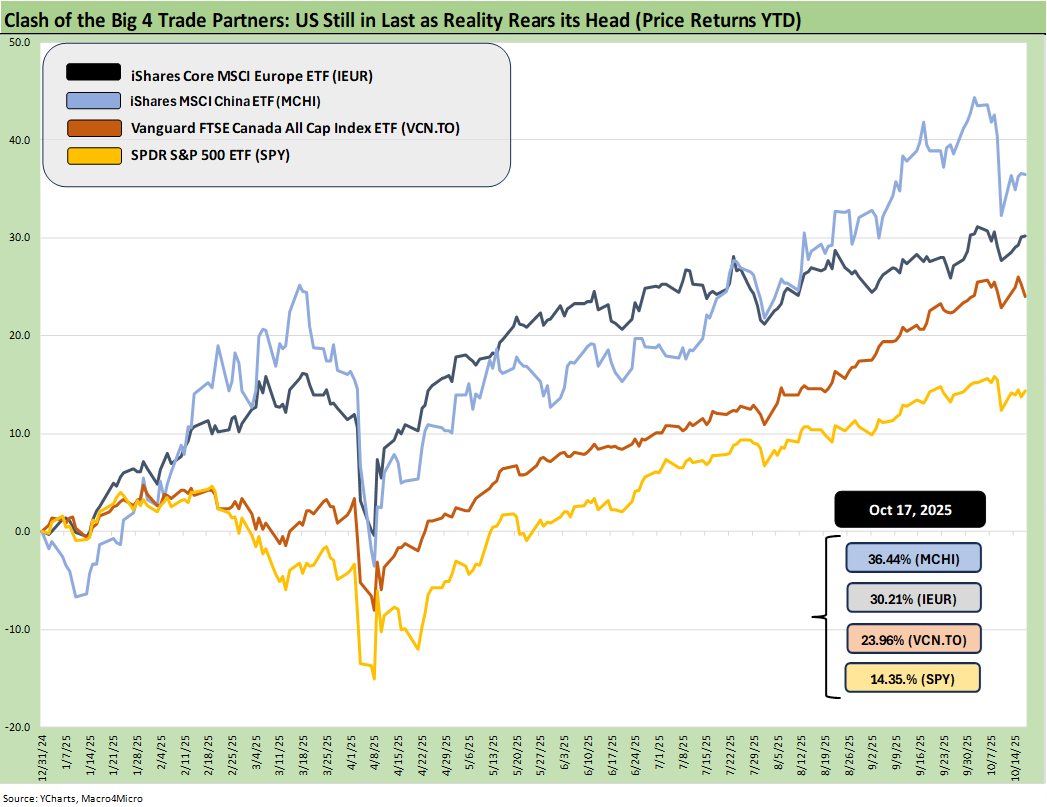
The above updates the YTD returns for some bellwether index ETFs for the Big 4 developed market trading partners – the US, Europe, China, and Canada. The aim of the chart is to plot some ETFs that tell some market stories for US investors thinking about global diversification. These ETFs are just a useful sample that uses relevant broad market indexes for each region as snapshots.
The goal of this chart is to capture the balance of risks across the broad mix of macro trends (economy, currency) and the sea level industry and company fundamentals rolled up into a US traded ETF. Once again, the US is dead last with a heavy influence of the dollar plunge in 2025. Hedged portfolios would look very different, but that is not the purpose of this chart.
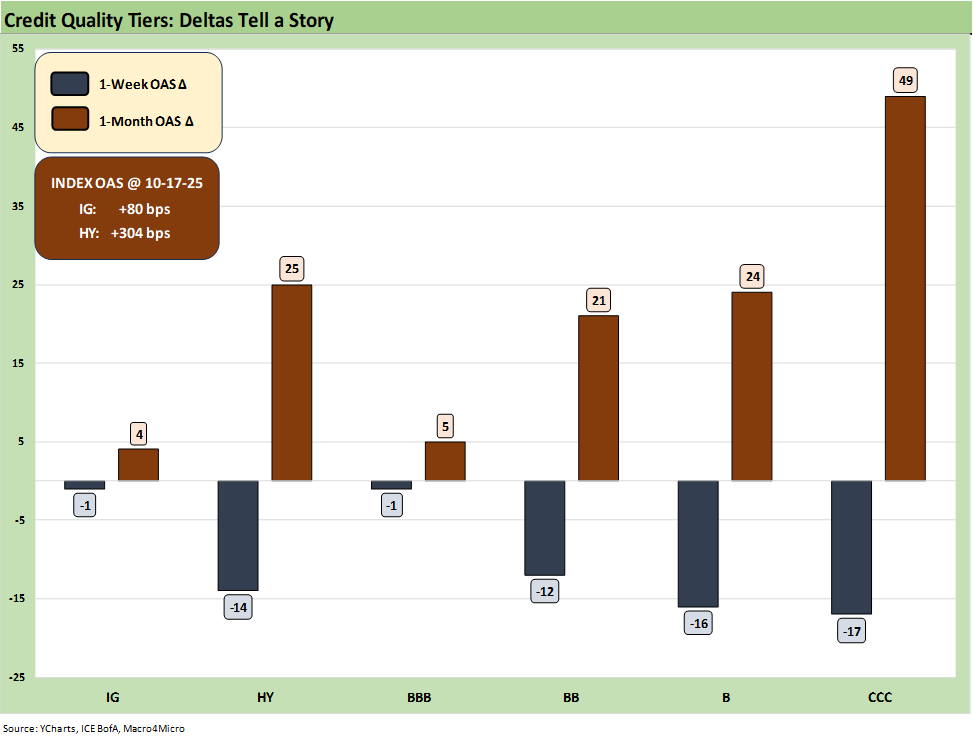
The above chart updates the rolling 1-week and 1-month OAS deltas for IG and HY and the credit tiers from BBB tier down to CCC. After a material widening last week, the credit benchmarks had an easy starting point with HY moving -14 bps tighter after moving +38 bps wider last week. The rolling 1-month for HY is now +25 bps wider at +305 bps, which is at least above the June 2007 HY OAS band. At +80 bps, IG OAS remains consistent with past credit cycle lows.
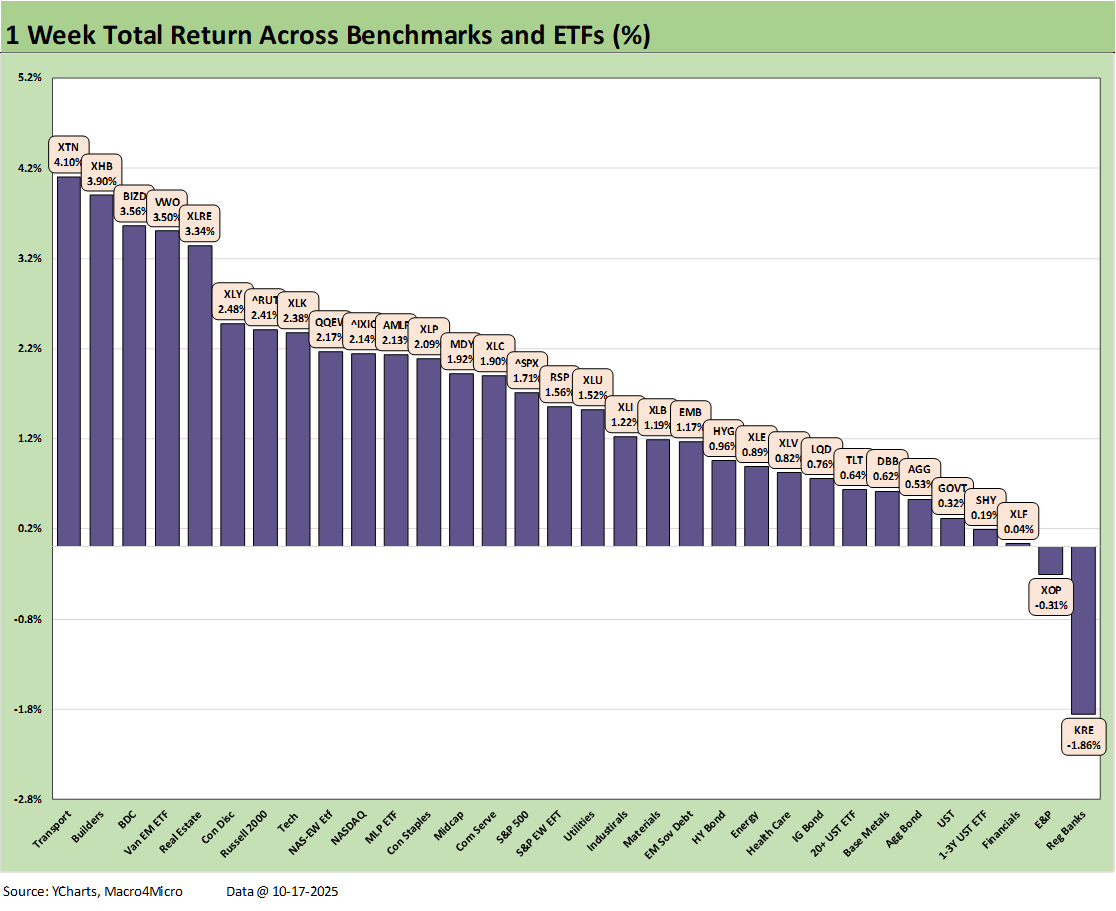
The above chart is our usual 1-week total returns chart covering 32 benchmarks and ETFs. We see the Regional Banks (KRE) on the bottom with the headlines around private credit and some real estate worries flowing into the regional bank returns. The other line in the negative zone is the E&P ETF (XOP) in second to last with a slight negative return. XOP saw yet another tick down in oil prices with WTI ending the week with a $57 handle vs. a $58 handle to end last week and almost $61 the prior week.
The big rebounds included tariff-sensitive (trade war hypersensitive) Transports (XTN) at #1, Homebuilders (XHB) #2, and the BDC ETF (BIZD) at #3. EM Equities stood at #4, and Real Estate (XLRE) at #5. The market saw private credit worries and some real estate noise impact Regional Banks also. All the bond ETFs were positive with 4 in the bottom quartile and 3 in the 3rd quartile.
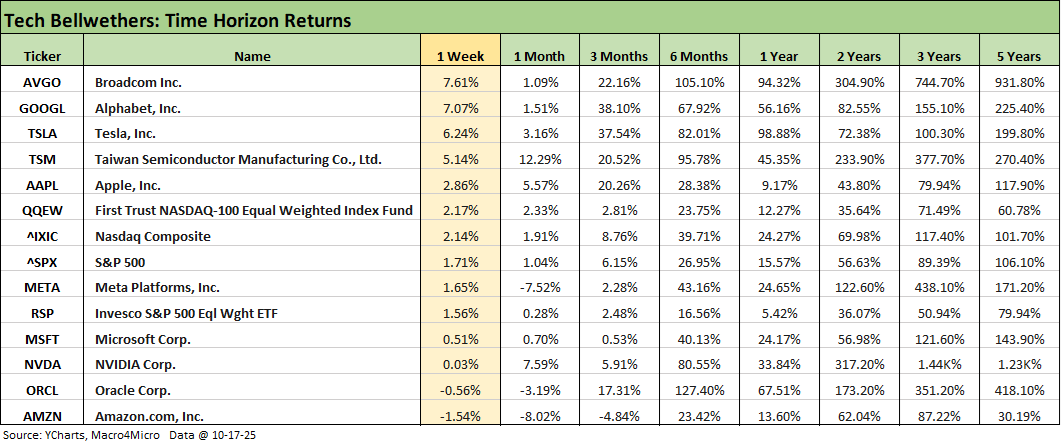
The above chart highlights a rebound after last week’s pain, but we still see some decidedly mixed numbers. We see the divergence this week and for the trailing 1-month across the “Mag 7+3” (the 3 being Broadcom, Taiwan Semi, and Oracle). Looking back 3 months, the 38% (Alphabet) and 37% (Tesla) on the high end and -4.8% (Amazon) and +0.5% (Microsoft) also tell a story of recently differentiated returns across the bellwethers.
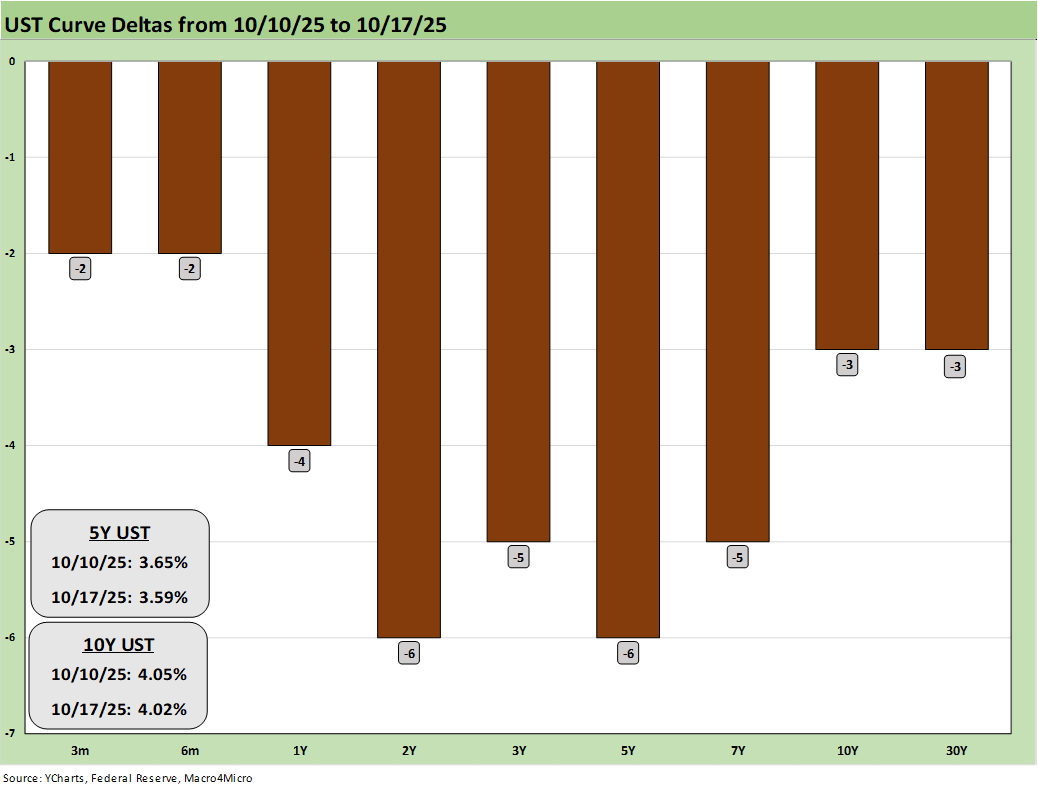
The above chart updates the 1-week UST deltas with a modest rally from 2Y to 7Y and slight moves out in 10Y and 30Y. The 10Y market briefly cracked the 4.0% line but finished just above 4.0% with 30Y mortgages at 6.23% in the Mortgage News Daily survey for Friday close. The UST bulls are looking to get back to the 3.6% handle of the post-Sept 2024 easing rally that also brought 6.0% mortgage rates.
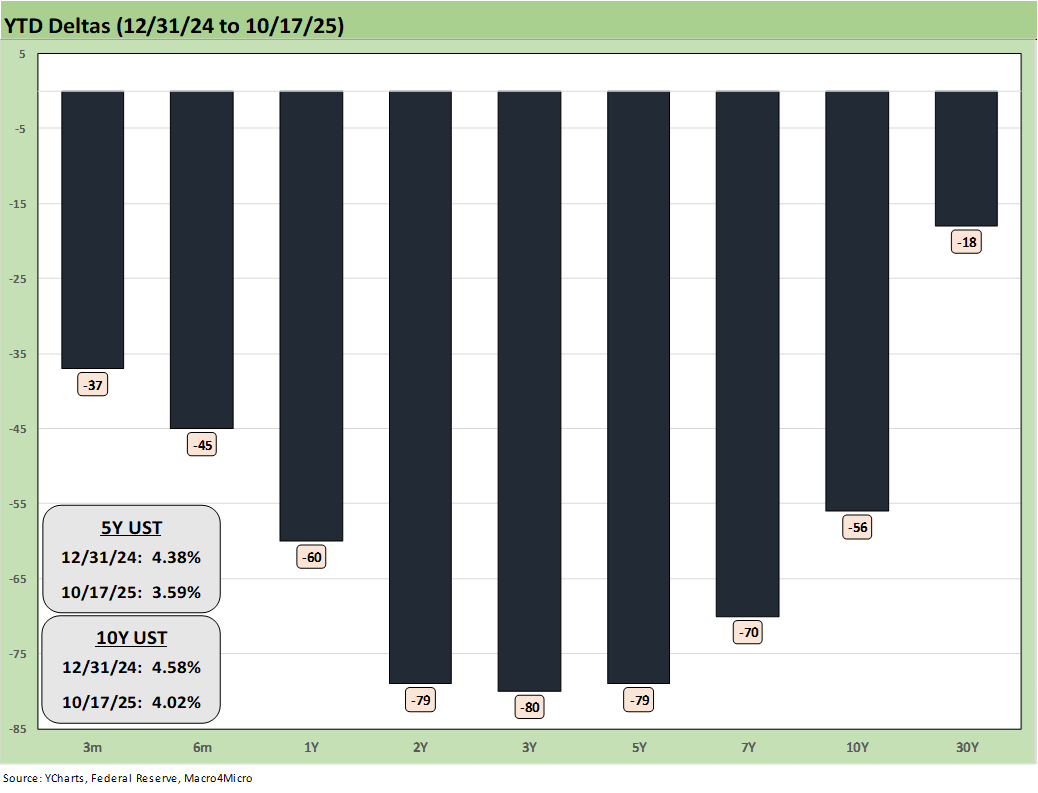
The above chart updates the running YTD UST deltas. The running bull steepener has shown a big move lower from 2Y to 5Y and a solid move in 10Y. The 30Y is lower but stubborn as the cyclical vs. inflation dynamics play out with a more secular flavor tied to the daunting UST supply overhang and intermediate term deficit outlook.
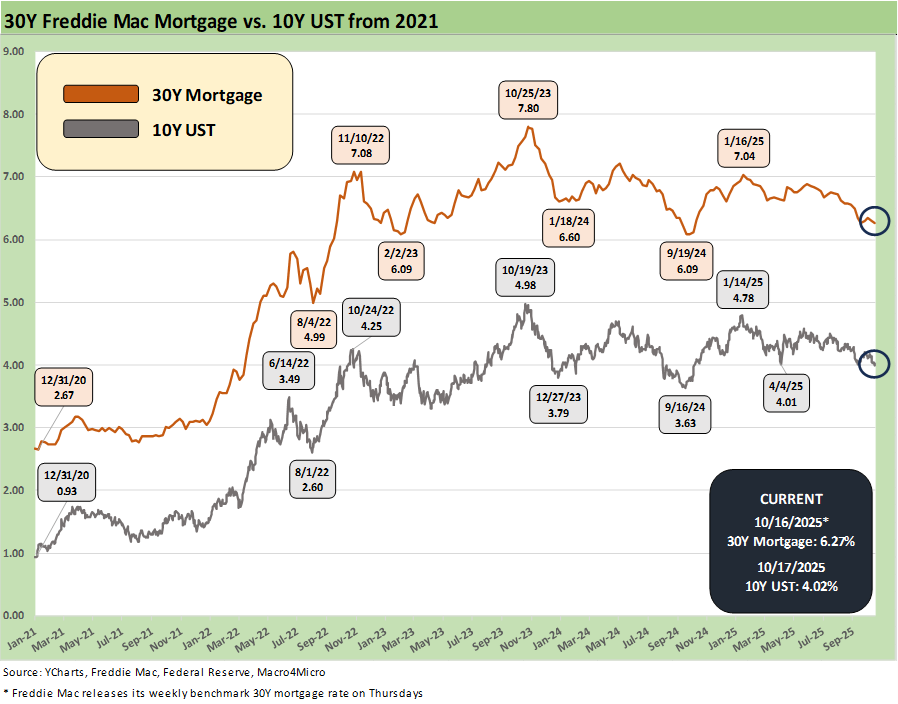
The above chart updates the time series for the 10Y UST vs. the Freddie Mac 30Y mortgage benchmark. The current market is looking back at the ensuing rally after the initial easing in Sept 2024. The following period saw more easing in 4Q24 that flowed into a stretch of bear steepening into early 2025. The current version is unfolding with the reality of past and new tariffs and a lack of economic releases that could last a while. The delayed CPI update is due on Oct 24. We still expect pricing pressure and a bear steepener into 2026.
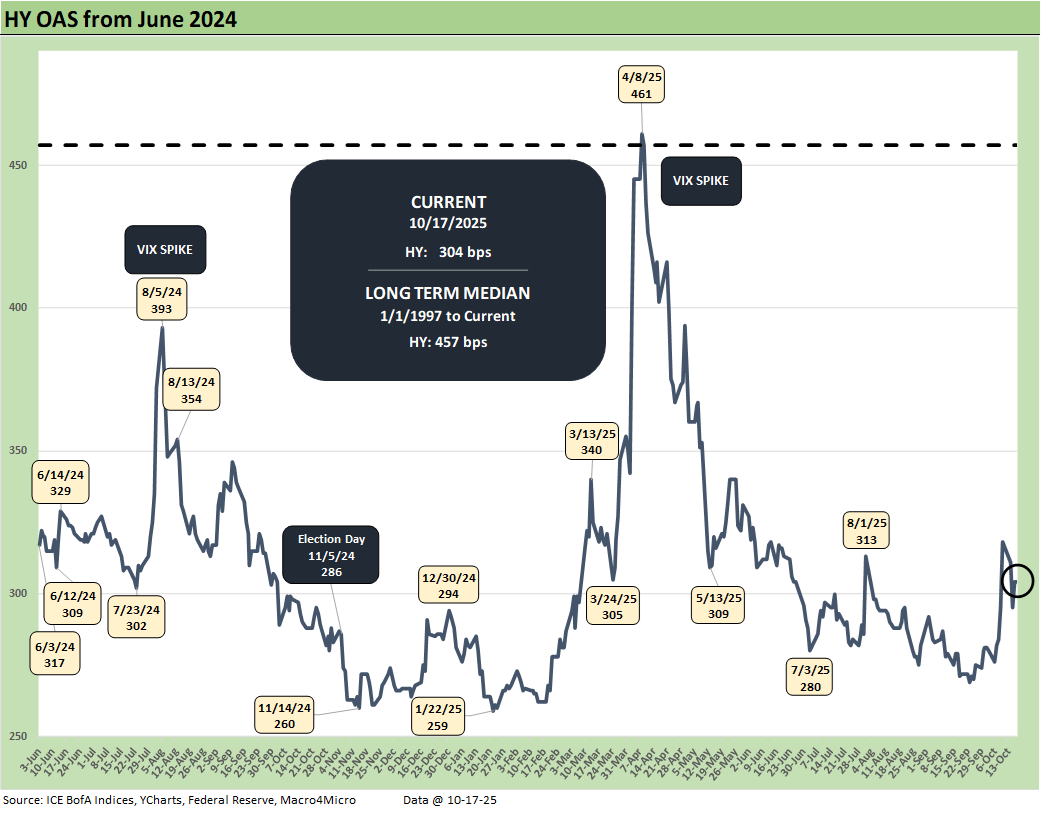
The above chart updates the running HY OAS from June 2024, and we see a -14 bps move tighter this week to +304 bps. That is still substantially wider than the +259 bps in the lows of Jan 2025 but still well inside the +457 bps median since the start of 1997.
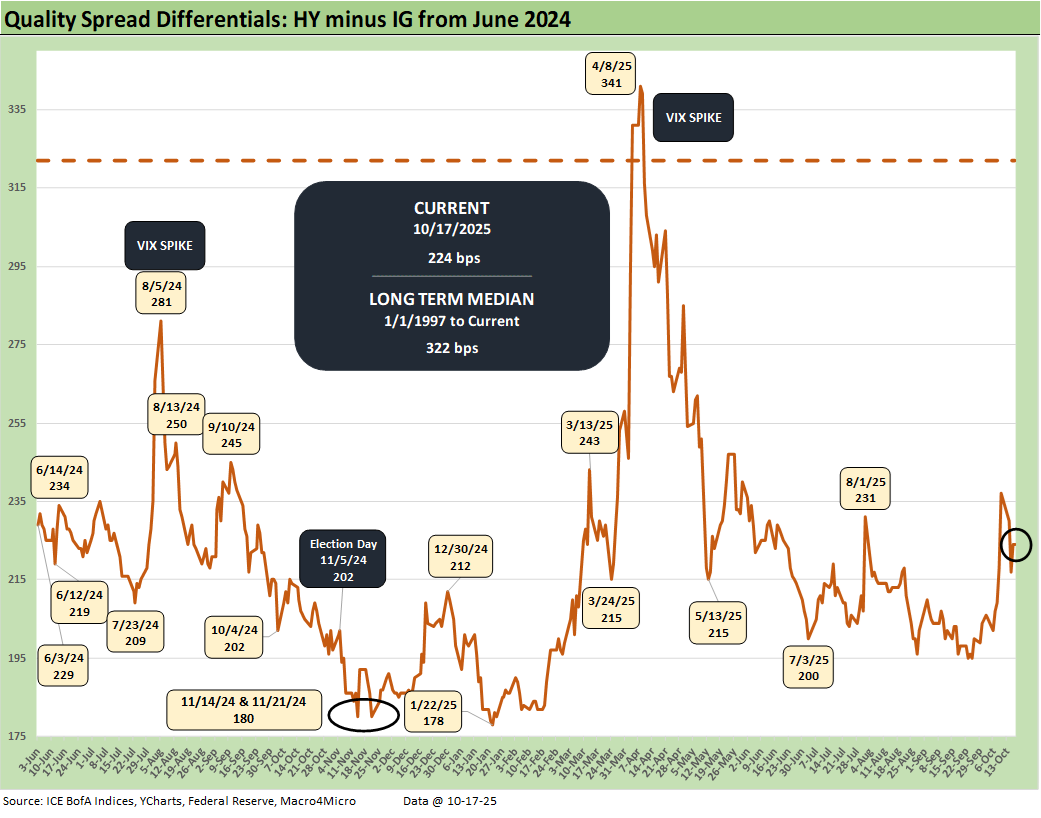
The above chart updates the “HY minus IG” quality spread differential as it tightened by -13 bps this past week from +237 from +224 bps. IG was -1 bps tighter on the week vs. -14 bps for HY for a net quality spread tightening of -13 bps.
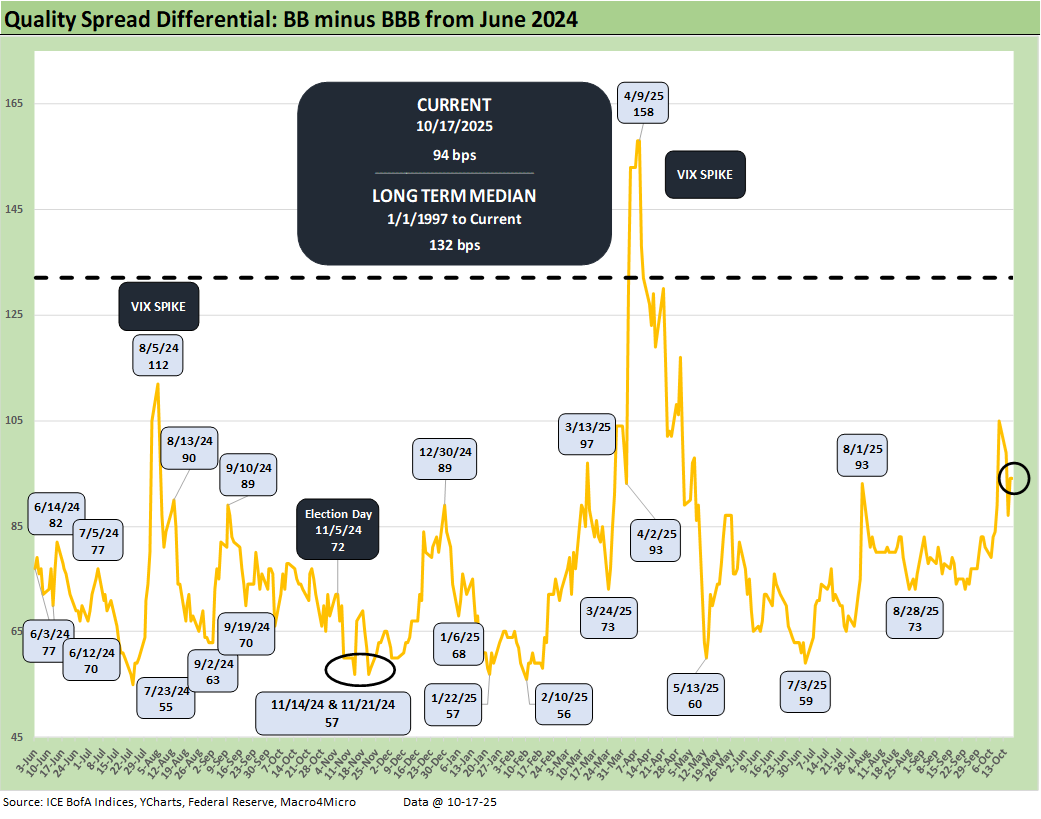
The above chart plots the “BB OAS minus BBB OAS” quality spread differential as it tightened by -11 bps with the BB tier tighter by -12 bps and the BBB tier tightened by -1 bps for a net quality spread move of -11 bps.
See also:
Credit Markets: Toxic Brew? New or Old Recipe? 10-13-25
The Curve: Macho Man Meets Patient Man 10-12-25
Market Commentary: Asset Returns 10-11-25
Mini Market Lookback: Event Risk Revisited 10-11-25
Credit Profile: General Motors and GM Financial 10-9-25
Credit Markets: The Void Begins 10-6-25
The Curve: Blind Man’s Bluff 10-5-25
Mini Market Lookback: Chess? Checkers? Set the game table on fire? 10-4-25
JOLTS Aug 2025: Tough math when “total unemployed > job openings” 9-30-25
Credit Markets: Cone of Silence Ahead? 9-29-25
The Curve: Easing Anxiety at Bat, Tariffs on Deck 9-28-25
Mini Market Lookback: Market Compartmentalization, Political Chaos 9-27-25
PCE August 2025: Very Slow Fuse 9-26-25
Durable Goods Aug 2025: Core Demand Stays Steady 9-25-25
2Q25 GDP Final Estimate: Big Upward Revision 9-25-25
New Homes Sales Aug 2025: Surprise Bounce, Revisions Ahead? 9-25-25
Credit Markets: IG Spreads Back in the Clinton Zone 9-22-25
Mini Market Lookback: Easy Street 9-20-25
FOMC: Curve Scenarios Take Wing, Steepen for Now 9-17-25
Home Starts August 2025: Bad News for Starts 9-17-25
Industrial Production Aug 2025: Capacity Utilization 9-16-25
Retail Sales Aug 2025: Resilience with Fraying Edges 9-16-25
Credit Markets: Quality Spread Compression Continues 9-14-25
Mini Market Lookback: Ugly Week in America, Mild in Markets 9-13-25
CPI August 2025: Slow Burn or Fleeting Adjustment? 9-11-25
PPI Aug 2025: For my next trick… 9-10-25
Mini Market Lookback: Job Trends Worst Since COVID 9-6-25