
Simplifying the Affordability Question
We frame some CPI metrics from Sept 2025 vs. Dec 2024 (last full Biden month) to clear up the “affordability” word salad.

“Hoax” and “Con Job” offer a mix of old and new words in the Trump verbal arsenal, so now the political rhetoric is using “affordability hoax” and “Democrat con job.”
The basic question, “Is inflation higher since Trump took office?” is worth an easy chart. Hard, factual numbers offer some clarity in the typically numbers-free dialogue. Even CNBC avoids the numbers to avoid rattling GOP guests.
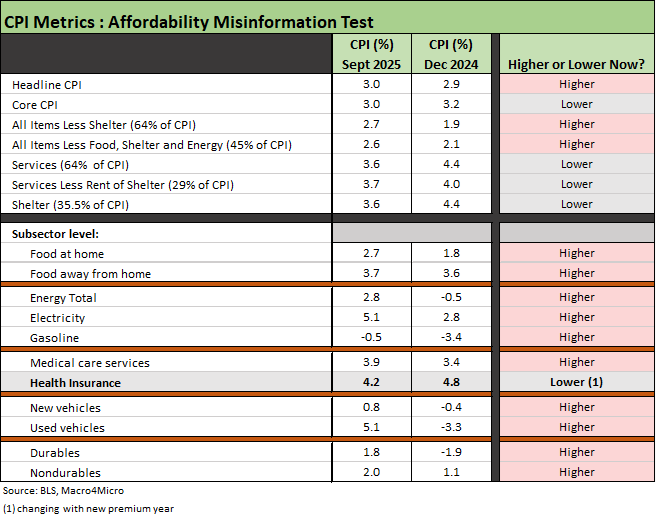
The chart below includes a cross section and sampler of key CPI lines from the BLS CPI reports showing Sept 2025 and Dec 2024 CPI lines. We covered a broader list across all the months and some key groups already (see CPI September 2025: Headline Up, Core Down10-24-25).
No one is questioning whether inflation is lower now than in the Biden years. 2022 was the worst since the early 1980s. An important question when framing Trump’s performance on affordability is, “What progress was made in inflation up through the end of Biden’s term? And what has Trump done since?”
Jan 2025 is when the Trump policy journey began. From 2022 through Dec 2024, Trump had nothing to do with the factors that saw inflation plunge from the peak. One could arguably give some credit to the laws of supply and demand and the Fed for the impressive progress in CPI metrics by Dec 2024, which was Biden’s last month in office. The economic developments and Fed action contributed to the move in “CPI All items” to +2.9% in Dec 2024 (vs. +3.0% in Sept 2025).
Of course, Team Trump never says anything positive about Powell. He is after all not a captive loyalist. Trump also never cites the role of Putin’s invasion of Ukraine and what that meant for oil, natural gas, gasoline at the pump, or how much power costs. Trump does not ever say, “Russia illegally invaded Ukraine and started the war,” contributing to a significant spike in inflation. That at least gives context to Trump’s incomplete view on inflation.
A few of our favorite Trump statements from the past week:
“We have no inflation now.”
Actually, Trump can boast long-term median headline inflation now at 3%. Congratulations. Headline CPI was slightly lower in Dec 2024.
“Prices are much lower now.”
Trump needs to work on his definition of inflation. Inflation means prices are higher unless the economy is seeing deflation.
“Energy is lower. Oil is lower. Gasoline is lower.”
Trump should be careful in his use of the term “energy” since Electricity and Utility Piped Gas are in that bucket under “Energy Total CPI.” As of Sept 2025, Total Energy CPI was +2.8% vs. -0.5% in Dec 2024. In terms of the weighting, Total Energy CPI is 6.4% of the CPI index. Gasoline is 2.8% of that weighting with Electricity at 2.5% and Utility Piped Gas at 0.8%. Other fuel oils make up the remainder.
That means inflation for Energy Total was notably higher in the Sept 2025 CPI report than in Dec 2024. In Dec 2024, Electricity CPI was +2.8% vs. +5.1% in Sept 2025. Utility Piped Gas CPI in Sept 2025 was +11.7%. or more than double the +4.9% YoY in Dec 2024.
All in, energy CPI should not be on Trump’s bragging list. But the media fails to call him out.
A few other line items that matter to many:
Medical care services inflation: This is separate from the health insurance line, but Medical Care Services CPI in Sept 2025 was +3.9% vs. +3.4% in Dec 2024. Within that headline bucket, “Hospital and Related Services” was +5.8% in Sept 2025, above the +4.0% of Dec 2024. Given the direction of demographics and focus on Medicaid and Medicare policy from Washington, this medical care CPI trend is bad news. That said, these costs will be dwarfed by the problems of ACA premiums and broader budget setbacks in Medicaid (that is a lot of old people and sick children) but Health Care inflation is going the wrong way in a broad category that is 18% of GDP.
New Vehicles and Used Vehicles: New Vehicles posted CPI of +0.8% in Sept 2025 while in Dec 2024 New Vehicle CPI was -0.4%. Used Vehicle CPI was +5.1% in Sept 2025 vs. -3.3% in Dec 2024. So, the trend is going in the wrong direction under Trump. So far, the OEMs have been eating the tariffs and working on their game plan. However, the expectation is that we will see higher new vehicle inflation into 2026 at low % levels but attached to big ticket items with the average transaction price on a car around $50K.
The Biden fixation problems vs. the reality of now.
We don’t question whether the Biden term was a brutal one for inflation. That is why he lost the election after winning in 2020 by 7 million votes. When you have high inflation, you lose at the polls. Just ask Ford in 1976 or Carter in 1980. We tend to paint with a much broader brush on what economic forces drove inflation to 9.1% in June of 2022.
Unlike Team Trump, we have no problem highlighting what role Putin played in energy costs and the resultant multiplier effects across raw materials, power, freight and logistics, input cost pressure from ag to plastics, and higher food prices, etc. Anyone around during the 1979-1982 chaos and stagflation of late 1973 to 1975 knows the overriding force of spikes in oil and gas.
In sum, the Trump’s performance on affordability began in Jan 2025 not during 2022. He does not get credit for the journey from 9% handles to 2.9% CPI in Dec 2024. His policies began in 2025 and the record is in the numbers not in the word salad.