
Mini Market Lookback: Not Quite Magnificent Week
A mixed equity week lacked breadth, UST rose, and spreads in credit were tighter before the 10-31 rebalancing sent them wider.


I can’t believe the courts said we had to feed them…
A very busy week blurred by with the FOMC actions and commentary, tariff calm coming out of the China “not a trade deal”, ongoing shutdown wildcards (notably SNAP and the court decision), the impending arrival of “ACA premium D-Day” (it is here), a mega bond deal from META alongside massive debt-financed JVs for data center investment, soft homebuilding reports, and a major wave of bellwether industrial earnings that included constructive numbers from Boeing and Caterpillar.
We saw our 32 benchmarks and ETFs weigh in with a positive vs. negative score of 10-32 with an adverse UST shift that sent 6 of 7 bond ETFs into negative range while punishing rate-sensitive ETFs despite the -25 bps FOMC cut. Powell’s more guarded language and at least some higher visibility of a hawkish FOMC minority was running alongside a good 3Q25 earnings quarter. The FedWatch odds of a December cut plunged to 63% from just under 92% 1 week ago.
The 11 S&P 500 sectors saw 6 negative, 4 positive and one flat. Extraordinary borrowing for AI infrastructure purposes was a headline in a week when 5 of the Mag 7 printed strong return numbers even if META equity got a Bronx cheer. The material divergence in Hi-Lo numbers in the tech bellwethers came with a 21-point gap between Amazon on top with Meta on the bottom.
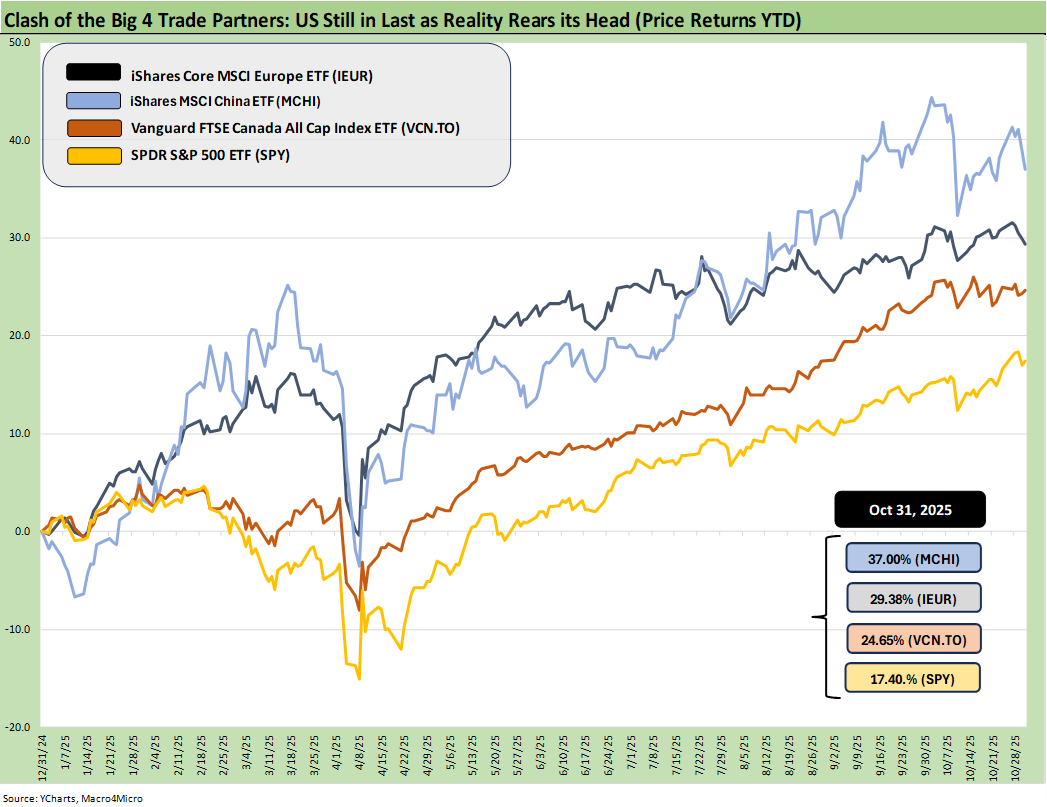
The above updates the YTD returns for some bellwether index ETFs for the Big 4 developed market trading partners – the US, Europe, China, and Canada. The aim of the chart is to plot some ETFs that tell a market story for US investors thinking about global diversification. These ETFs are just a useful sample that uses relevant broad market indexes for each region as snapshots.
The goal of this chart is to capture the balance of risks across the broad mix of macro trends (economy, currency) and the sea level industry and company fundamentals rolled up into a US traded ETF. Once again, the US placed in dead last YTD with a heavy influence of the dollar plunge in 2025.
The movement in the UST curve and the dollar will be the key drivers of these relationships in coming months. There are obviously more than a few top-down variables in the US macro and political picture that can concern global investors, but at least this week’s US-China trade truce and latest pause help.
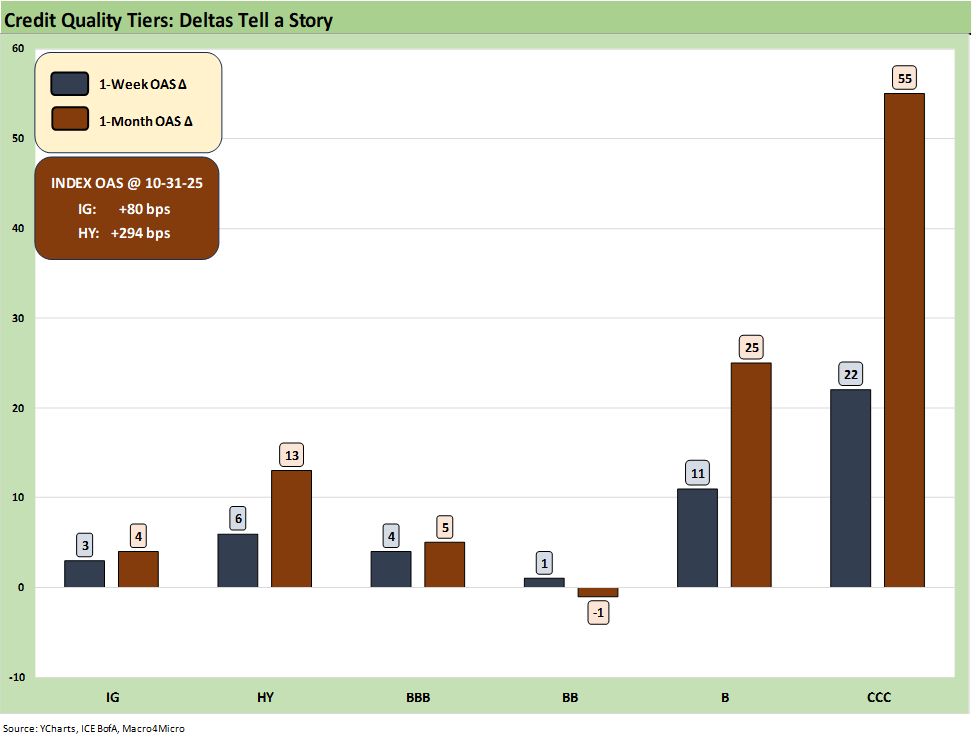
The above chart frames the post-rebalancing 1-week and 1-month deltas for IG and HY spreads and for the BBB tier and down. At +80 bps, IG is in line with historical cyclical tights while HY OAS at +294 bps is near the higher end of the June 2007 credit bubble month. The CCC tier showed some constituent gyrations and issuer mix shifts in Telecom and Retail pushing spreads higher with new bond entrants.
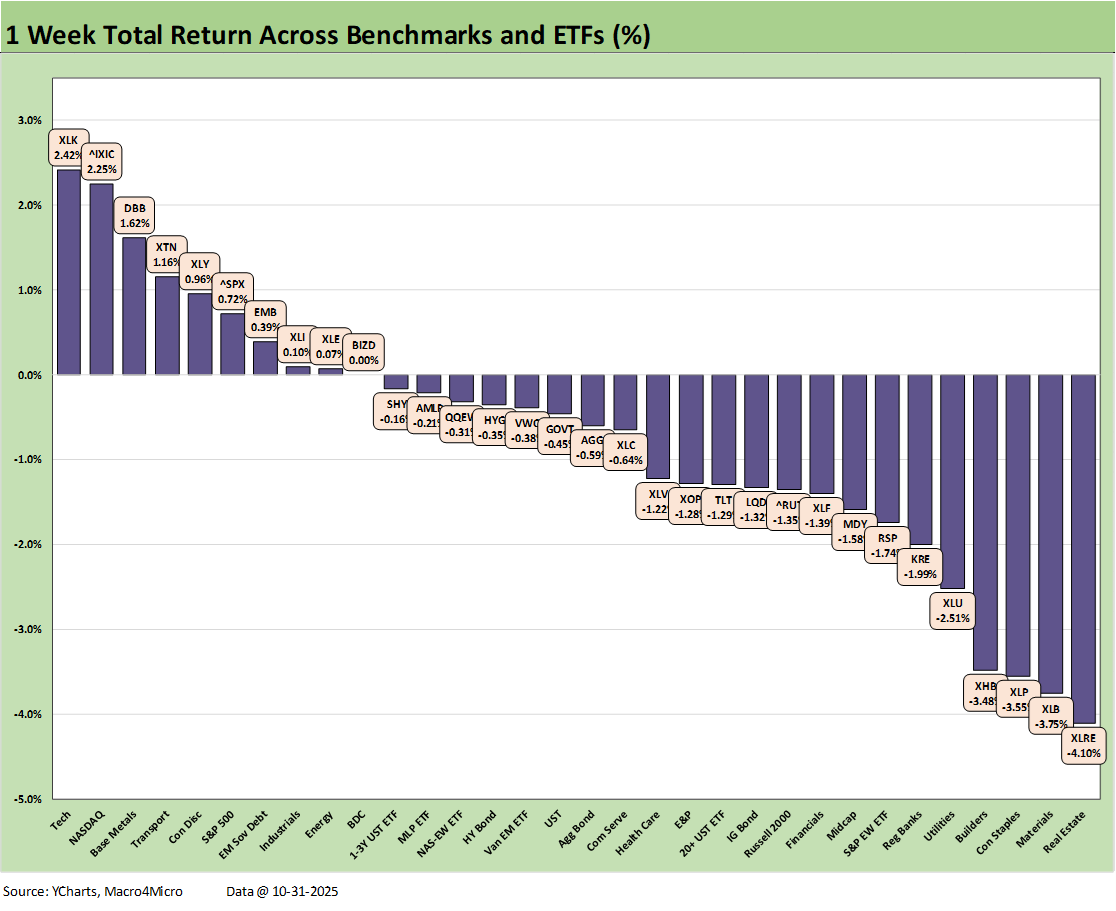
The above chart shows the 1-week returns for the week on the benchmarks and ETFs, and the numbers were worse than those seen in recent weeks with a positive vs. negative score of 10-22. We see 6 of 7 bond ETFs in the red with only the EM Sovereign ETF (EMB) edging across the line into positive range. Longer duration TLT and LQD were the worst performers within the bond group.
The large caps benchmarks (S&P 500, NASDAQ) rode the leading tech bellwethers in the “Mag 7+3” (despite two major laggards in Meta an Oracle). Industrials (XLI) moved into the top quartile in a banner week for a few bellwether industrials. We see the small cap Russell 2000 (RUT) down at the bottom of the third quartile and Midcaps (MDY) at the top of the bottom quartile. Financials (XLF) sat in the last slot of the third quartile with Regional Banks (KRE) in the bottom quartile.
The worst of the bottom quartile includes some of the most rate-sensitive and dividend heavy issuers with Real Estate (XLRE) on the bottom along with Consumer Staples (XLP) and the cyclical Materials ETF (XLB). Homebuilders (XHB) were hit by the UST curve and mixed view of steepening risk from the long end. D.R. Horton reported soft numbers as the homebuilding industry leader. Mortgage rates jumped around at the end of the week but as we cover below settled just below 6.3% at the Friday close for the Mortgage News Daily Survey.
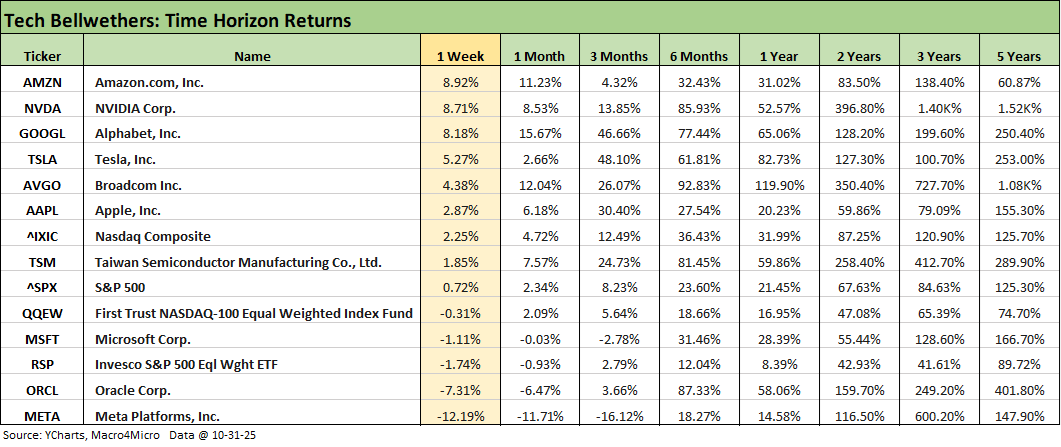
The above chart updates the tech bellwethers with 5 of the Mag 7 beating the NASDAQ and S&P 500 this week. The theme of divergence in tech returns is alive and well in the table. Hyper bullish AI investors are looking at who has the most upside if the AI nirvana plays out.
We see Microsoft in the red and Meta a distant dead last at -12.2% even with decent earnings (mixed views on that) and a massive bond deal ($30 bn) to fund its next round of growth. The headline swirl shifted from the positive growth aspects of AI investment to the reality that the stakes rise when it is on your balance sheet in the form of debt or JVs incurring outsized debt burdens.
We see 5 of the Mag 7 were very solid performers while 2 of the Mag 7 (Meta, Microsoft) were in the red. If we look back 6 months, Meta stock was the worst of the Mag 7 and also behind Oracle, Taiwan Semi, and Broadcom. The same is true looking back 1 year, but Meta frames up better over 2 years.
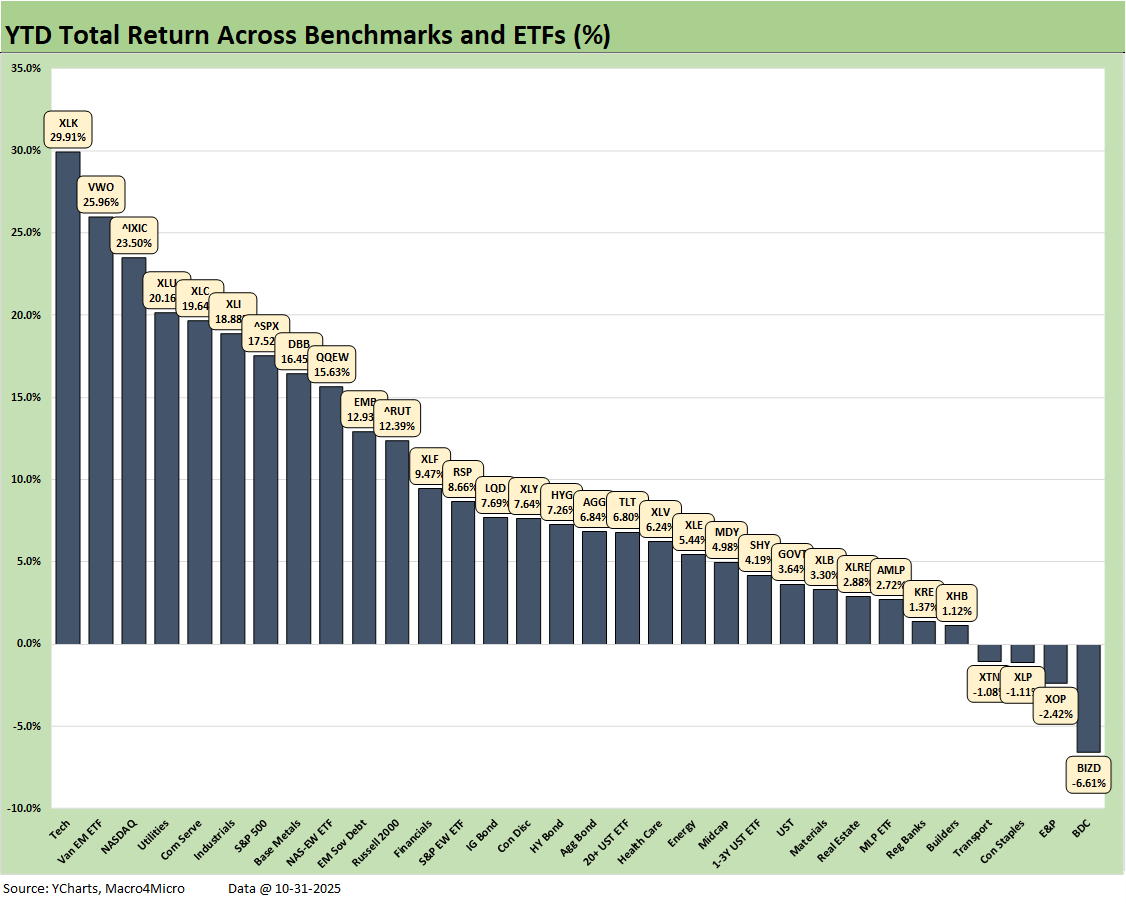
We include the YTD return chart also in this week’s “Mini” and see a 28-4 score. The YTD timeline shows a very good year for equities and a solid year for bonds with no bond ETFs in the bottom quartile. We see a good mix in the top quartile even if a bit tech-centric with Tech (XLK) at #1, NASDAQ at #3, Communications Services (XLC) at #5, and tech-heavy S&P 500 at #7 with the Equal Weight NASDAQ 100 ETF (QQEW) just across the line at #9. EM Equities (VWO) ranks near the top on dollar weakness while Utilities (XLU) cracked the Top 5 with Industrials (XLI) taking a slot in the top tier with Base Metals (DBB).
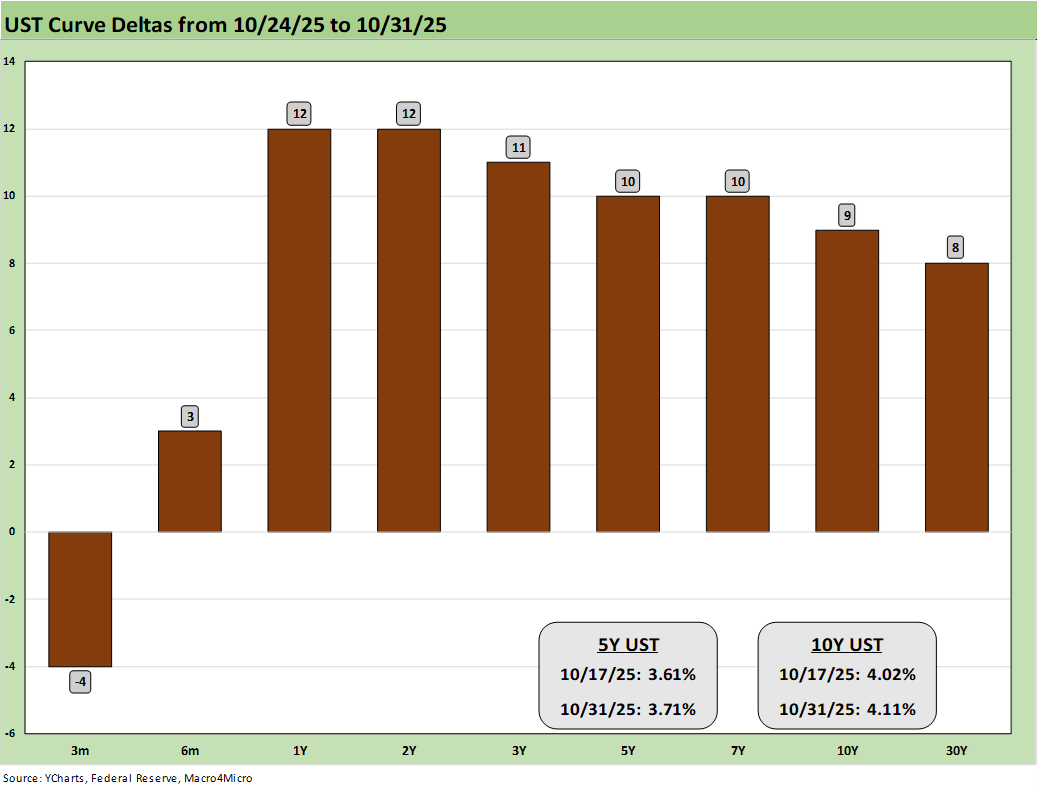
The above chart updates the 1-week UST deltas, and there was very little good news in there for duration. The FOMC is also making life harder for Trump to just blame Powell for rates since hawks are making themselves more visible.
The lack of data flow and the realities of many tariff game plans unfolding and not even in the numbers yet means that the debate is not over on inflation impact even if many would like to pretend it is. Ardent Trump supporter Ken Griffin was clear on the lagging effects of these dramatic changes in trade policy, and no one can accuse him of being a socialist. As noted earlier, Powell was clear that the Dec hike was not a sure thing as FedWatch saw the odds of a December cut drop to 63% from almost 92%.
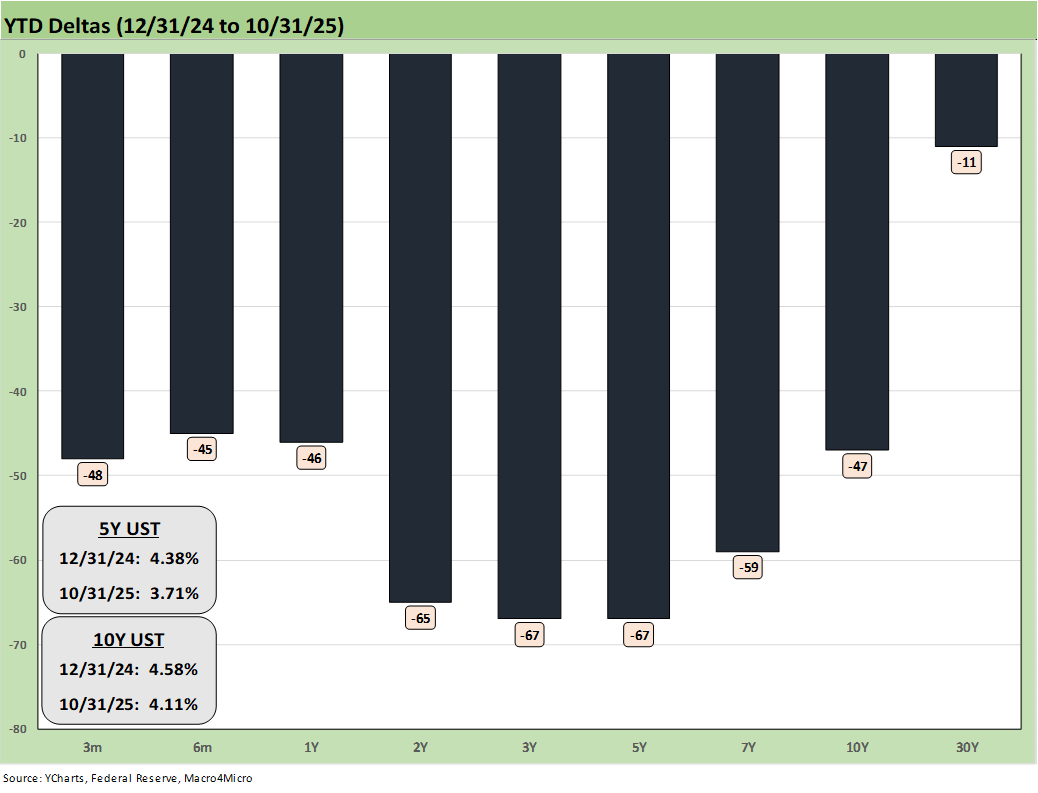
The above chart updates the YTD UST bull steepening as 2025 has been kind to both equities and bonds.
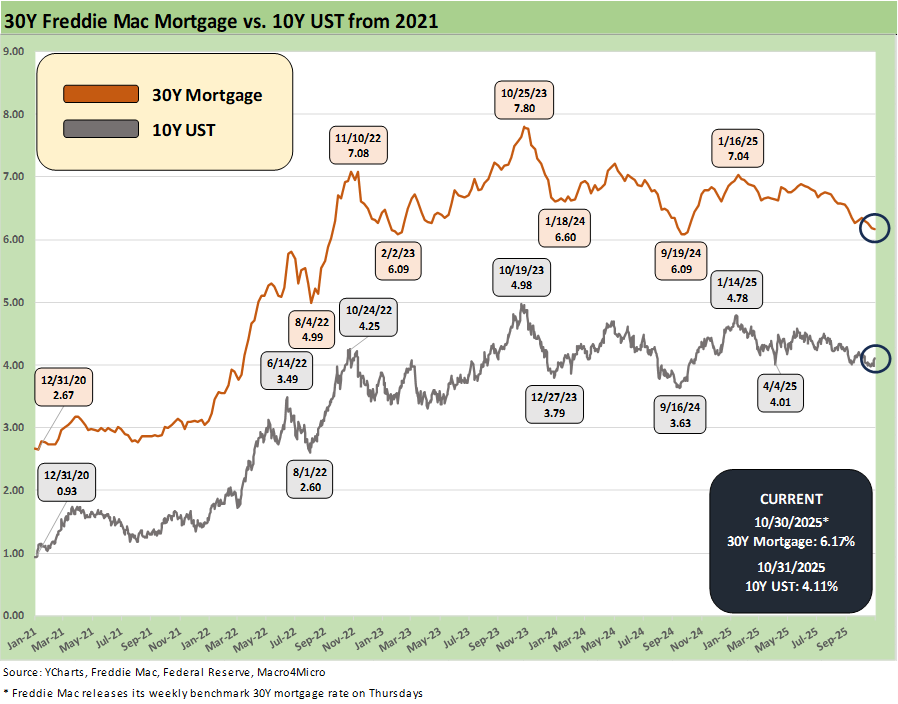
The above chart updates the running time series for the 10Y UST vs. the Freddie Mac benchmark 30Y mortgage. Rates are moving in the right direction YTD 2025, but the hope for mid-5% mortgage rates would appear to require more macro trouble to get there. The economy has been resilient even if there is justifiable anxiety around payrolls. Soft payrolls would complicate the homebuyer confidence dynamics even if it would be supportive of mortgage rates monthly payment math. The stagflation worry is not gone.
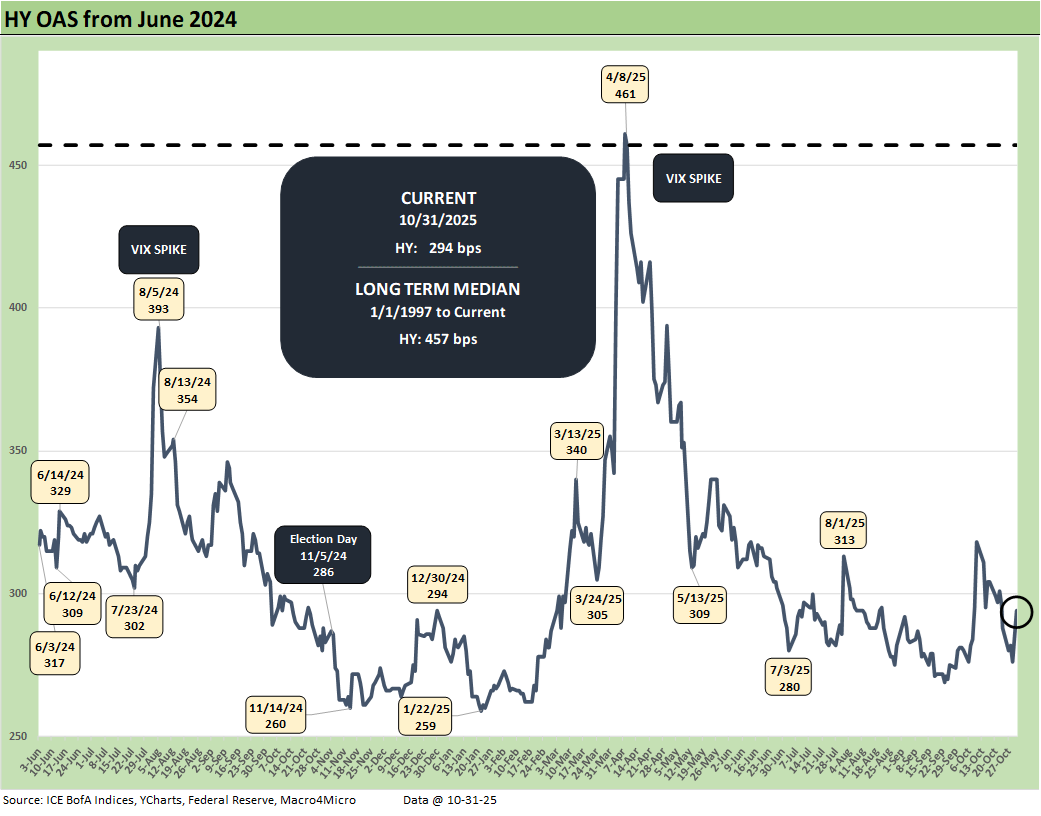
The above chart shows HY OAS + 6 bps wider with the BB tier +1 bps wider, the B tier +11 bps, and the CCC tier +22 bps wider. The rebalancing activity in the CCC tier saw a swing in the CCC composite from -20 bps tighter before rebalancing to +22 bps wider on some post-restructuring drop-ins.
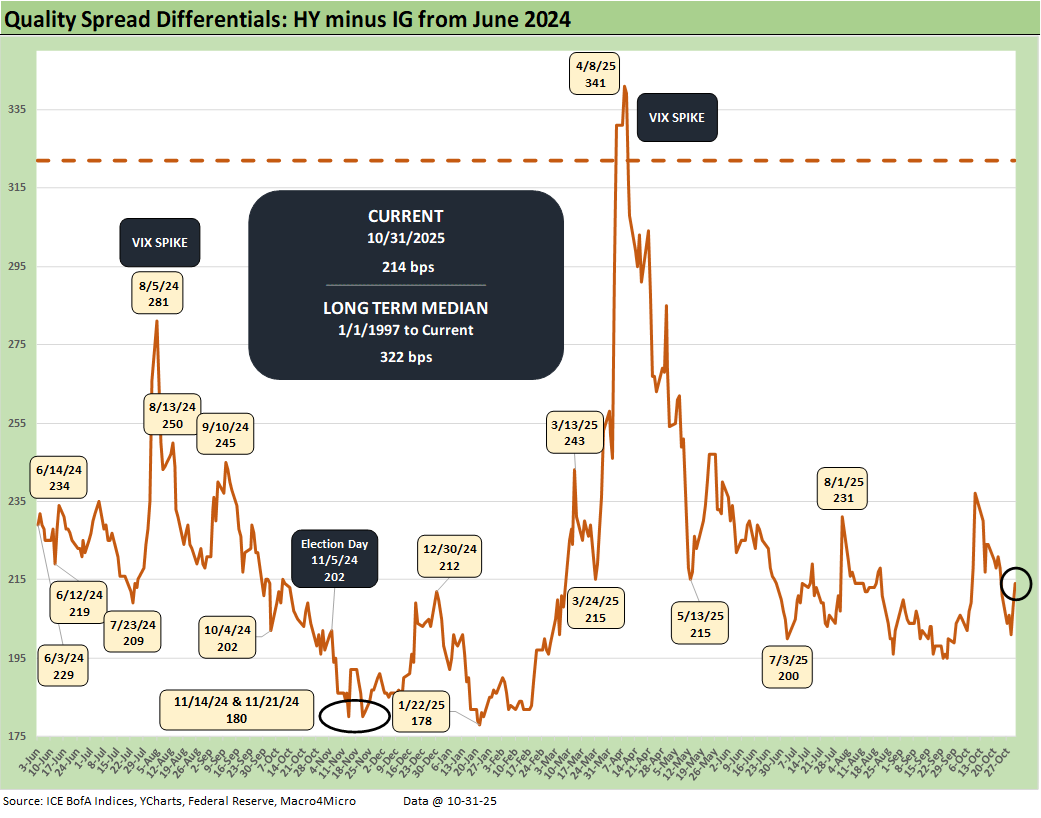
The above chart shows the HY minus IG quality spread differential moving +3 bps wider as HY moved +6 bps wider and IG +3 bps wider. The +214 bps remains notably compressed relative to the +322 bps long-term median.
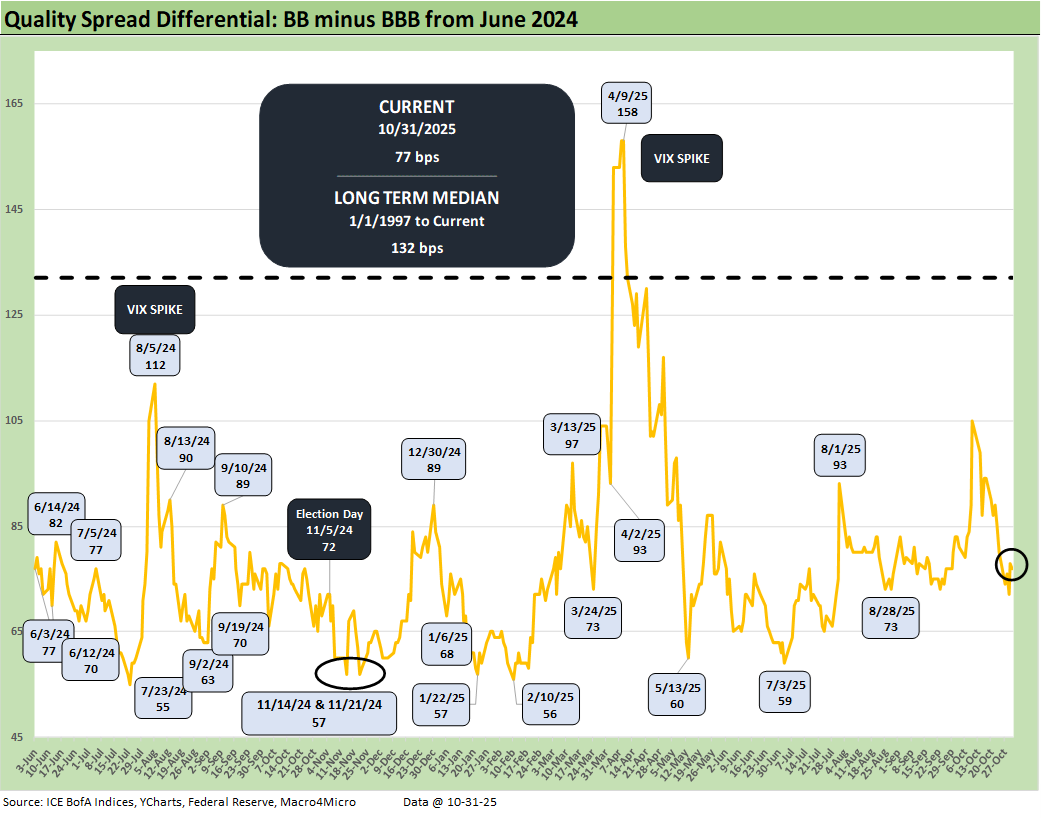
The above chart shows the BB OAS minus BBB OAS quality spread differential moved -3 bps tighter as the BB tier widened by +1 bps and BBB tier widened by +4 bps. The +77 bps is well inside the long-term median of +132 bps but significantly wider than the early 2025 low of +56 bps.
See also:
Synchrony: Credit Card Bellwether 10-30-25
Credit Markets: Call Me After Trouble Arrives 10-27-25
The Curve: A Slow Pour of Tariffs 10-27-25
Market Commentary: Asset Returns 10-26-25
Existing Home Sales Sept 2025: Staying in a Tight Range 10-26-25
Mini Market Lookback: Absence of Bad News Reigns 10-25-25
CPI September 2025: Headline Up, Core Down 10-24-25
General Motors Update: Same Ride, Smooth Enough 10-23-25
Credit Markets: The Conan the Barbarian Rule 10-20-25
Mini Market Lookback: Healthy Banks, Mixed Economy, Poor Governance 10-18-25
Mini Market Lookback: Event Risk Revisited 10-11-25
Credit Profile: General Motors and GM Financial 10-9-25
Mini Market Lookback: Chess? Checkers? Set the game table on fire? 10-4-25
JOLTS Aug 2025: Tough math when “total unemployed > job openings” 9-30-25
Mini Market Lookback: Market Compartmentalization, Political Chaos 9-27-25
PCE August 2025: Very Slow Fuse 9-26-25
Durable Goods Aug 2025: Core Demand Stays Steady 9-25-25
2Q25 GDP Final Estimate: Big Upward Revision 9-25-25
New Homes Sales Aug 2025: Surprise Bounce, Revisions Ahead? 9-25-25
Mini Market Lookback: Easy Street 9-20-25
Home Starts August 2025: Bad News for Starts 9-17-25
Industrial Production Aug 2025: Capacity Utilization 9-16-25
Retail Sales Aug 2025: Resilience with Fraying Edges 9-16-25
Mini Market Lookback: Ugly Week in America, Mild in Markets 9-13-25
CPI August 2025: Slow Burn or Fleeting Adjustment? 9-11-25
PPI Aug 2025: For my next trick… 9-10-25
Mini Market Lookback: Job Trends Worst Since COVID 9-6-25