
Mini Market Lookback: Tariff Policy Shift Tells an Obvious Story
A notable – but unstated – admission came from Team Trump that the buyer pays the tariffs with a wave of exemptions.


“I was just messing with you…’buyer pays’ and it does impact price.”
The week was clearly biased to the negative side in asset returns despite HY spreads tighter by -8 bps on the shutdown news. The S&P 500 was barely positive with only 5 of 11 sectors positive, and only 8 of our 32 benchmarks were in positive range. Both the Russell 2000 small caps and Midcaps were in the bottom quartile with NASDAQ also in the red in the 3rd quartile. We see 6 of the 7 bond funds negative with the short UST ETF (SHY) posting a flat 0% week.
With the shutdown over, paychecks flowing, airline flights getting back into action, and budgets allowing for payment of goods and services, some big questions revolve around how quickly economic data can get ramped back up and whether any major changes to the data providers will be rolled in as well. Will Project 2025 guru and OMB head Vought use this window as an opportunity to assert control and consolidate the BLS and BEA?
The “affordability” topic got a lot of attention coming out of the lopsided election results which brought a wave of misinformation flowing out of Washington. The timing of the next round of CPI and PCE remains uncertain. The tirade from the White House took some liberties with the facts on the direction of CPI line items (see Retail Gasoline Prices: Biblical Power to Control Global Commodities 11-13-25, Simplifying the Affordability Question 11-11-25). The change in tariff policy on many products (coffee, bananas, beef, and more) is as close as you can get to a confession of misleading the public.
At least September 2025 payrolls will be out this coming week. The payroll color turned negative on the week from ADP, but the odds of a Dec FOMC cut keeps declining with the eroding inflation numbers and constructive balance of macro directional signals during earnings season. As we go to print, FedWatch odds for a Dec cut stood at 44.4%, which is down by over 22 points the past week and by almost 50 points over a 1-month timeline.
The market still has not received the advance estimate on 3Q25 GDP, and there have been no timely PCE and Income and Outlays releases, Retail Sales, or Industrial Production. Consumer-oriented releases will be helpful at a time when UMich Consumer Sentiment barely missed an all-time low. At least the FOMC will have some outdated payroll and CPI data.
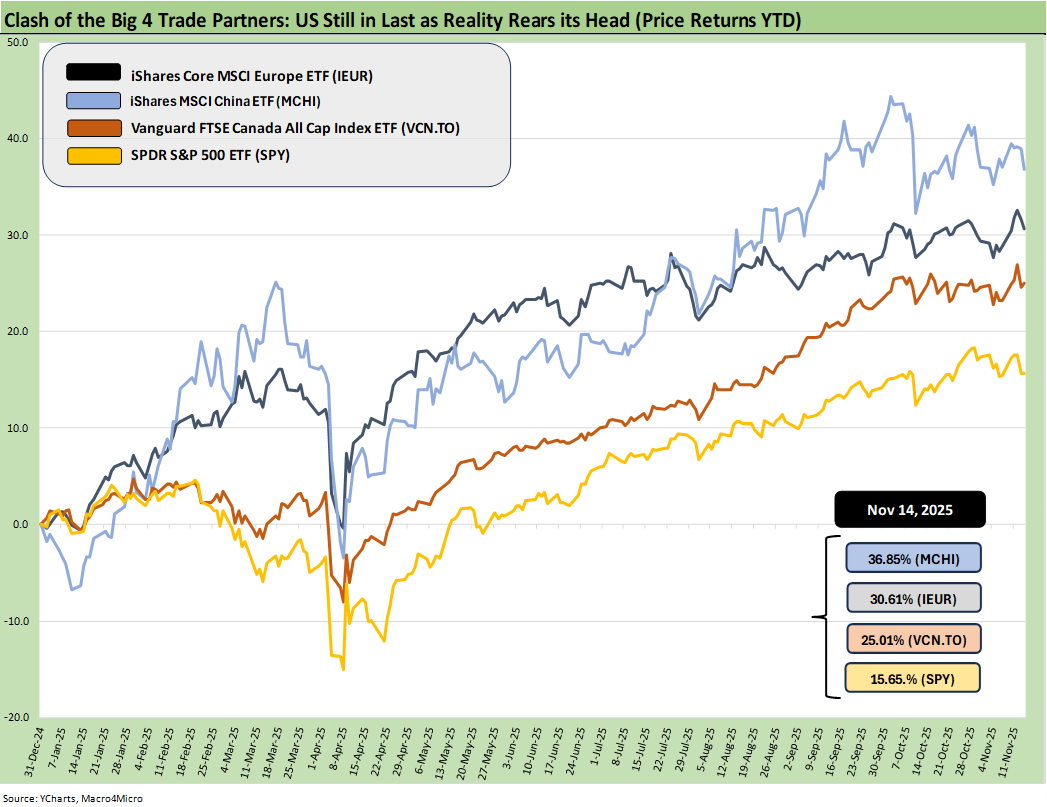
The above chart updates the YTD returns for some bellwether index ETFs for the Big 4 developed market trading partners – the US, Europe, China, and Canada. The aim of the chart is to plot some ETFs that tell a market story for US investors thinking about global diversification. These ETFs are just a useful sample that uses relevant broad market indexes for each region as snapshots.
The goal of this chart is to capture the balance of risks across the broad mix of macro trends (economy, currency) and the sea level industry and company fundamentals rolled up into a US traded ETF. Once again, the US placed dead last YTD with the heavy influence of the dollar plunge in 2025.
The dollar has been on the mend in recent weeks after the worst YTD stretch since the 1970s. We look at the 30Y UST vs. the dollar index in our UST curve weekly that we will publish later. The resumption of data flows and more color from the FOMC in December’s decision will go a long way toward setting the stage for the dollar and the relative performance in the above chart.
The rule of thumb is the dollar stays firm or strengthens when the US economic indicators are strong and UST rates are stubborn or higher. The political disarray and relative instability of Washington in 2025 (setting the stage for election attacks in 2026, soldiers in the street, authoritarian leaning White House with GOP and SCOTUS tacit support, the optics of ICE violence) have raised some unusual issues for the dollar. The local currency-exposed ETFs thus make for a more complex set of inputs into 2026.
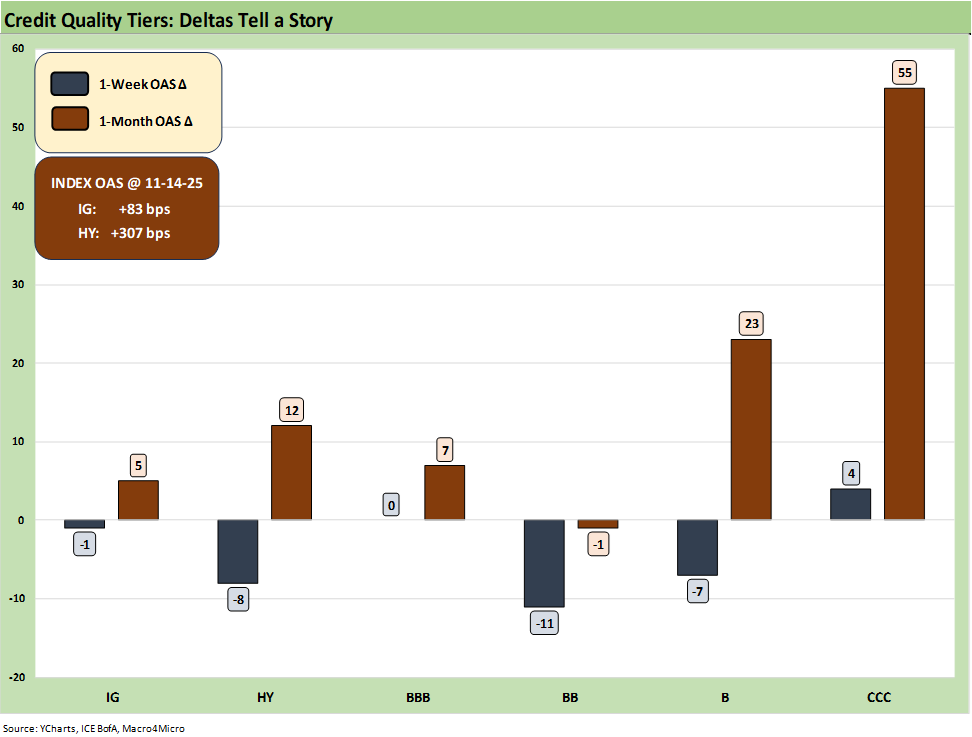
The above chart updates the 1-week and 1-month spread deltas for IG and HY and for the BBB tier down to the CCC tier. The week went well in credit spreads overall, but the running 1-month has been a struggle as HY quality spread widening ebbs and flows. The +307 bps for HY is a “peak credit cycle” level in historical context and the same for the IG OAS of +83 bps (see Credit Markets: Budget Armistice or GOP Victory Day? 11-12-25).
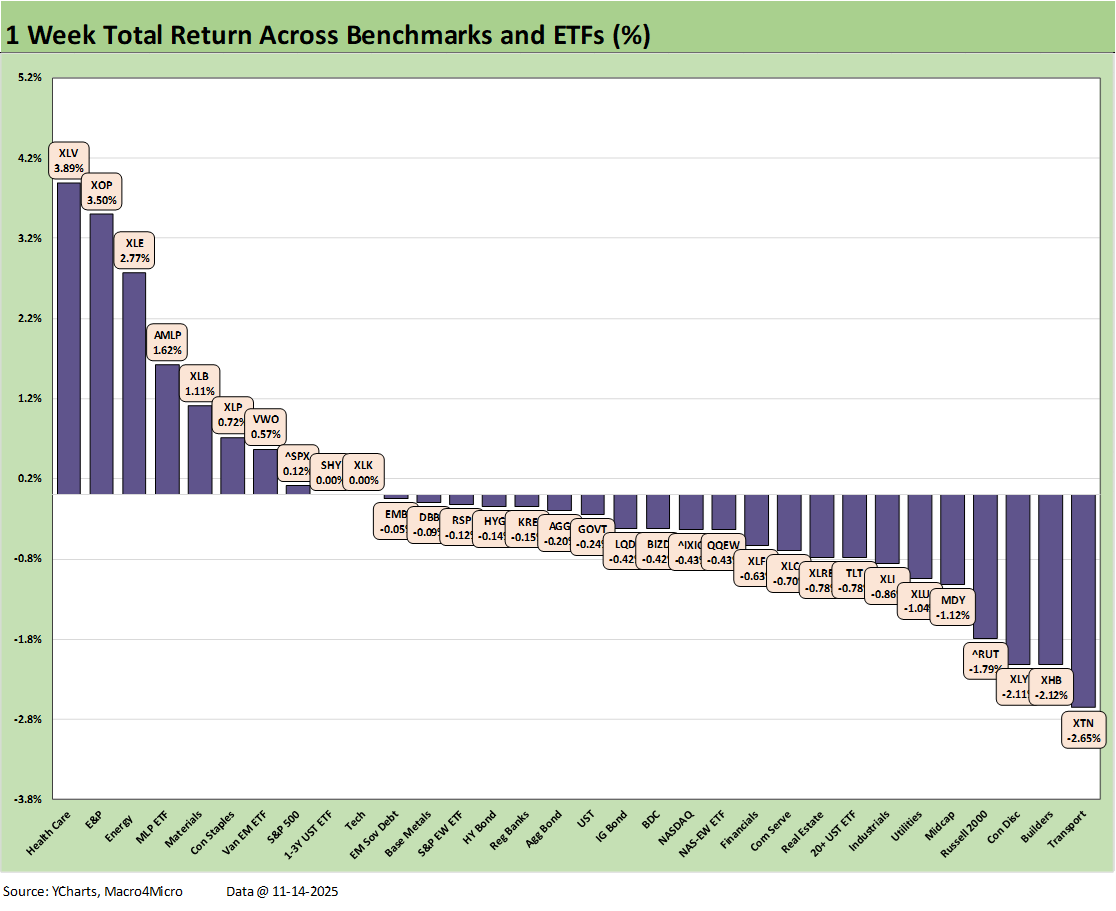
The above chart updates the 1-week returns for the group of 32 benchmarks and ETFs we track. The score weighed in at 8 positive, 22 negative, and 2 flat at zero. The pharma health care rally is evident in the #1 ranking for the Health Care ETF (XLV) with 3 energy related ETFs in the #2, #3, and #4 slots. Of the major benchmarks, only the S&P 500 broke into the top quartile at #8 at just over +0.1%. No tech-centric lines made it into the top quartile this week.
Over in the bottom quartile, we see some of the interest rate sensitive asset lines such as Homebuilders (XHB) and the long duration UST ETF (TLT) while the US-centric small cap Russell 2000 and Midcaps were also hit this week. Transports (XTN) were sitting on the bottom with lingering airline chaos and trade uncertainty still a challenge despite some exemptions announced later in the week by Trump.
We look forward to trade data finally getting back in action in coming weeks as the lag effects of tariffs keep working their way into the system. Those stats will feed into the distortion in headline 3Q25 GDP (see 2Q25 GDP Final Estimate: Big Upward Revision 9-25-25).
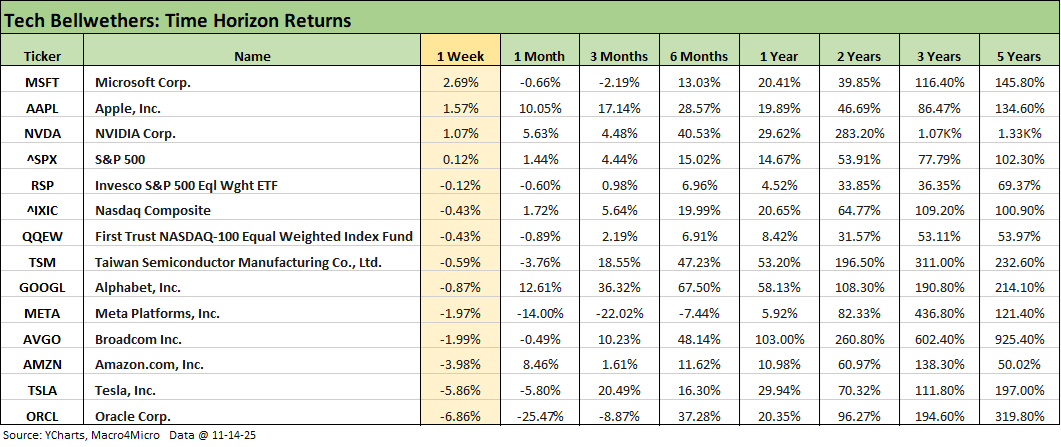
The tech bellwethers had another off week with 4 of the Mag 7 in the red and 3 positive. We see 7 of the “Mag 7+3” (includes Taiwan Semi, Broadcom, and Oracle) in the negative range. Also in the red was NASDAQ and Equal Weight NASDAQ 100 (QQEW).
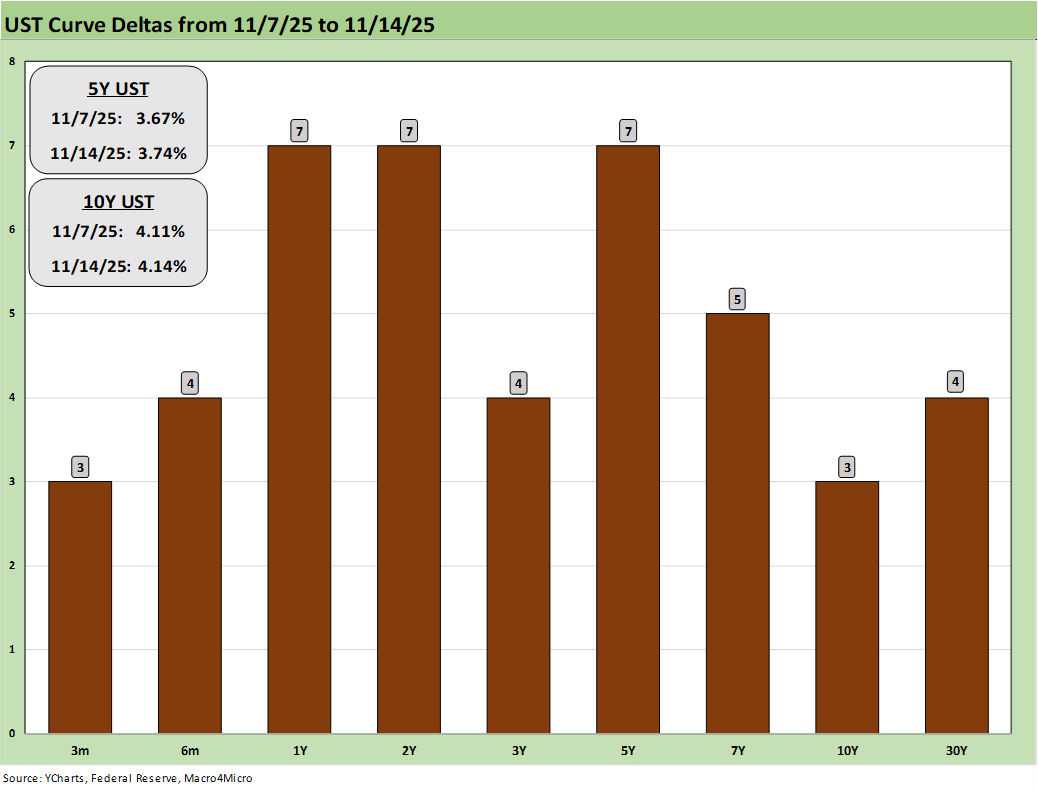
The above table details the trailing 1-week UST deltas. It was clearly a mediocre week for duration with a single digit shift higher across the curve. As detailed in an earlier chart, only the Short Duration (1Y to 3Y) ETF (SHY) managed a 0% return with the rest negative and the long duration UST ETF (TLT) in the bottom quartile.
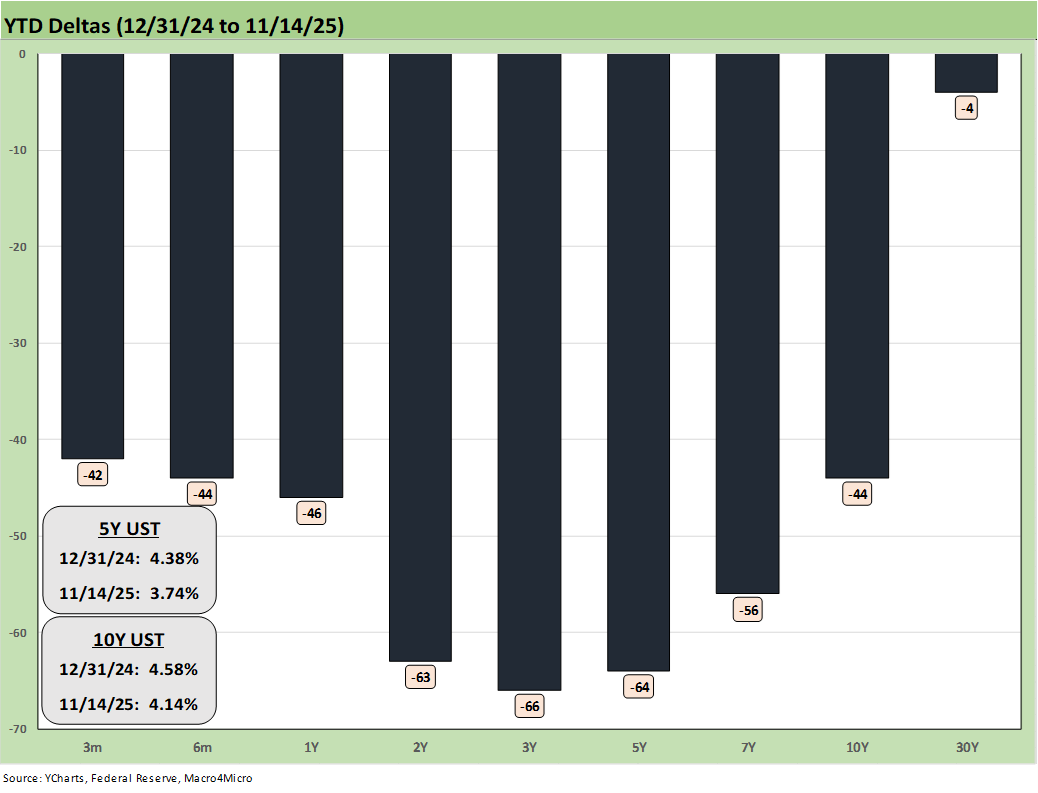
The above chart details the bull steepener across the YTD period of 2025 that has kept bond ETF total returns in positive range. The lagging moves in 30Y is part of a bigger challenge in the US with massive supply and record deficits ahead in the new world of Trump reliance on tariff revenue as his “go to” UST revenue plan.
The -4 bps move in the 30Y UST vs. -44 bps on the 10Y UST and -64 bps on the 5Y UST is a reminder of the uncertainty in a world where “everyone is a borrower, and someone needs to be a lender.” Whether the decline in rates can hold up remains a hot topic without a notably weaker macro backdrop or lower CPI.
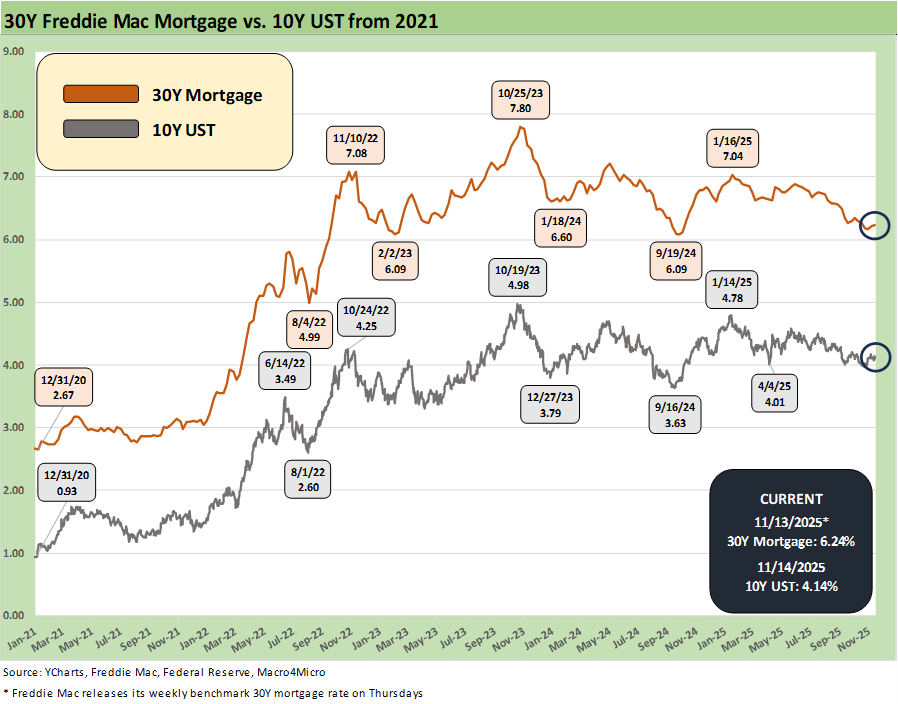
The above chart updates the 10Y UST and the Freddie Mac 30Y mortgage benchmark. The 10Y UST moved slightly higher on the week and the 30Y mortgage edged up by +2 bps. Freddie Mac is released on Thursdays around noon. The Friday close on the Mortgage News Daily was 6.38% using a different mix of mortgages.

The above chart updates the HY OAS time series with HY OAS -8 bps tighter on the week to +307 bps. That +307 bps is inside the Oct 2018 lows (+316 bps), inside the June 2014 lows (+335 bps) and slightly wide to the Dec 2021 tights (+301 bps).
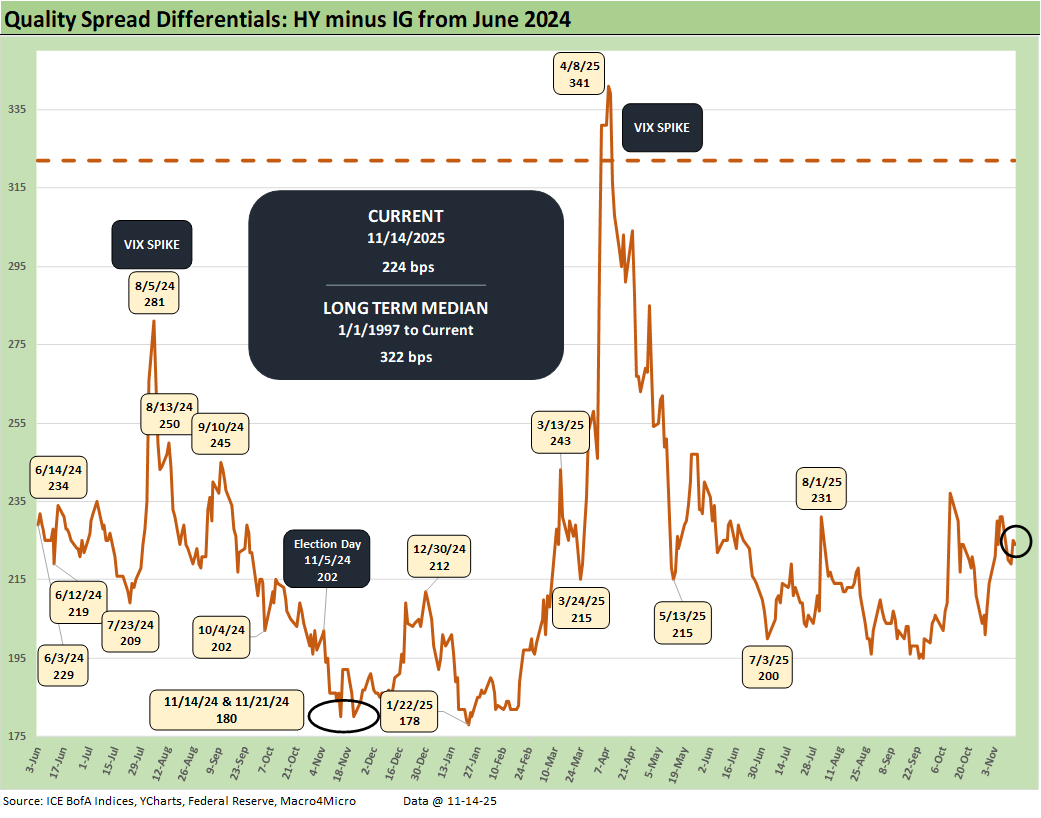
The above chart updates the “HY OAS minus IG OAS” quality spread differentials. This metric tightened by -7 bps from +231 bps with HY -8 bps tighter and IG -1 bps tighter.
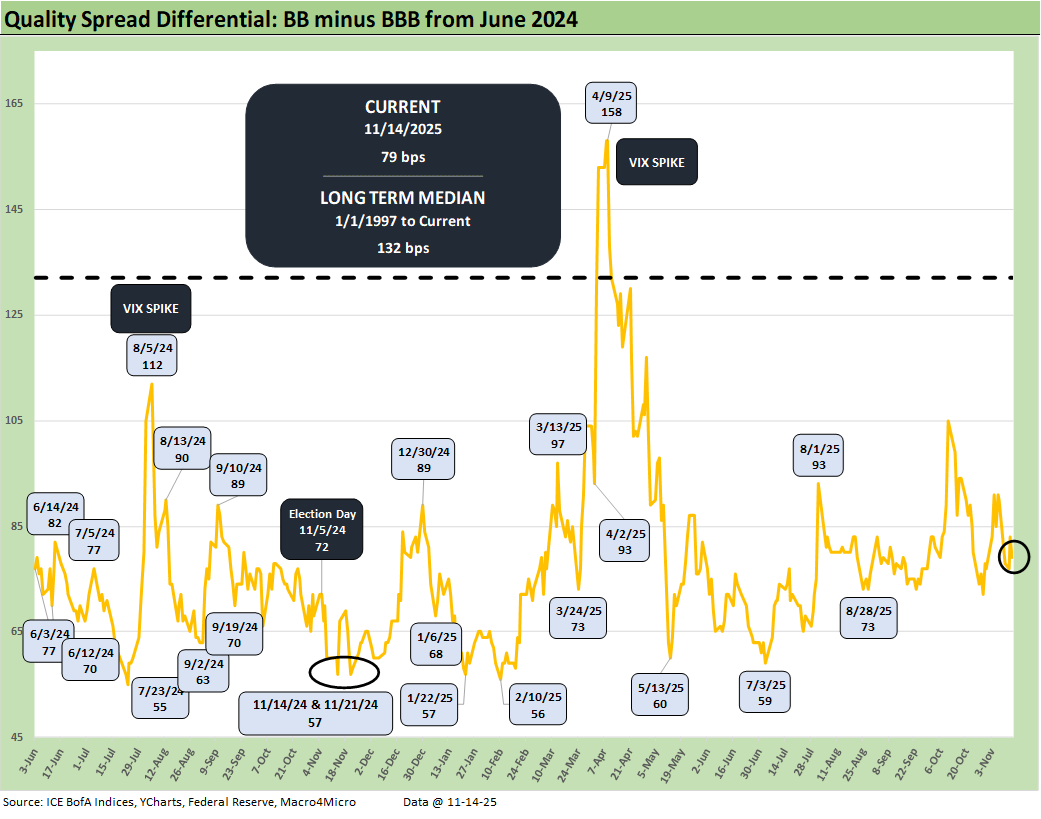
The above chart updates the BB OAS minus BBB OAS quality spread differential as it tightened by -11 bps this past week to +79 bps. The BB tier tightened by -11 bps with BBBs flat for a -11 bps quality spread compression.
See also:
Retail Gasoline Prices: Biblical Power to Control Global Commodities 11-13-25
Credit Markets: Budget Armistice or GOP Victory Day? 11-12-25
Simplifying the Affordability Question 11-11-25
The Curve: Back to the Future 11-9-25
Market Commetary: Asset Returns 11-9-25
Mini Market Lookback: All that Glitters… 11-8-25
Credit Markets: Little Shop of Worries 11-3-25
Mini Market Lookback: Not Quite Magnificent Week 11-1-25
Synchrony: Credit Card Bellwether 10-30-25
Credit Markets: Call Me After Trouble Arrives 10-27-25
Market Commentary: Asset Returns 10-26-25
Existing Home Sales Sept 2025: Staying in a Tight Range 10-26-25
Mini Market Lookback: Absence of Bad News Reigns 10-25-25
CPI September 2025: Headline Up, Core Down 10-24-25
General Motors Update: Same Ride, Smooth Enough 10-23-25
Credit Markets: The Conan the Barbarian Rule 10-20-25
Mini Market Lookback: Healthy Banks, Mixed Economy, Poor Governance 10-18-25
Mini Market Lookback: Event Risk Revisited 10-11-25
Credit Profile: General Motors and GM Financial 10-9-25
Mini Market Lookback: Chess? Checkers? Set the game table on fire? 10-4-25
JOLTS Aug 2025: Tough math when “total unemployed > job openings” 9-30-25
Mini Market Lookback: Market Compartmentalization, Political Chaos 9-27-25
PCE August 2025: Very Slow Fuse 9-26-25
Durable Goods Aug 2025: Core Demand Stays Steady 9-25-25
2Q25 GDP Final Estimate: Big Upward Revision 9-25-25
New Homes Sales Aug 2025: Surprise Bounce, Revisions Ahead? 9-25-25
Mini Market Lookback: Easy Street 9-20-25
Home Starts August 2025: Bad News for Starts 9-17-25
Industrial Production Aug 2025: Capacity Utilization 9-16-25
Retail Sales Aug 2025: Resilience with Fraying Edges 9-16-25
Mini Market Lookback: Ugly Week in America, Mild in Markets 9-13-25
CPI August 2025: Slow Burn or Fleeting Adjustment? 9-11-25
PPI Aug 2025: For my next trick… 9-10-25
Mini Market Lookback: Job Trends Worst Since COVID 9-6-25