
Mini Market Lookback: Market Compartmentalization, Political Chaos 9-27-25
With a shutdown pending ahead of payroll, economic data could get scarce and trend comparability impaired. Motives vary.

Welcome to Washington…
A week of strange moments from Kimmel to the UN (demand to investigate escalators, teleprompters, etc.) to the threat of an imminent government shutdown (and potential loss of economic data releases for a while) does not change the need to focus on the blocking and tackling (PCE, income and outlays, final 2Q25 GDP numbers, post-FOMC “speechifying,” housing sector news flow, etc.) with 3Q25 earnings season also dead ahead.
The ability of the market to compartmentalize the policy chaos (notably in tariffs, budget management, health care) from the fundamental analysis of the consumer and industry is a case study in downplaying the virus and assuming a cure is coming.
The week saw setbacks in equities as well as debt with the 32 benchmarks and ETFs posting up a score of 11-21. The 4 big indexes (S&P 500, NASDAQ, Dow, and Russell 2000) posted a negative return week and were joined by Midcaps. The 11 S&P 500 sectors posted a score of 6 negative and 5 positive.
The ETF bond mix we track shows 6 of 7 in the red with only the EM Sovereign bond ETF (EMB) slightly positive. Oil prices popped higher during the week and sent E&P (XOP) to #1 and the broad Energy ETF (XLE) right behind it at #2 and Midstream Energy (AMLP) at #4.
An adverse shift in the UST curve hit the short-to-intermediate harder as doubts are rising on the potential for more aggressive easing. The Fed talking heads are out in force making speeches and talking up a storm like they just got out of solitary. Stephen Miran broke free first from what we see with his endorsement of hyper easing strategy. He is broadly perceived as Trump’s mouthpiece, but beyond that credibility limitation is his resume and length of stays (i.e. brief) at various institutions (including a right wing think tank). That is similar to the thin resume of the pending new head of the BLS. These are very big jobs for very inexperienced people.
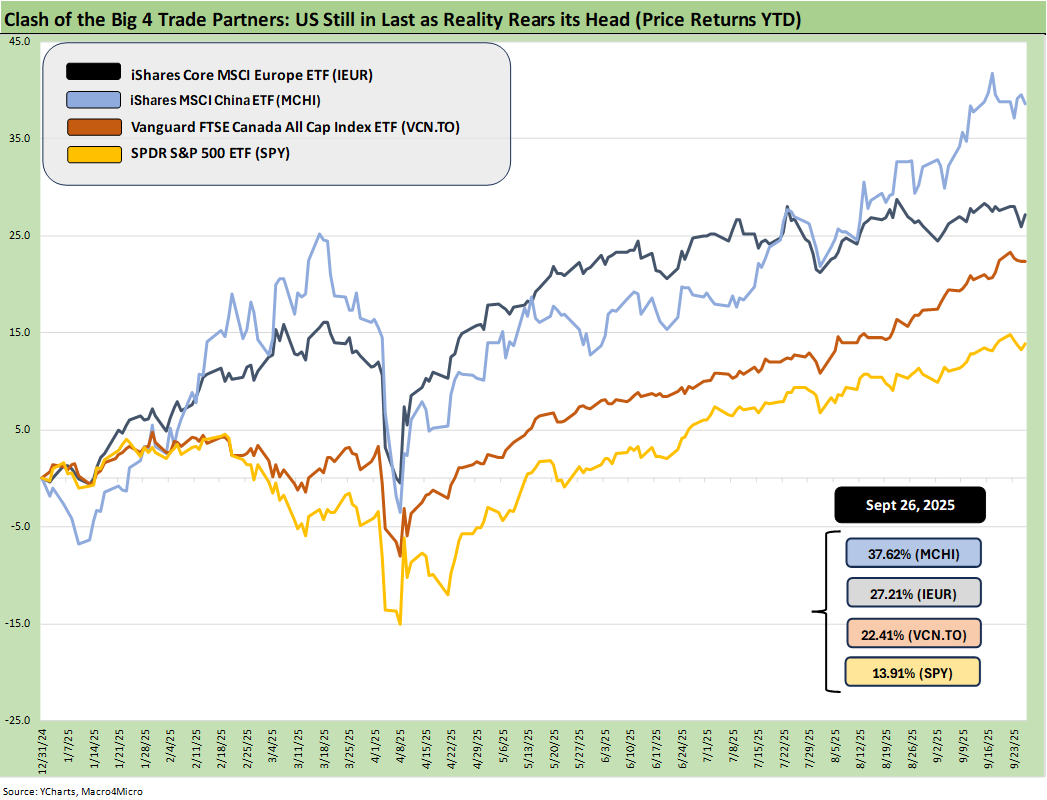
The above updates the YTD returns for some bellwether index ETFs for the Big 4 developed market trading partners – the US, Europe, China, and Canada. The aim of the chart is to plot some ETFs that tell a story for US investors thinking about global diversification. These ETFs are just a useful sample that uses relevant broad market indexes for each region as snapshots.
The chart above shows the US remaining in last place with the dollar the main culprit. That is not much for bragging rights at a time when many global investors and national leadership ranks are already quite annoyed (euphemism) with the direction of US policy. Whether that will flow into UST appetites of offshore investors is a wildcard. Alternatively, amped up hedging and lower rates could keep that pressure on the dollar. The lower rates were questioned this week, and the dollar firmed up. There are many more tariffs coming ahead and the chance of a trading partner retaliating could increase. So far that event risk has not been triggered. That could change.
The goal of this chart is to capture the balance of risks across the broad mix of macro trends (economy, currency) and the sea level industry and company fundamentals rolled up into a US traded ETF. For the US, we just used the S&P 500 ETF (SPY). That index is in last among the 4 above.
The headlines have been blaring for some time that the USD us turning in its worst run since the 1970s, and that by itself can alter risk appetites for US dollar assets or create the risk elements of “to hedge or not to hedge.” The weak dollar has been a major factor in poor returns above, and we have seen a growing level of street research highlighting the massive growth in investors hedging the dollar when buying US assets.
The above chart highlights that hedging has been a good strategy with US stocks doing well but the dollar performing horribly. This past week saw the dollar index improve with the skepticism around material easing taking some heat with the usual array of post-FOMC commentary.
Political instability in the US getting worse…
The political climate is heading in a bad direction with the recent White House memo on domestic terrorism targeting the left but not the right (the Jan 6 demolition derby are still the patriots). The memo is vague enough to cover any opposition to Trump by any liberal organization. We assume ICE protests are high on the priority list.
Trump had a bad week on the freedom of speech topic. He missed the concept on why it was “Article 1” for a good reason in the constitution. Kimmel did a reversal and takedown as he wrestled the high road from Trump and the right-wing media operators who boycotted are back on.
With Russell Vought (head of OMB and primary Project 2025 architect) threatening mass Federal layoffs in a shutdown event (as opposed to the mass Federal layoffs pursued without a shutdown or Congressional approval), the division and acrimony is going steroidal. Meanwhile, Mike Johnson has been stalling on the swearing in of the new Democrat House Rep from Arizona (Adelita Grijalva, 7th Congressional District in AZ) to prevent her from voting on the Epstein file release. That delay contrasts with the recent GOP House rep swearing in, which was almost immediate. Basically, Washington is getting very “Europe 1920s” at this point.
The underlying cause of the dollar posting one of the worst selloffs in decades is a can of worms we have looked at in the past. We often see a lack of faith in US political stability and quality of governance as part of it. That image of instability is only getting worse, and the UN speech was not exactly a charm offensive with international investors. The coming days could bring a government shutdown with its multiplier effects on payrolls, consumption outlays, and disruptions across a wide range of services and good sectors.
The reality of a low single A tier or BBB tier quality sovereign balance sheet shown by the US does not help. The UST gets a lot of subjective support for its credit ratings based on the size of the economy and depth and liquidity of the UST market. That said, the sovereign leverage metrics and a dependence on record UST demand in the face of massive projected deficits is not much of an enhancer for UST risk appetites with a major shutdown pending. A rating agency that dared to take the UST ratings lower would see the wrath of Trump.
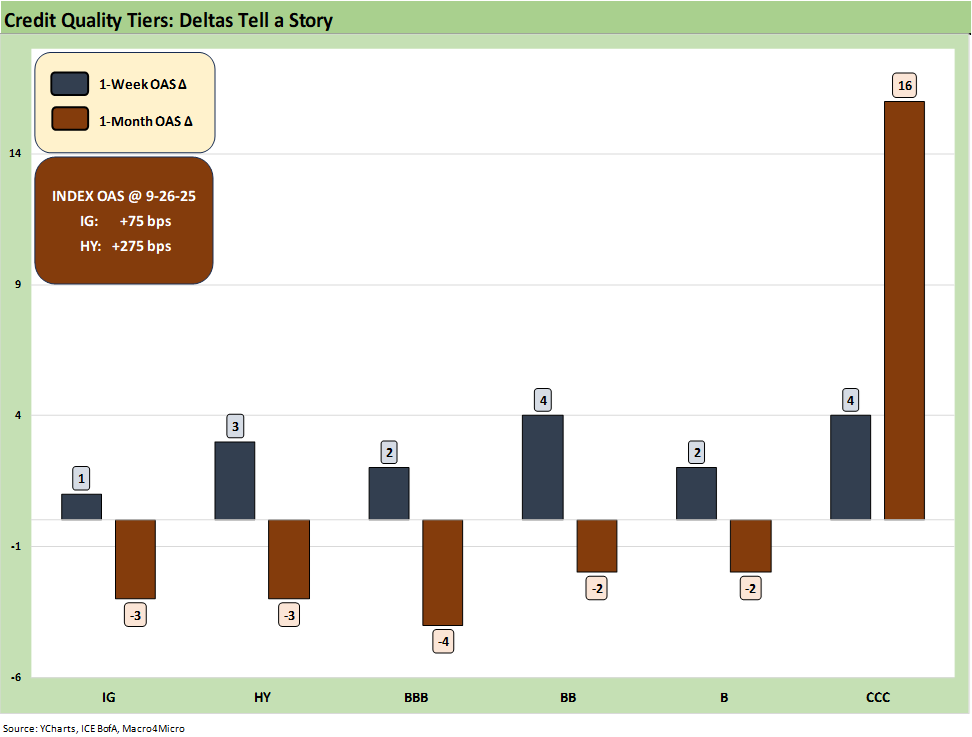
The above chart frames the 1-week and 1-month spread deltas for IG and HY and the BBB tier and below. The +75 bps in IG and +275 bps in HY are in line with past credit cycle peaks with IG more in line with 1997 and HY consistent with the credit bubble of June 2007. Those were very small 1-week moves overall in IG and HY that offer another sign that the market is awaiting more material catalysts that signal major adverse fundamental shifts underway. For now, that is more bearish speculation than identifiable along the GDP lines (see 2Q25 GDP Final Estimate: Big Upward Revision 9-25-25).
Even the noise late in the week about more tariffs on the way (branded patented pharma at 100%, commercial vehicles in medium/ heavy duty trucks at 25%, upholstered furniture at 30% and kitchen cabinets at 50%.) did not bring much of a reaction. The pharma tariff requires a shovel in the ground in the US to build capacity here in order to get a waiver. Rising pharma costs would be a major setback for many households.
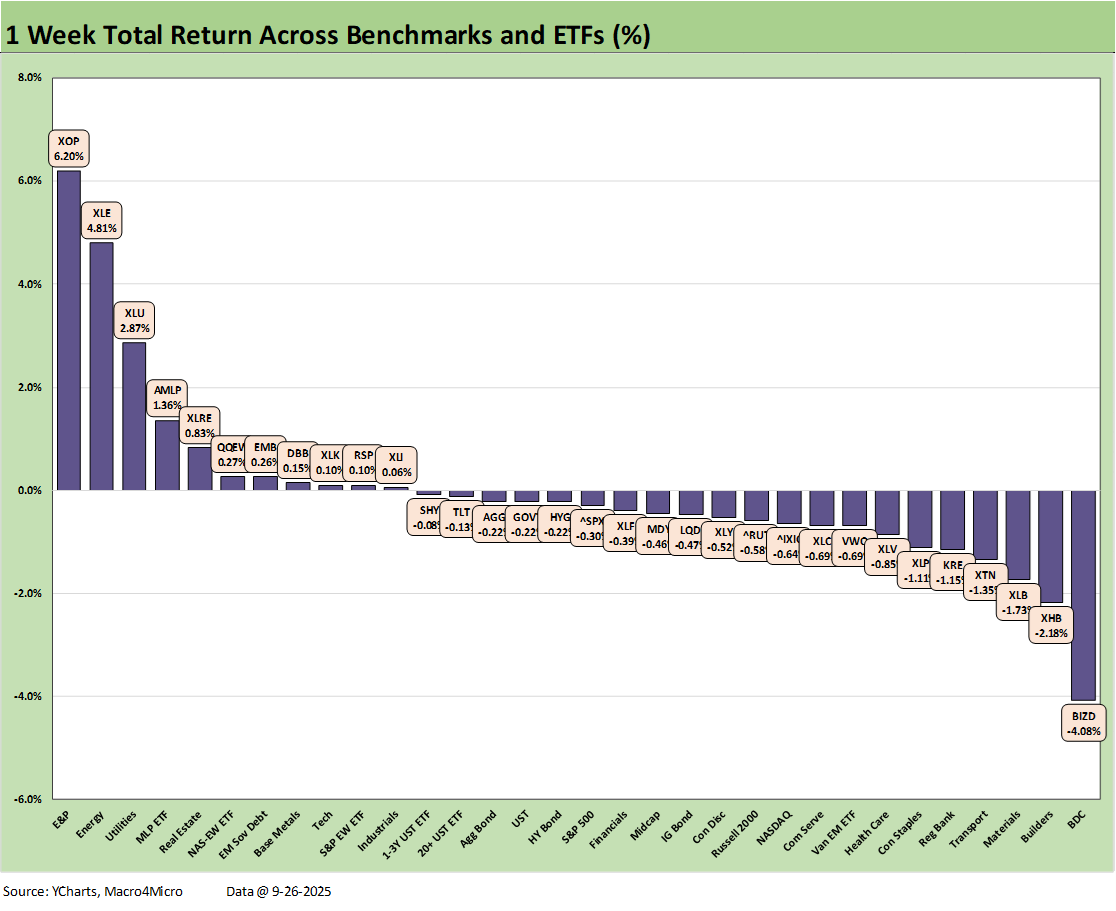
The above chart posts the trailing 1-week returns across the 32 benchmarks and ETFs we watch. The score of 11-21 for positive vs. negative marks a reversal from recent weeks. We see energy ETFs leading the ranks in the top quartile with XOP and XLE stronger on oil prices this week from a $62 handle per bbl (WTI) to just under $66 ($65.72) on Friday. Utilities (XLU) weighed in at #3 with Midstream Energy (AMLP) at #4.
Sitting on the bottom is private credit heavy BDC ETF (BIZD) with some recent headlines battering auto credit exposure and some skepticism around more lurking problems not easily tracked in the equity markets. The “What’s under the hood?” anxiety is picking up in BDCs.
Bonds struggled this past week. As we detail in other charts below and in our weekly yield curve comments, the FOMC action did not see UST curve relief in the 10Y while mortgages have been erratic of late. The 30Y mortgage rate had rallied to a 6.1% handle the past month but ended this past week with a fresh rise to 6.38% Friday in the Mortgage News Daily Survey.
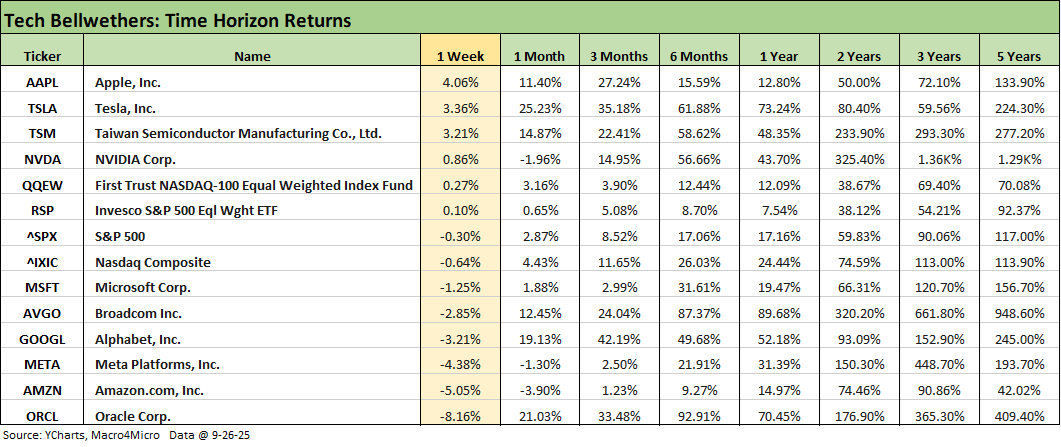
The above table updates the tech bellwethers in descending order of weekly returns. The news was generally on the negative side. We see only 3 of the Mag 7 in positive range with 4 of Mag 7, Broadcom, and Oracle in the red. ORCL took a notable beating this week at -8.16% after its dazzling post-earnings climb. ORCL is still +21% for the 1-month, +33.5% for 3 months and +92.9% for 6 months.
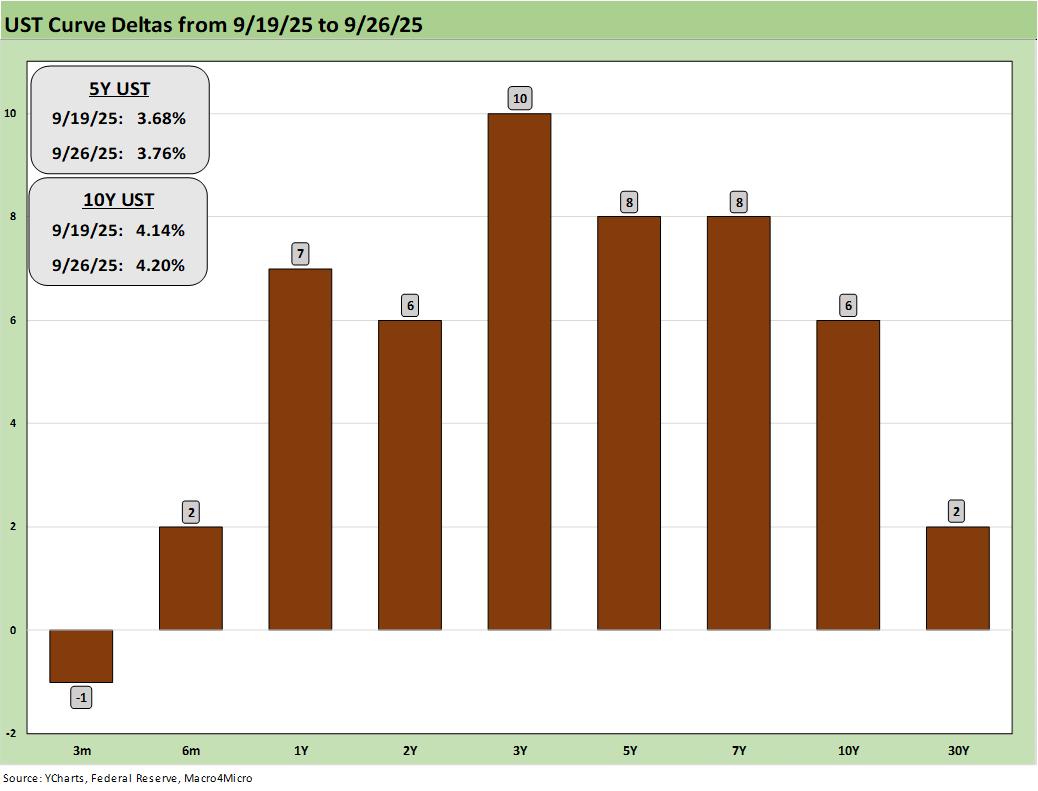
The above chart updates the 1-week UST deltas for the UST curve as the post-FOMC commentary has seen some backpedaling on confidence in the aggressive easing scenario (see The Curve: FOMC Takes the Slow Road 9-21-25). While headline PCE inflation and Core PCE inflation are not troublingly high, the trend is going in the wrong direction and PCE levels remain well above target. There was also ample evidence of inflation in Goods with Services as stubborn as ever in the mid-3% range (see PCE August 2025: Very Slow Fuse 9-26-25).
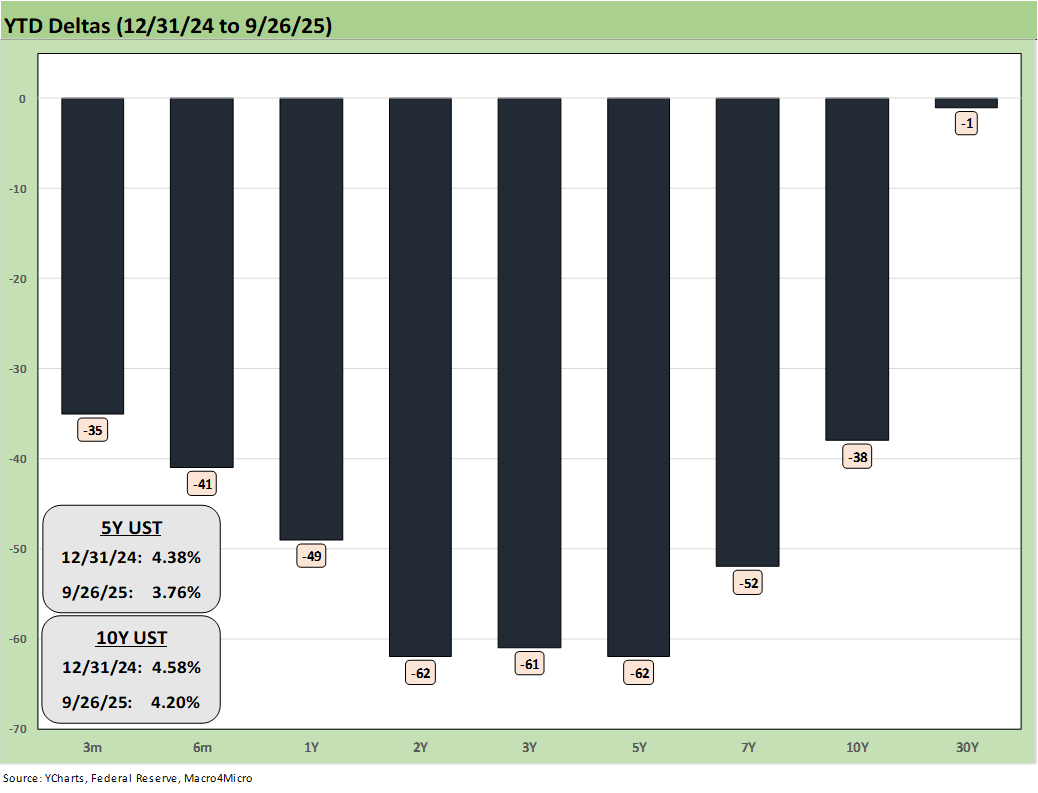
The recent setbacks in the US market since mid-Sept and then following the FOMC meeting and a rapid array of post-easing speeches have not changed the favorable YTD bull steepener.
The long bond is still struggling to join the party, and the wide array of tariffs rolling in will make it tough to keep PCE inflation below the 3% line as the working capital cycles turn over and more tariffs roll in. Food inflation has been climbing along with Goods and oil just offered the market a reminder this week that oil prices can in fact rise. Energy is always the headline wildcard across the economic cycles. Rising oil would undermine the headline PCE and CPI support it provides.
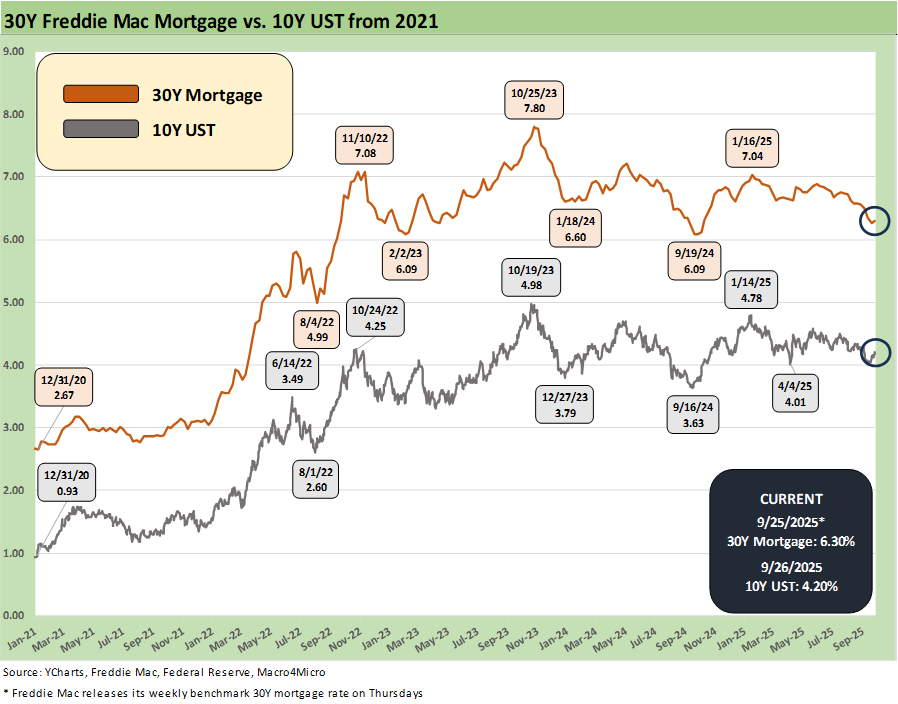
The above chart updates the time series for the Freddie 30Y Mortgage and the 10Y UST since early 2021 when ZIRP ruled and then across 2022 after the tightening cycle started in March 2022. This recent month saw the 10Y UST down into a 4.0% handle just before mid-month and is now back to 4.2%. That comes after the FOMC decisions and related story lines evolving from that action. Since the easing move, there has been no shortage of noise from the Fed leaders on the need for caution.
Trump briefly quieted down on his demand for -300 bps of easing (Is he down to 275 bps now?). With so little agreement with Trump from the dot plot and relative institutional cohesion shown at the Fed, the blame game on Powell now rings hollow and weak.
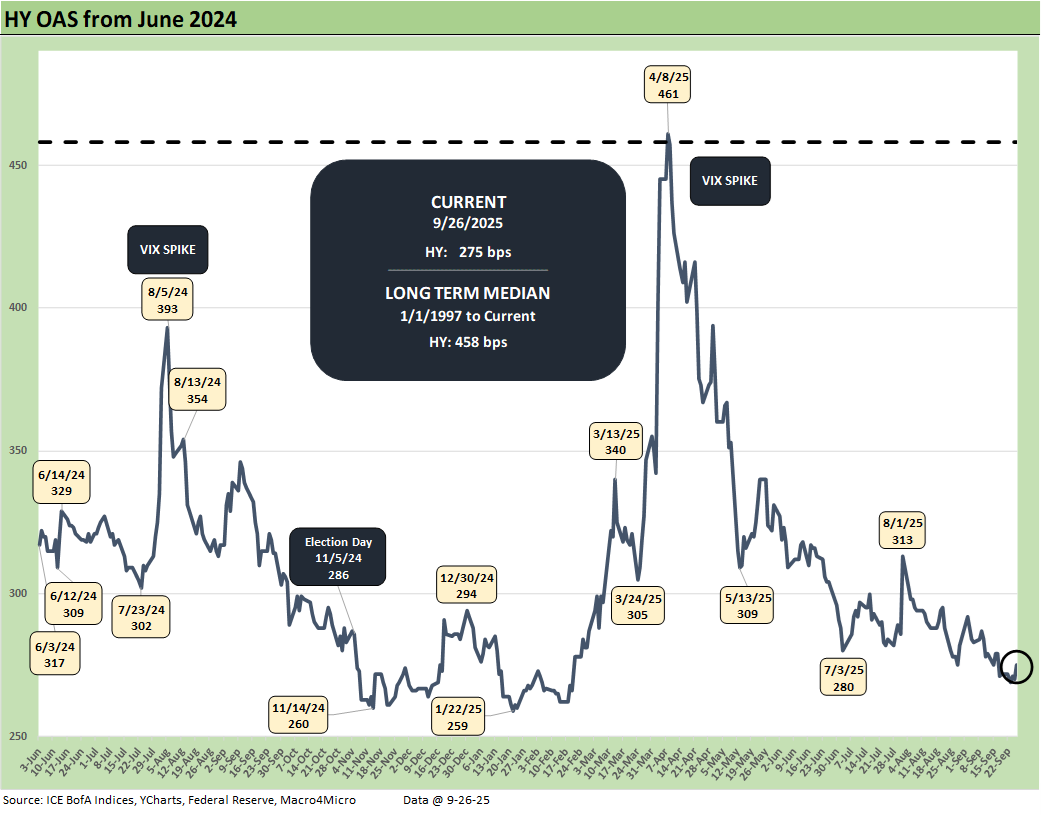
The above chart plots the HY OAS from June 2024, and we see a +3 bps move wider on the week to +275 bps from +272 bps last week. That HY index OAS is still in the bubble zone of June 2007.
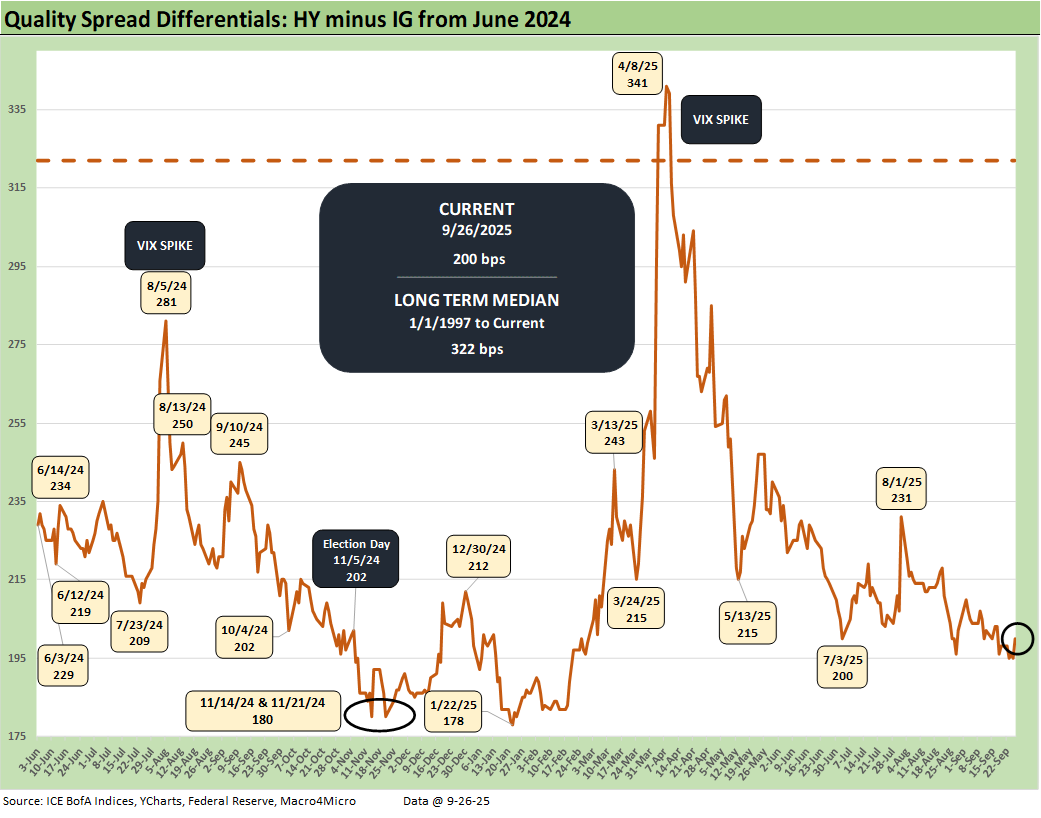
The above chart updates the quality spread differentials for HY vs. IG with “HY OAS minus IG OAS” +2 bps higher on the week to +200 bps from +198 bps with HY +3 bps wider and IG +1 bps higher.
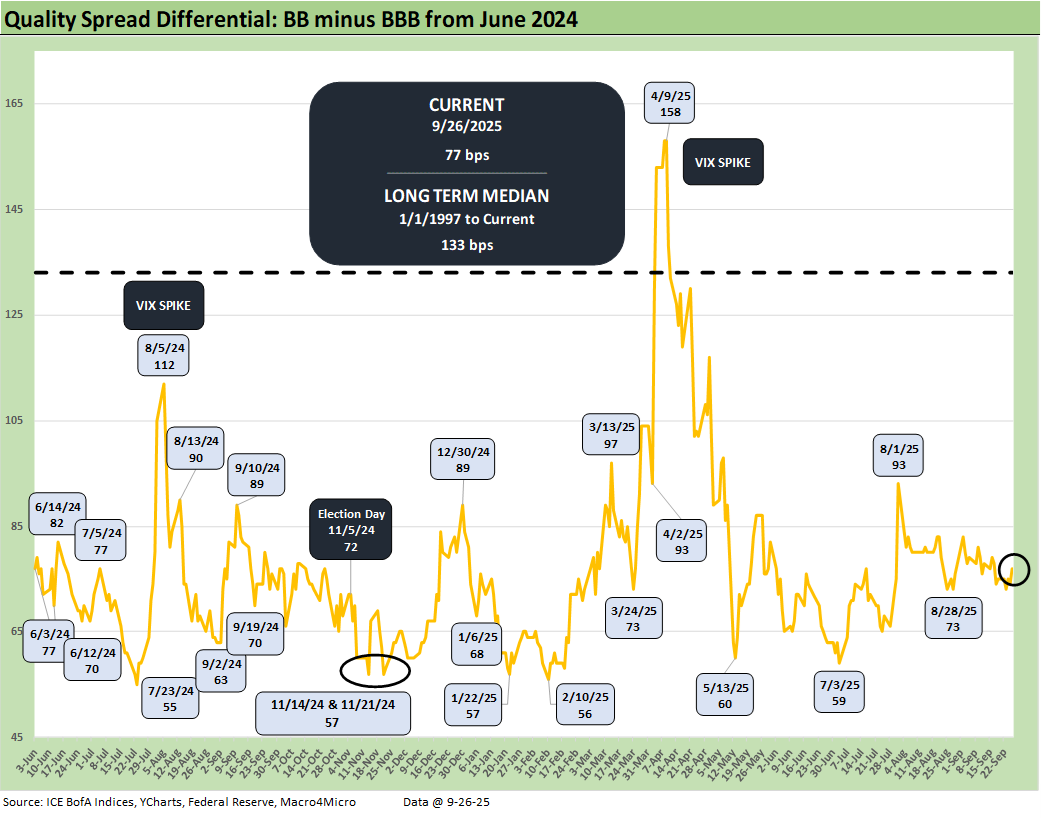
The above chart shows the “BB OAS minus BBB OAS” quality spread differential, which widened by +2 bps to +77 bps over the week with the BB tier +4 bps wider and the BBB tier +2 bps tighter. The BBB vs. BB OAS differential remains wide to the early July level around +59 bps and +56 bps in Feb 2025.
See also:
PCE August 2025: Very Slow Fuse 9-26-25
Durable Goods Aug 2025: Core Demand Stays Steady 9-25-25
2Q25 GDP Final Estimate: Big Upward Revision 9-25-25
New Homes Sales Aug 2025: Surprise Bounce, Revisions Ahead? 9-25-25
Credit Markets: IG Spreads Back in the Clinton Zone 9-22-25
The Curve: FOMC Takes the Slow Road 9-21-25
Market Commentary: Asset Returns 9-21-25
Mini Market Lookback: Easy Street 9-20-25
FOMC: Curve Scenarios Take Wing, Steepen for Now 9-17-25
Home Starts August 2025: Bad News for Starts 9-17-25
Industrial Production Aug 2025: Capacity Utilization 9-16-25
Retail Sales Aug 2025: Resilience with Fraying Edges 9-16-25
Credit Markets: Quality Spread Compression Continues 9-14-25
The Curve: FOMC Balancing Act 9-14-25
Footnotes & Flashbacks: Asset Returns 9-14-25
Mini Market Lookback: Ugly Week in America, Mild in Markets 9-13-25
CPI August 2025: Slow Burn or Fleeting Adjustment? 9-11-25
PPI Aug 2025: For my next trick… 9-10-25
Mini Market Lookback: Job Trends Worst Since COVID 9-6-25
Payrolls Aug 2025: Into the Weeds 9-5-25
Employment August 2025: Payroll Flight 9-5-25
JOLTS July 2025: Job Market Softening, Not Retrenching 9-3-25
Hertz Update: Viable Balance Sheet a Long Way Off 9-3-25
Mini Market Lookback: Tariffs Back on Front Burner 8-30-25