
General Motors Update: Same Ride, Smooth Enough
We update the recent GM stats after a relatively strong 3Q25 performance in the face of tariffs.

Rugged competition, but GM showing stronger ICE prospects.
The GM 3Q25 numbers were solid, beat expectations, and sent the stock spiraling notably higher (closed just below +15% on earnings day). FY 2025 guidance was raised for auto adjusted EBIT, automotive operating cash flow, and automotive free cash flow in what is good news overall for the stability of GM credit quality. Capex was guided to the lower end of the $10 bn to $11 bn range.
Margins remain under pressure as covered in an earlier credit profile on GM (see Credit Profile: General Motors and GM Financial 10-9-25). Total GMNA segment margins declined to 6.2% in 3Q25 (9% if adjusted for tariff costs) from 9.7% in 3Q24. Margins were slightly higher sequentially from 6.1% in 2Q25.
Tariff cost impacts were modestly lowered in the guidance to $3.5 to $5.0 bn on the recently announced rebate system (“MSRP offset program”) that would ease imported supplier chain impacts for US produced vehicles. GM cited the revised tariff cost change in its 10Q as a “material positive benefit” that would become evident in 4Q25.
GM Financial (“GMF”) earnings rose YoY 3Q25 on moderate revenue growth, higher earnings assets, stable charge-offs and delinquencies. The 3Q25 provisions declined YoY but were up the 9M YTD period YoY. The allowance provision on the balance sheet of +3.5% was well in excess of the net annualized charge-off rate in 3Q25 of 1.2% (flat YoY) and the annualized rate for the 9 months ended 3Q25.
GM international ex-China was stable at 4.0% margins with a strong performance in the Middle East cited. The China JV performance stabilized with the JV revenue flat sequentially after a tough 2024 also brought some ugly impairments. GM gained market share in China but saw share shrink in South America (notably Brazil).
GMNA is still the main event at 71% of segment EBIT in 3Q25 with GM Financial another 23% of segment EBIT. GM picked up market share in the US and in North America with ICE market share levels at 17.4%, or the best 3Q market share performance since 2017. Total US market share of 17.0% was up +0.5% in 3Q25 vs. 3Q24.
Automotive liquidity was essentially flat at $21.8 bn in cash and marketable securities ($35.7 bn in liquidity including available lines) vs. auto debt of $16.1 bn. Automotive free cash flow offered midrange guidance of $10.5 bn for FY 2025 that offers plenty of comfort. Recurring steady upstreaming of dividends from GM Financial also supports parent credit quality.
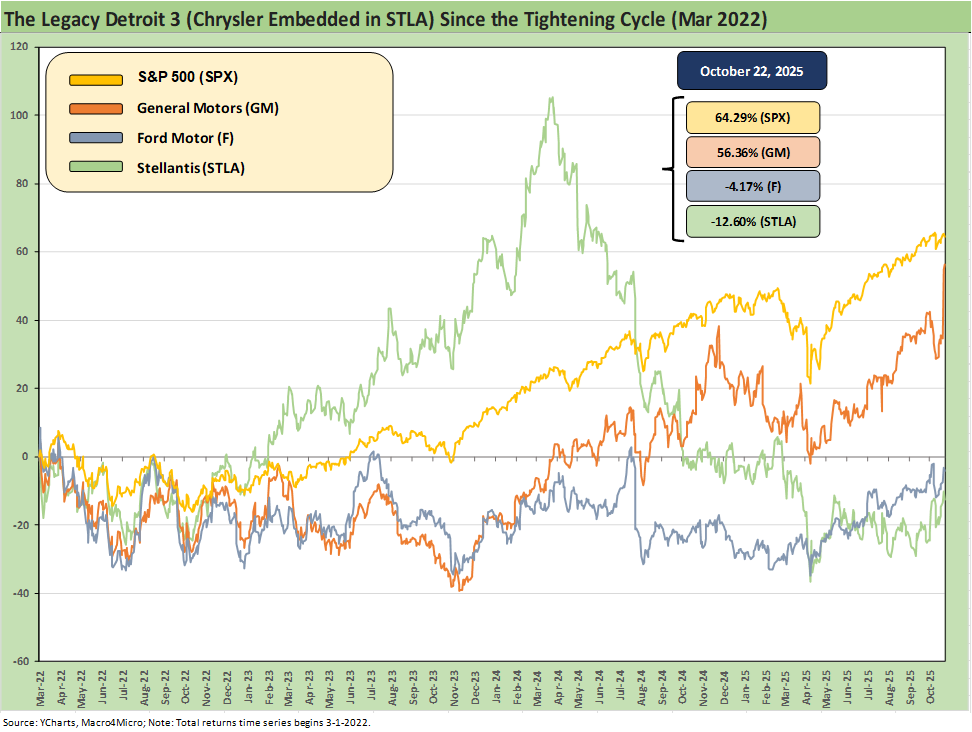
The above time series frames the stock performance of the legacy Detroit 3 (Chrysler now rolled up into Stellantis along with PSA and Fiat) along with the S&P 500. The relative performance offers a snapshot of how resilient GM has proven to be relative to Ford (F) and Stellantis (STLA) despite all the cyclical anxieties, consumer confidence beat-downs, and most importantly the worries around tariffs and related costs. The autos have clearly underperformed, but GM is in a very good place with its market leading ICE mix and leadership in numerous profitable product segments.
As a reminder, based on 9-month YTD 3Q25 sales in the US, GM is #1 in the US by sales with Toyota #2, Ford #3, Hyundai/Kia #4, Honda #5 and Stellantis #6 ahead of Nissan at #7. Those market shares will continue to shake out in 2026 as import tariffs impact pricing and relative costs coming across customs. Moving parts include the tariffs and currency impact for OEM imports and supplier chain cost variances and how that all rolls up under constantly shifting tariff rules.
The fears have been picked over around GM’s exposure to Mexico model volumes coming across the border and how that Mexico OEM production share will play out. GM’s shift in production footprint is set against Ford’s role as the leading producer of US-based light vehicles. GM’s role as the #1 manufacturer of vehicles will steadily shift toward US-based capacity. That has been playing well in Washington, and GM has curried plenty of favor with its recent actions on production realignment. The news on tariff easing by Trump offers a bridge to cushion GM as it pursues its US capex and capacity shift strategy.
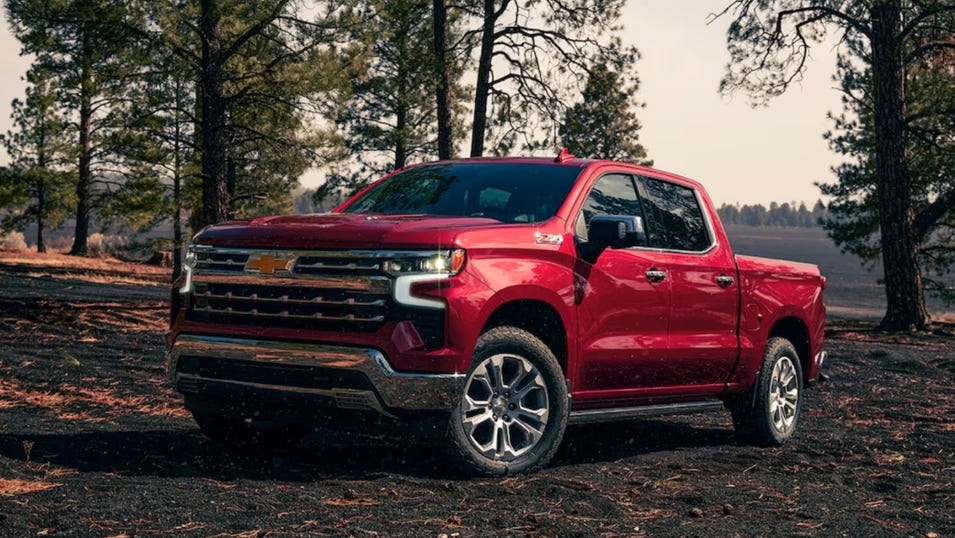
The interesting part of the GM story is that the company is in the sweet spot of the most popular ICE products and now will see those product volumes “higher for longer” and play to the strengths of GM in light trucks – notably full-size pickups and SUVs that they lead. GM presents a healthy product mix plan ahead to close out the decade as we covered in the credit profile commentary.
GM also has some pyrrhic bragging rights in achieving the #2 ranking in EV share with a product “barbell” strategy (Cadillac in luxury plus a range of other products) that resonated with the markets. The result saw GM at #2 in EVs behind Tesla. GM just announced more charges for the inevitable additional downsizing actions and impairments after the 3Q25 peak for EVs ahead of the expiration of tax credits. EVs are loss generators, and GM has been very open about the uncertainty that lies ahead around what the natural demand levels are along select EV product segments and at what price levels.
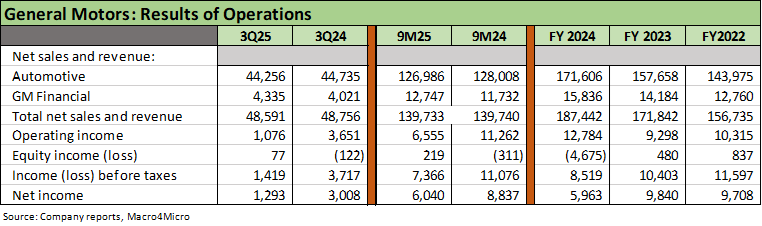
The 3Q25 operating results are broken out above and were solid on multiple fronts. That comes with the qualification that GMNA EBIT (discussed below) is lower and margins are also compressed. Margins were pressured by the material tariff expense that undermines the profitability of the dominant North American segment and more narrowly the US operations. The average transaction price of more than $51K makes a statement on GM’s favorable mix as well as the challenges of affordability, and that is where GM Financial operations play an important role as a catalyst for sales volumes, customer retention, and dealer effectiveness.
We already discusses the tariff drag in an earlier detailed Credit Profile on GM (see Credit Profile: General Motors and GM Financial 10-9-25). GM management discussed the benefits on the recent action by Team Trump to mitigate the tariff costs tied to imported supplier chain components used in vehicles assembled in the US. Material costs (steel, aluminum) present a challenge, and the direction of the USMCA and EU trade discussions will play an important role there.
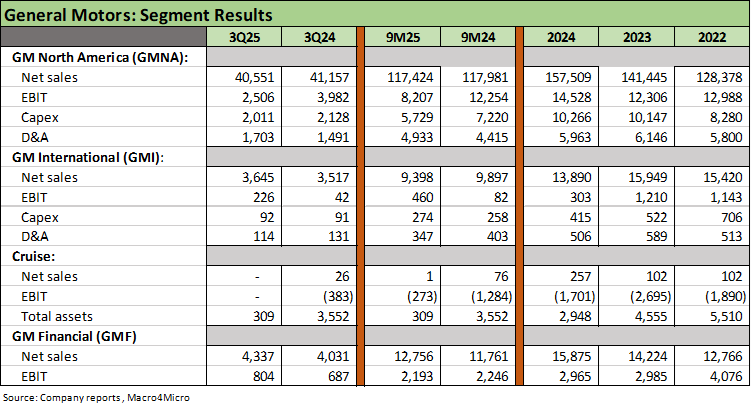
The above table breaks out some key segment data with the main focal points being GMNA and GMF. The evolution of GM’s geographic footprint and post-bankruptcy strategic and operational overhaul make for a less complex story with the exit from Europe and reduced exposure to captive supplier operations (the jaded history of Delphi, etc.). The Cruise segment has been folded into GMNA while GM International includes a mix of operations outside North America (e.g. Brazil) as well as the China JVs.
That downsizing of non-US operations is likely to continue with the Mexico and Canada challenge that will get more focus ahead with the scheduled USMCA “review.” The potential for the entire deal to be terminated cannot be dismissed as a worry for those with existing North American supplier chains and notably low-cost Mexican Tier 1, 2, and 3 sourcing.
Below we recap a few segment highlights:
GMNA: GMNA is the anchor of the GM equity and credit profile with GMF essentially an extension of the OEM operations with financing for the extended independent dealer network and retail and fleet customers. Total US market share of 17.0% for 3Q25 is up from 16.5% in 3Q25 while the North American share of 16.1% in 3Q25 is up from 15.8% in 3Q24. The 9-month YTD volumes at GMNA rose by +4%. Major success stories for the quarter included full size pickups and the best 3Q period sales for the Equinox and Traverse since 2019.
3Q25 adjusted EBIT margins ticked up sequentially to 6.2% from 6.1% but were down substantially from 9.7% in 3Q24. The tariff pressures have undermined profitability and margins, but GM has a stated goal of returning GMNA to the 8% to 10% adjusted EBIT range. That would require some combination of pricing improvement, cost structure “leaning”, and favorable model mix trends (e.g. less unprofitable EV exposure). There are also efficiency unit cost improvements using AI, and increased revenues from high-margin, technology-based products (OnStar, Super Cruise, etc.) that GM has discussed on earnings calls and at conferences (including this week).
GM Financial: GMF is an operation we would easily place as a more important operation relative to the total GM story vs. GM International. GMF presents low operating risk, is essential to driving sales volume, and is a major source of profitability and upstreamed dividend cash flow. Loss reserves are more than adequate, and charge-offs are quite low as noted above in the bullets.
GM International: GMI gets discussed as a segment on an ex-China basis as well as including the China JVs. Before the credit crisis, the “magic” of China as a core GM strength and growth market allowed equity analysts touting GM stock to come up with some very aggressive sum-of-the-parts values to beef up stock price targets. That idea that the China unit could get valued at multiples dramatically above the consolidated parent took a beating in the GM Chapter 11. We had argued that the “sovereign ceiling” rule applied as equity analysts tried to wheel that out again for the post-bankruptcy IPO.
For 3Q25, GMI ex-China saw net revenue tick up to $3.6 bn from $3.5 bn in 3Q24 and rise sequentially from $3.3 bn in 2Q25. Adjusted EBIT margins at GMI ex-China were 4.0%, just down slightly from 2Q25 at 4.1% and down more from 5.1% in 3Q24. The Middle East was cited as the main driver on demand for full size trucks and SUVs. China JV revenues were flat sequentially at $6.1 bn but up materially from $4.5 bn in 3Q24. Net income margins were only 2.3% in China JVs for 3Q25 but better than the negative margins in 3Q24 of -6.3%. Equity income from China JV’s was $197 million for the 9M ended 3Q25 vs a loss of -$347 million for 9M 3Q24.
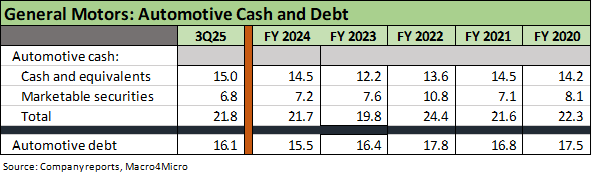
The above table is the easiest set of numbers to frame the healthy balance sheet liquidity vs. debt in the automotive operations. When taken in tandem with the free cash flow guidance and rising volumes in 2025, the credit stability is an easy case to make with such a liquid balance sheet even without considering backup lines and the ability to issue debt at will.
The challenge for equity holders in GM is not credit worries at GM but the recurring cyclical question marks that surround the consumer sector, payroll trends, and the affordability confidence X factors that can speed up replacement cycles in new cars (vs. used) or moving up the price tiers in product selection when the average transaction price now lives in the realm over $51K.
GM Financial (“GMF”) was addressed in detail in our earlier GM credit profile along with the legacy liability topic (Pension, OPEB). As we detail below, the steady stream of dividends from the captive finance unit is a positive variable in the financial story that goes hand in hand with GMF’s critical strategic value with dealers and customers.
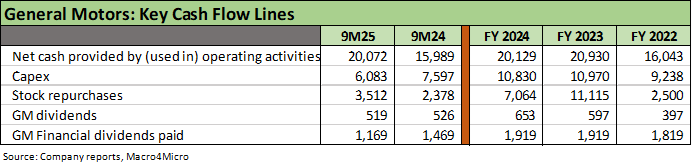
The above table highlights the steady and aggressive capex program that will include efforts to redeploy GM’s manufacturing footprint to a heavier mix of US capacity. For GM, that effort will by definition downsize Mexico and reconsider sourcing plans from Mexico, Canada, and Asia (South Korea, China).
Meanwhile, the stock buyback volume has ebbed and flowed and is up by over $1 bn YoY for the 9 months to $3.5 bn with another $1.5 bn in 3Q25. We saw the peak buyback rate in FY 2023 at $11.1 bn. The fully diluted share count is down by 15% YoY according to the CFO (Paul Jacobson) on the earnings call.
GM is on a steady financial and operating course and beating the peer group at this point. The bigger cyclical macro challenges still lurk, but GM is executing at the micro level.