
CPI September 2025: Headline Up, Core Down
The Sept CPI was relatively uneventful with some of the same lines showing inflation trends, but the overall action was muted.


Which one is the inflation target? (for PCE).
The last time we saw PCE in August the headline level was at +2.7% and core at 2.9%. The headline CPI for August was +2.9% and +3.1% core. The CPI for September had dueling 3% handles with headline CPI ticking higher to 3.0% and core ticking lower to 3.0%. In December 2024 (Biden’s last month in office), headline CPI was 2.9%, so the battle is a slow one to say the least. Trump gets no bragging rights in the 9-month CPI run.
Total Services CPI remains stubborn at 3.6% with Shelter at 3.6% with a CPI weighting in the overall index of over 35%. On a more measured note, the “All Items Less Shelter” CPI was only +2.7% or higher by +0.2%. That “All Items Less Shelter” CPI was only 1.9% in Dec 2024 in Biden’s last full month, so that is going in the wrong direction.
The post-tariff plan is to watch for outsized readings above 4% and to watch for sequential upticks in the rolling recent months. Notable headlines for “high readings” include Electricity at +5.1% YoY and Utility piped gas at +11.7%.
Total Food inflation at +3.1% (+2.7% for Food at Home, +3.7% for Food Away from Home) includes some highlight such as +5.2% on “Meats, poultry, fish and eggs” with the “Meats” category at +8.5%. The “beef and veal” subcategory posted +14.7%. Among other notable CPI readings were Apples at +5.3%, Bananas at +6.9%, and Canned Fruit and Vegetables at +5.0%.
For many of us, Coffee was the headliner at +18.9% YoY, which was driven heavily by global supply issues and Trump’s attacks on Brazil, where the US has a trade surplus but that government has jailed Trump’s “coup bro” (Bolsinaro, see US-Trade: The 50% Solution? 7-10-25). We also see “sugar and sweets” in the CPI lines at +6.7% with “candy and chewing gum” at +9.8%. There goes my coffee and Three Musketeers.
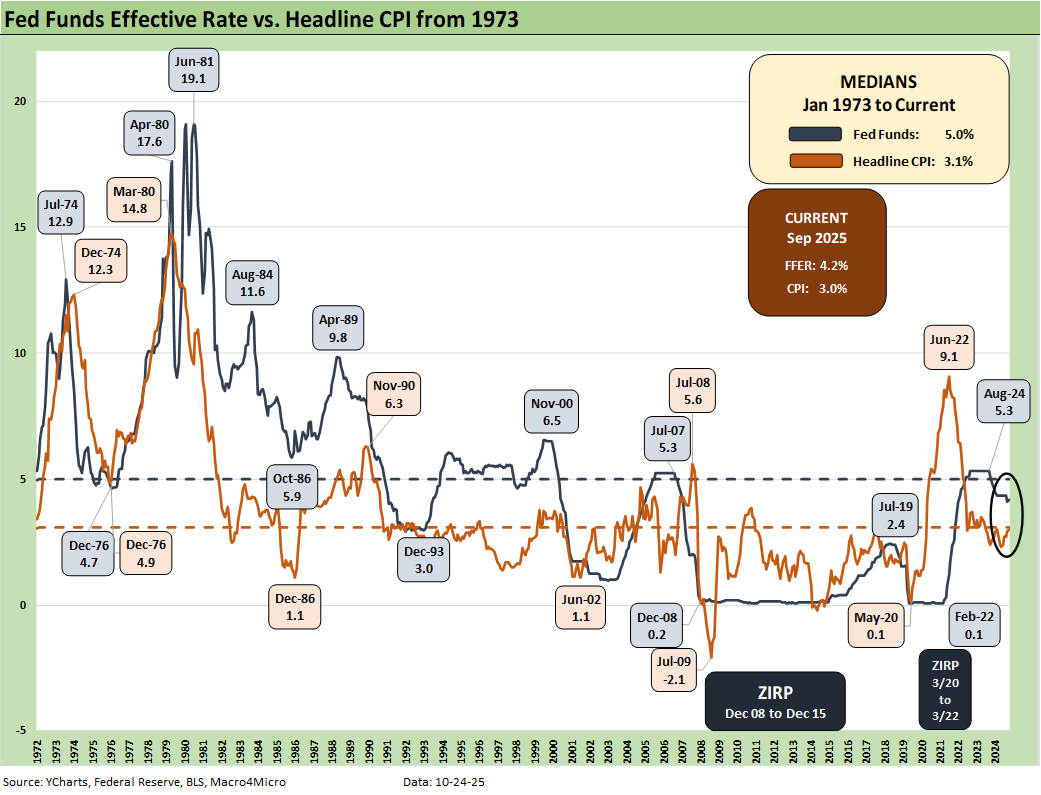
The above chart is our usual update of headline CPI across the cycles plotted against fed funds (monthly average updates per Y Charts).
Those of us who came of working age back in the 1970s stagflation years fully appreciate the caution of the FOMC around tariff effects on inflation and the impact on GDP growth. Their desire to come to grips with the flow-through effect of tariffs is rational and not partisan. Stagflation is the worst enemy from a policy alternatives standpoint, and that risk is not gone.
Slower growth (or GDP contraction) with a 3% handle could set off a debate of whether the word “stagflation” even applies. That is especially the case given the high bar for “ugly” set in the peaks of the 1970s and 1980-1982 double dip. Low growth and modestly rising inflation to us constitutes “stagnation + inflation” or stagflation. Having lived and worked through double digit inflation and some scattered 20% fed funds moments, we are in a very, very different discussion in 2025. That history that Volcker addressed is what has driven the price fixation of FOMC policy. Trump is not interested in that history. He wants lower UST interest expense for record borrowing and debt service needs.
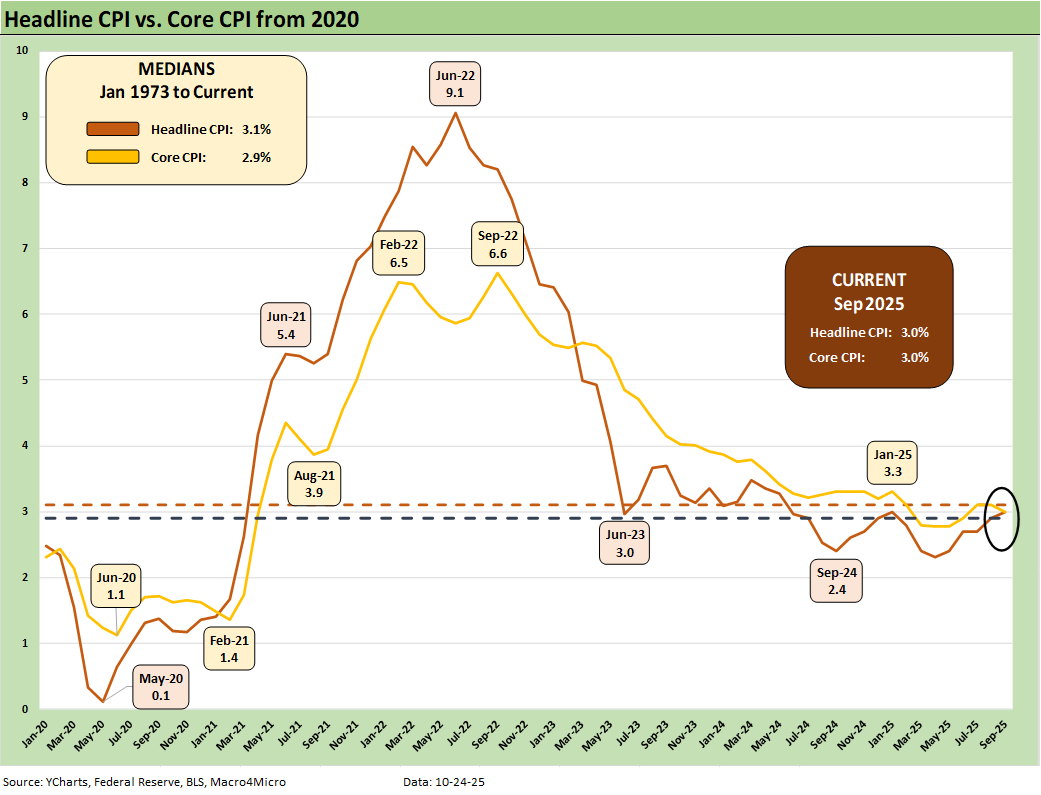
The above chart updates the running headline CPI vs. core CPI from 2020 for a frame of reference that is heavily wagged by energy. We frame recent numbers vs. the post-1973 medians in the box in the upper left of the chart.
The simple statement is the current headline CPI is 1 tick below the long-term median from 1973 while the current core CPI is 1 tick above the long-term median. With Trump’s usual display of technical virtuosity and grasp of numbers, he frames this market as “we have no inflation.”
As someone who arrived in NYC in June 1980 with a 22% Misery Index in the market, these current numbers are high in the context of the new millennium but are quite low vs. inflation pain cycles of decades gone by. Those 1973-1975 and 1979 to 1982 bouts of volatility are just what the FOMC is determined to avoid. Trump is about immediate gratification (300 bps cut “now” was his demand heading into September).
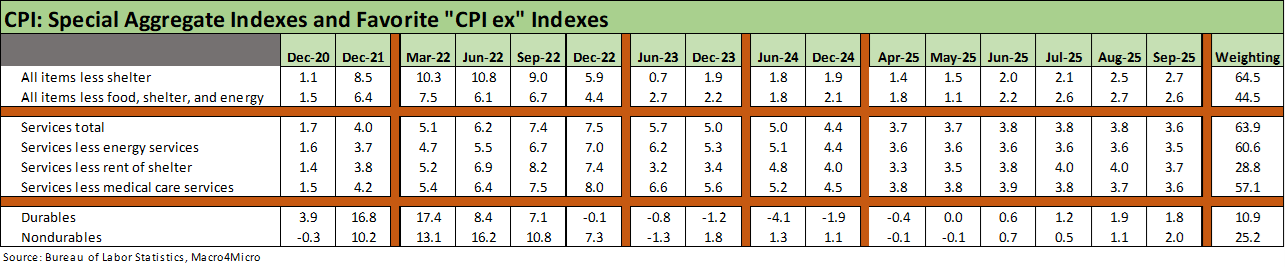
The above table updates some of the “special aggregates” CPI index lines which get posted on Table 3 of the CPI release. The “CPI ex” collection always adds some value across high level sectors and makes some useful adjustments. The above table shows some reassuring levels in 2023-2024 in a key line such as “All Items Less Shelter” as the outsized derived line items such as “Owners’ Equivalent Rent” are worth excluding for some other angles. We have frequently discussed those shelter metrics in past commentaries.
The struggle in lowering headline inflation is that we live in a Services economy, and the Services CPI is very difficult to bring down below a 3% handle range. That sticky services inflation has been the case in shelter and energy services with electricity and utility piped gas a major challenge in the timeline.
The tariff challenges flow directly into goods and indirectly into services, and goods CPI are in fact low. That comes with the qualifier that Durable Goods are coming off deflation in 2024 and are now rising. For nondurables, we also see steady increases in the CPI line into 2025. Those moves in goods CPI lines to higher levels are not a coincidence. Tariffs play a role.
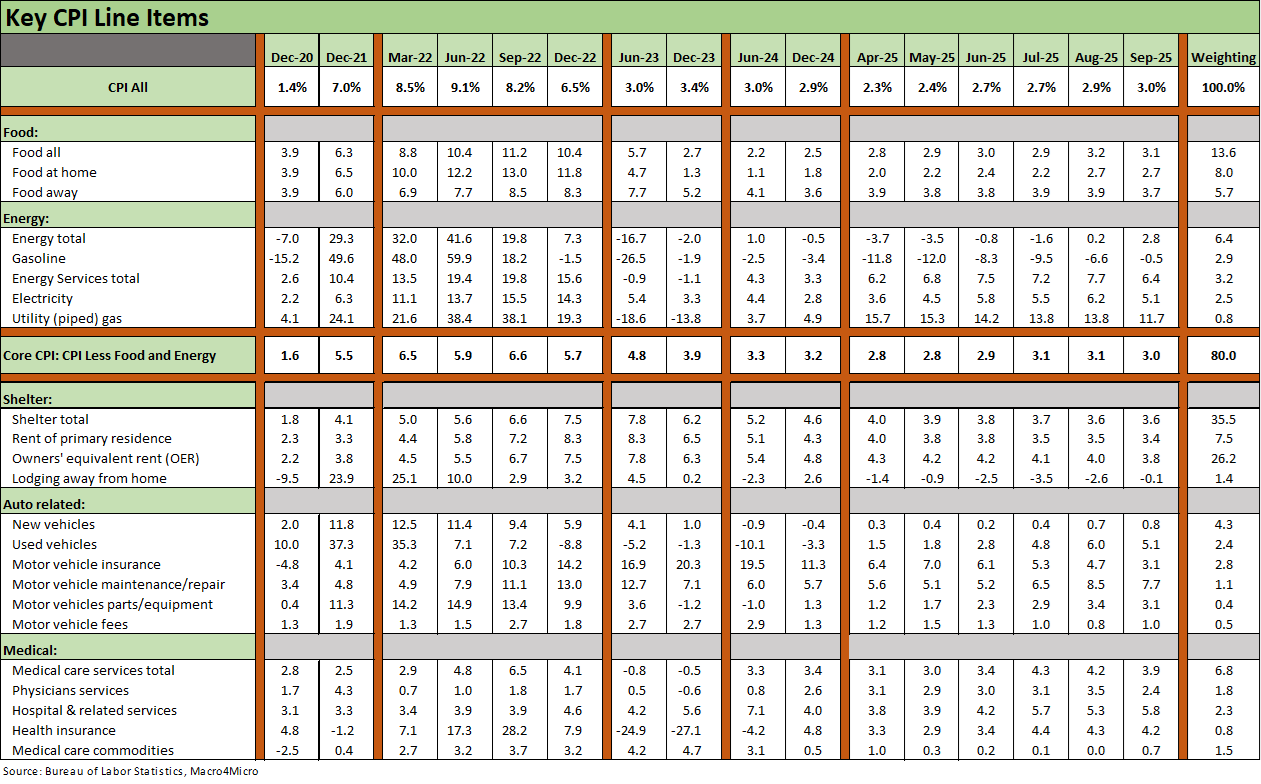
The Big 5 groupings above include our own version of the automotive mix (see Automotive Inflation: More than Meets the Eye 10-17-22). Energy has been helping the headline number with deflation in gasoline, but electricity and piped gas are at high inflation numbers. Crude oil remains weak to this point, and that helped consumers during the peak driving season. We see Food ticking higher in 2025 with some highlights noted earlier.
The dynamics of global commodities (supply vs. demand) is a wildcard in energy while Trump policies directly impact goods CPI numbers. This past week, the dynamics of upward supply pressures from the Middle East was greeted by Russian sanction uncertainty and how that might apply in Asia (India, China). The headlines are pushing the speculative premium on oil higher. As we go to print, WTI is almost at $62 vs. $57 on Monday.
For autos, the new vehicle CPI has stayed in check since the OEMs are eating the cost. That was no surprise and was a priority for the auto companies in supporting dealer retail sales and fleet volume. That will be a slow process to unfold, but vehicle prices will gradually move up in 2026. The average transaction price is around $51K at GM and sticker shock is creating a challenge for the “new vs. used” decision by car buyers on affordability. Used car CPI popped to +5.1% in September vs. +0.8% for new vehicles. Vehicle Insurance eased a bit this month after a heady run while more complex vehicles also have kept maintenance and repair costs high.
The medical care cost issues seem to be dwarfed now by the broader political issues from the tax bill and now the shutdown battle around the ACA and healthcare premiums for millions. Hospital and Related Services weighed in at +5.8% YoY in Sept.
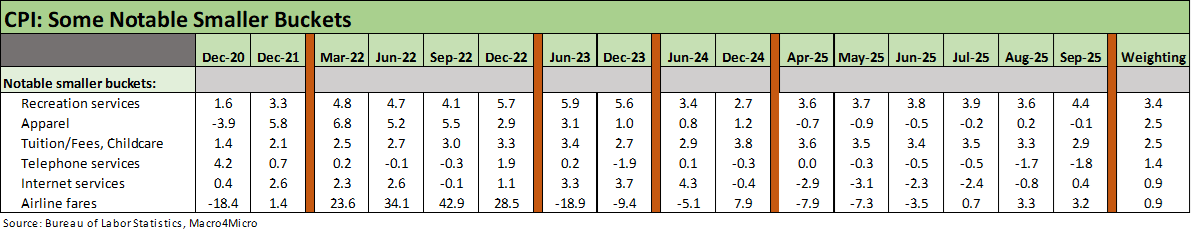
The above table updates the “near and dear” checklist for many households. Recreation Services at 4.4% is at a multi-month high with the others mostly in check. Apparel is interesting in the tariff context given the low-cost labor arb targeting by Trump of Mexico and Asian economies.
The Apparel headline CPI YoY of -0.1% is clearly low even if we can all speculate on the pricing strategies of the sellers (are they eating the tariffs from their base of high margins?) or the simple fact that orders lag and working capital dynamics will not give us a clear read for a while into 2026. Anecdotal evidence of massive “sales specials” and deep discounting have been easy to find.
See other Inflation Related:
PCE August 2025: Very Slow Fuse 9-26-25
FOMC: Curve Scenarios Take Wing, Steepen for Now 9-17-25
CPI August 2025: Slow Burn or Fleeting Adjustment? 9-11-25
PPI Aug 2025: For my next trick… 9-10-25
PCE July 2025: Prices, Income and Outlays 8-29-25
Producer Price Index: A Snapshot of the Moving Parts 8-14-25
CPI July 2025: Slow Erosion of Purchasing Power 8-12-25
PCE June 2025: Prices, Income, and Outlays 7-31-25
Employment Cost Index 2Q25: Labor in Quiet Mode 7-31-25
CPI June 2025: Slow Flowthrough but Starting 7-15-25
PCE May 2025: Personal Income and Outlays 6-27-25
CPI May 2025: The Slow Tariff Policy Grind 6-11-25
Employment Cost Index 1Q25: Labor is Not the Main Worry 5-1-25
Inflation: The Grocery Price Thing vs. Energy 12-16-24
Inflation Timelines: Cyclical Histories, Key CPI Buckets11-20-23
Fed Funds – Inflation Differentials: Strange History 7-1-23
Fed Funds, CPI, and the Stairway to Where? 10-20-22