
Mini Market Lookback: FOMC Countdown
The economic data game clock restarted with payroll numbers that became a Rorschach Test for both UST curve bulls and bears.


The FedWatch Collection
In a week where a President wanted to execute 6 legislators, Ukraine was getting sold out, and Mamdani and Trump were braiding each other’s hair, the focus was more on the wild post-NVIDIA earnings swing and the dramatic moves in FedWatch odds from day to day. The potential for an FOMC cut is now 69% per FedWatch after the prior week where it had plunged by over 50 points before rebounding this past week from 44%. Trump got vocal in his attacks on Powell again this past week saying “I’d love to fire his ass” before delivering a similar (likely joking) threat at Bessent.
The Sept jobs numbers looked good in recent context, but the reality is that every month in 2025 has posted payroll additions that were below the post-Jan 2009 median. That timeline includes some ugly payroll months including steep recession periods and the auto meltdown. The payroll adds/decline trends YTD have been grim (see Employment Sept 2025: In Data We Trust 11-20-25), and that keeps the UST bulls in the game. Since the tightening cycle started, only two months saw negative payrolls – both in 2025.
As detailed below, NVIDIA as the bellwether of the entire AI bull market theme delivered a banner quarter, but the bubble anxiety still dominated the picture in a bad week for tech equities. Some Fed curve jawboning saved the market Friday and offered a bounce, but the valuation anxiety and “doubter count” will remain stubborn.
When the smoke cleared on the week, the four major benchmarks were negative, 8 of 11 S&P 500 sectors were in the red, credit spreads were wider, and the UST curve rallied from 3M to 30Y with the 2Y to 7Y leading the pack down by double digits. Mortgage rates stayed stubborn with the Friday close on Mortgage News Daily at 6.34%.
Bellwether retail earnings (WMT, TJX, TGT, HD) this week mixed some reassuring notes (notably WMT) on consumer spending with worrisome signals. The consumer sector is still at the top of the list for growth with consumers at 68% of GDP. That said, households are facing a wide range of affordability pressures (see Simplifying the Affordability Question 11-11-25).
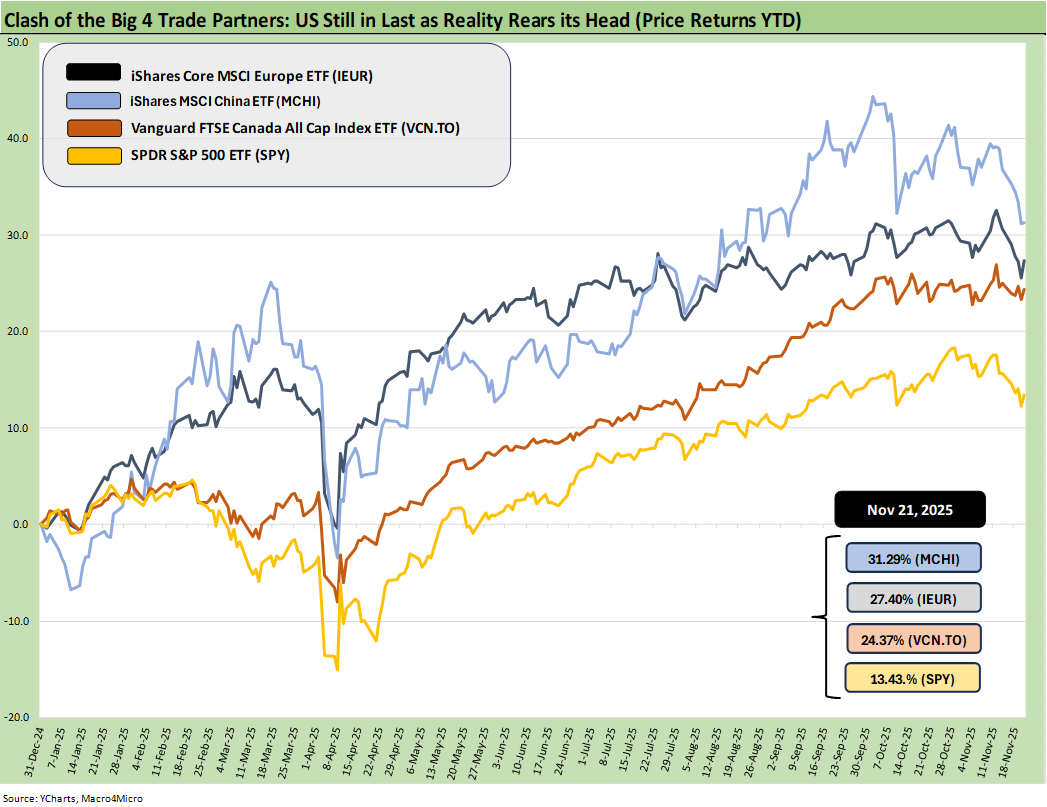
Our usual lead chart did not bring much news in terms of direction. The chart updates the YTD returns for some bellwether index ETFs for the Big 4 developed market trading partners – the US, Europe, China, and Canada. The aim of the chart is to plot some ETFs that tell a market story for US investors thinking about global diversification. These ETFs are just a useful sample that uses relevant broad market indexes for each region as snapshots.
The goal of this chart is to capture the balance of risks across the broad mix of macro trends (economy, currency) and the sea level industry and company fundamentals rolled up into a US traded ETF. Once again, the US placed dead last YTD with the heavy influence of the dollar plunge in 2025.
The dollar has been on the mend in recent weeks after the worst YTD stretch since the 1970s. The price action is likely to remain an X factor as the direction of interest rates and the FOMC still signal uncertainty just watching the FedWatch gyrations the past two weeks.
The rule of thumb is the dollar stays firm or strengthens when the US economic indicators are strong and UST rates are stubborn or higher. The market combined confused and rattled with the Sept payroll report, which was decent for 2025 but weak in historical context.
The political disarray and relative instability of Washington in 2025 (setting the stage for election attacks in 2026, soldiers in US streets, authoritarian leaning White House with GOP and SCOTUS tacit support, the optics of ICE violence) have raised some unusual issues for the dollar. The local currency-exposed ETFs thus make for a more complex set of inputs into 2026.
The “American exceptionalism” question around the dollar gets tricky when the President (a daft draft dodger) calls for the execution of 6 respected legislators including 5 veterans (and 1 former National Security official). That is less than inspiring when Trump and his NYC real estate sidekick/negotiator hand Ukraine peace terms that some sarcastically say needed to be translated from Russian. They are spending the weekend backpedaling and saying it was “Russia’s plan, not their plan.”
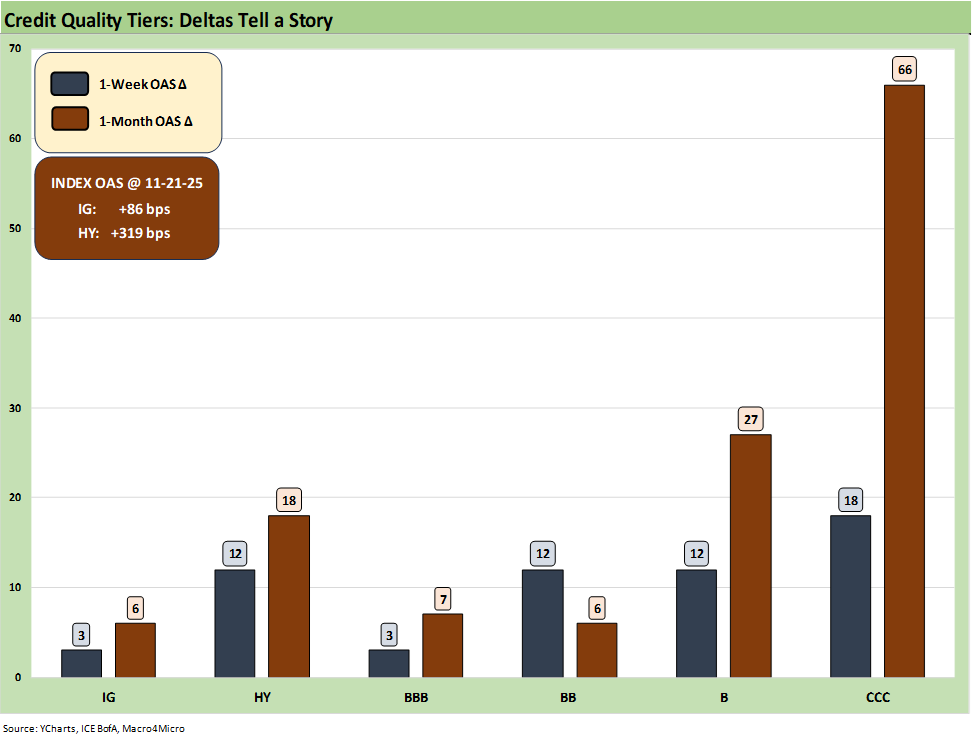
The above chart updates the running 1-week and 1-month credit spread deltas for IG and HY. Spreads have seen some pressure and notably in HY with quality spreads wider as well and detailed further below. HY is +18 bps for the trailing month and IG +6 bps wider.
The absolute HY spread levels at +319 bps are still in line with most past historical lows. The HY Index OAS is +27 bps wider for the YTD period.
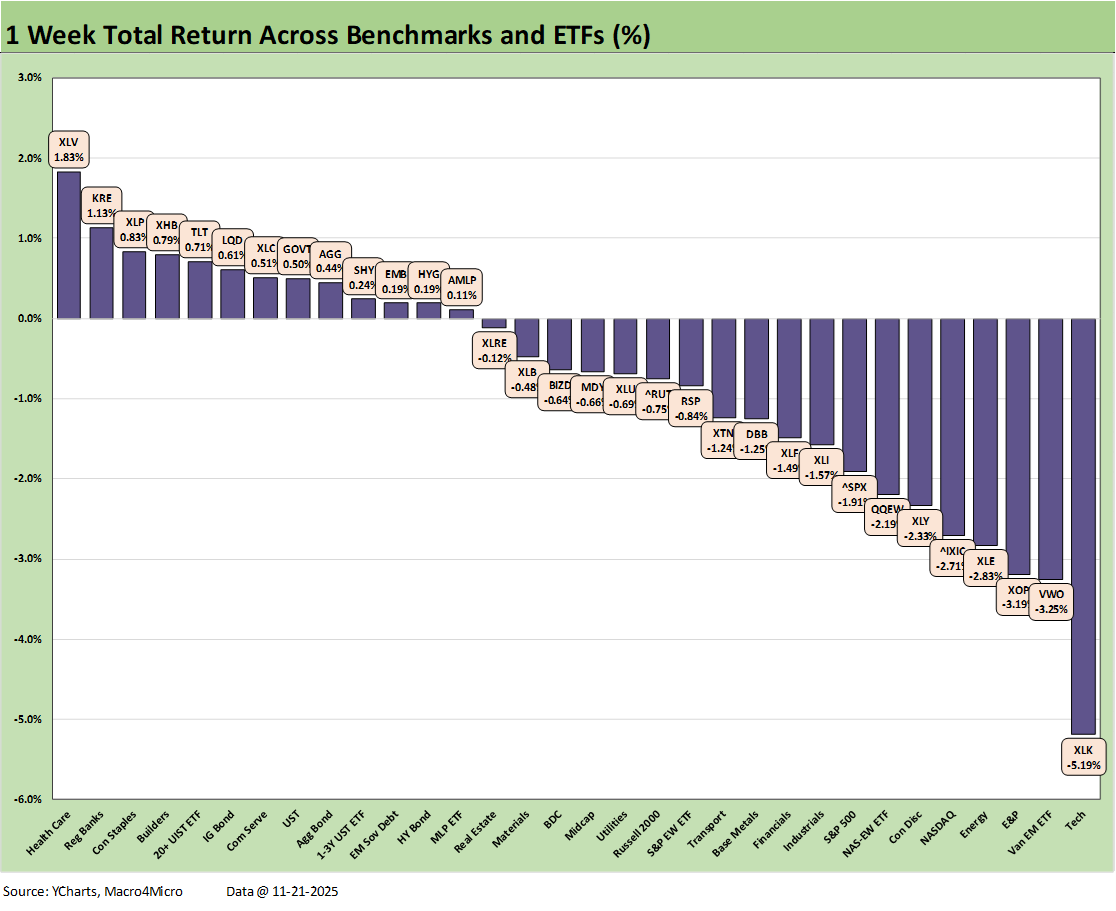
The weekly returns on the 32 benchmarks and ETFs weighed in with a score of 13 positive and 19 negative this week with all 7 bond ETFs in positive range. We see 3 bond ETFs in the top quartile led by the long duration UST (TLT), IG Corporates (LQD), and GOVT.
Sitting on top at #1 is the Health Care ETF (XLV), which has seen quite a run of late in pharma equities. Regional Banks (KRE) and Homebuilders (XHB) bounced back this week on the UST rally.
We see the Tech ETF (XLK) sitting in last place at -5.2%. The large cap S&P 500 and NASDAQ were both in the bottom quartile with the heavy weighting of tech exposure as was the Equal Weight NASDAQ 100 ETF (QQEW). Oil prices slid this past week with the potential for Russian supply increasing if a truce is reached. We see the Energy ETF (XLE) and E&P ETF (XOP) both in the bottom 5.
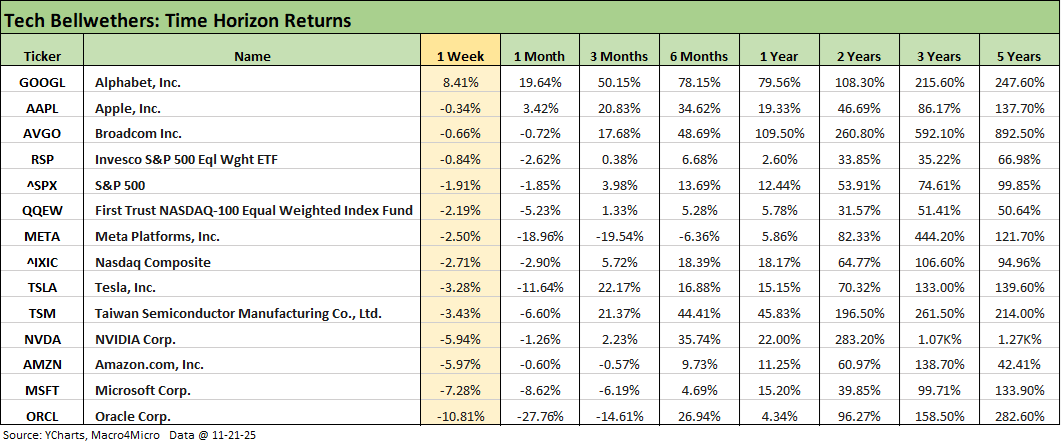
The above table highlights the very ugly week for tech bellwethers with the notable exception of Alphabet at #1 with a strong +8.4% this week and the rest negative. We see a lot of “red” over the 1-month time horizon with the worst running performer being Meta over the trailing 3-months and 6-months.
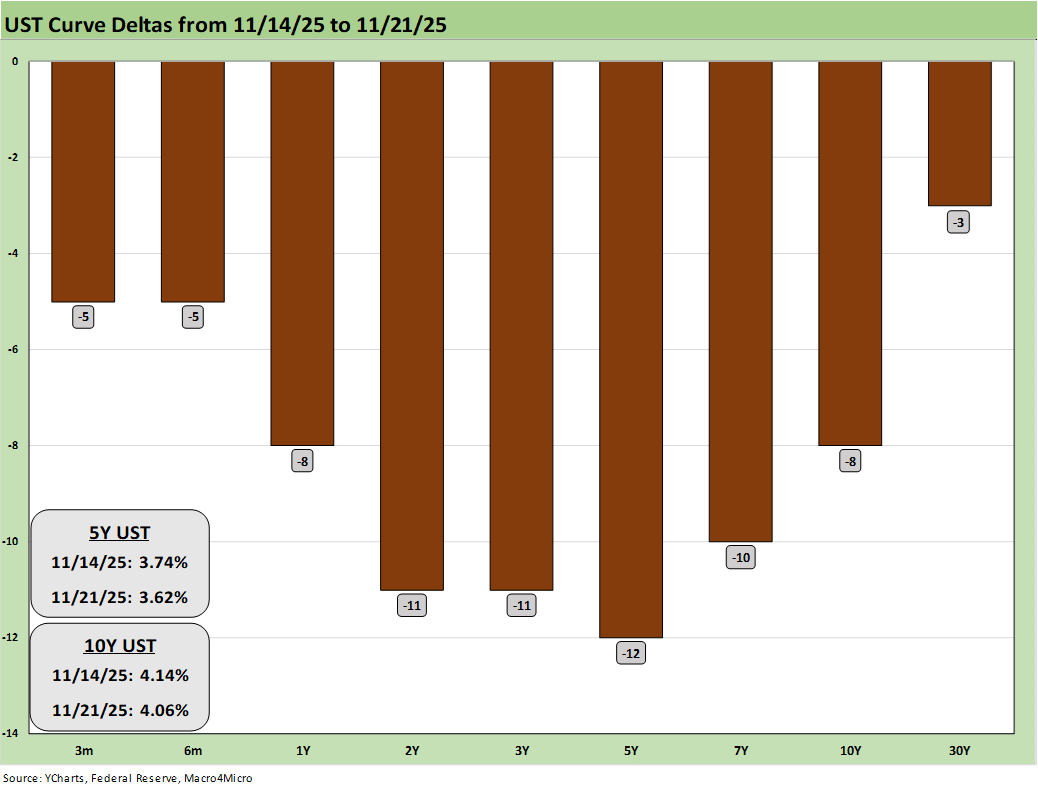
The weekly UST deltas are plotted above and show a solid move for duration as highlighted in the earlier return chart.
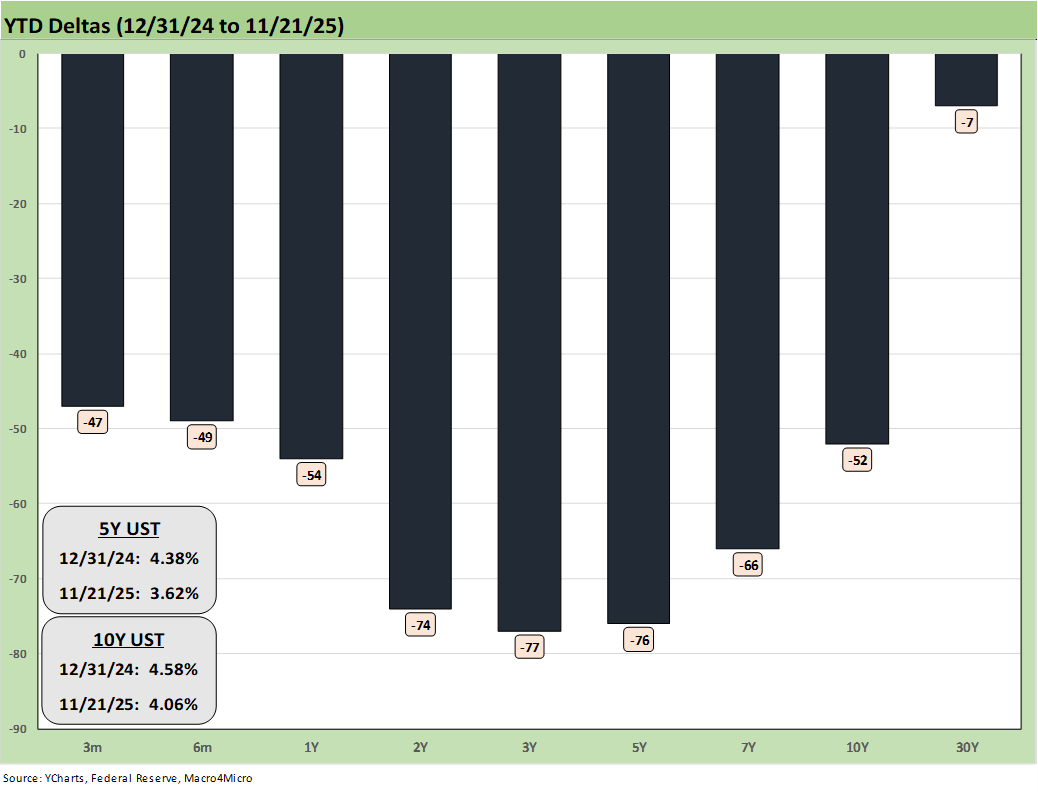
The above chart updates the YTD bull steepener from 2Y to 30Y with the 30Y remaining stubborn for the same reasons long sovereign debt from UK to the US to Japan have struggled. Fear of supply and duration and a mixed view on inflation are not helping the bull flattening fans much at this point despite some decent weeks on and off for TLT.
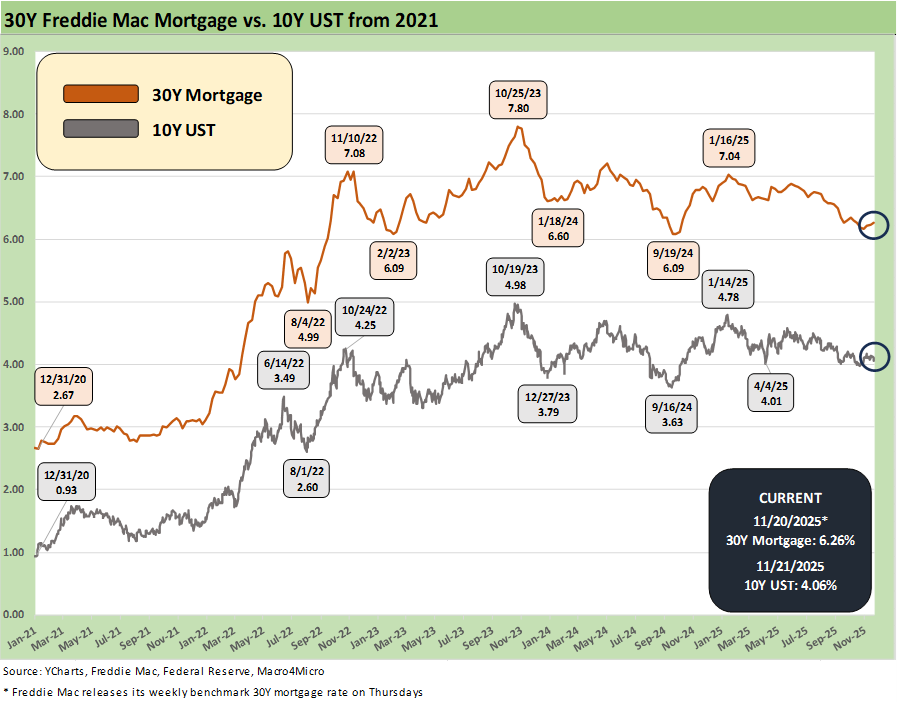
The above chart updates the time series for the 10Y UST and Freddie Mac 30Y benchmark. The memory of the Sept 2024 rally in UST and mortgages will keep hopes alive for the housing market and those with bull steepener expectations. Clearly, it has not yet arrived.
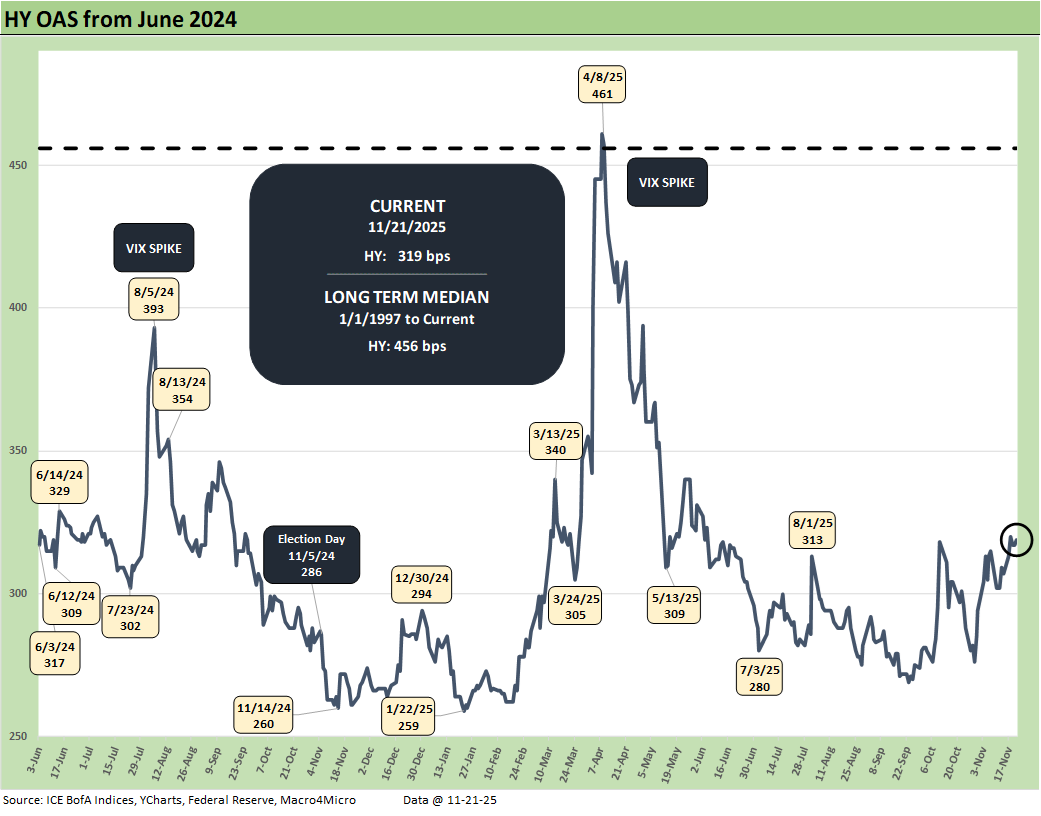
HY OAS widened by +12 bps on the week to +319 bps. That is inside the June 2014 lows of +335 bps, slightly wide to the cyclical low of +316 bps in Oct 2018, below the +338 bps of Jan 2020, and above the Dec 2021 lows of +301 bps.
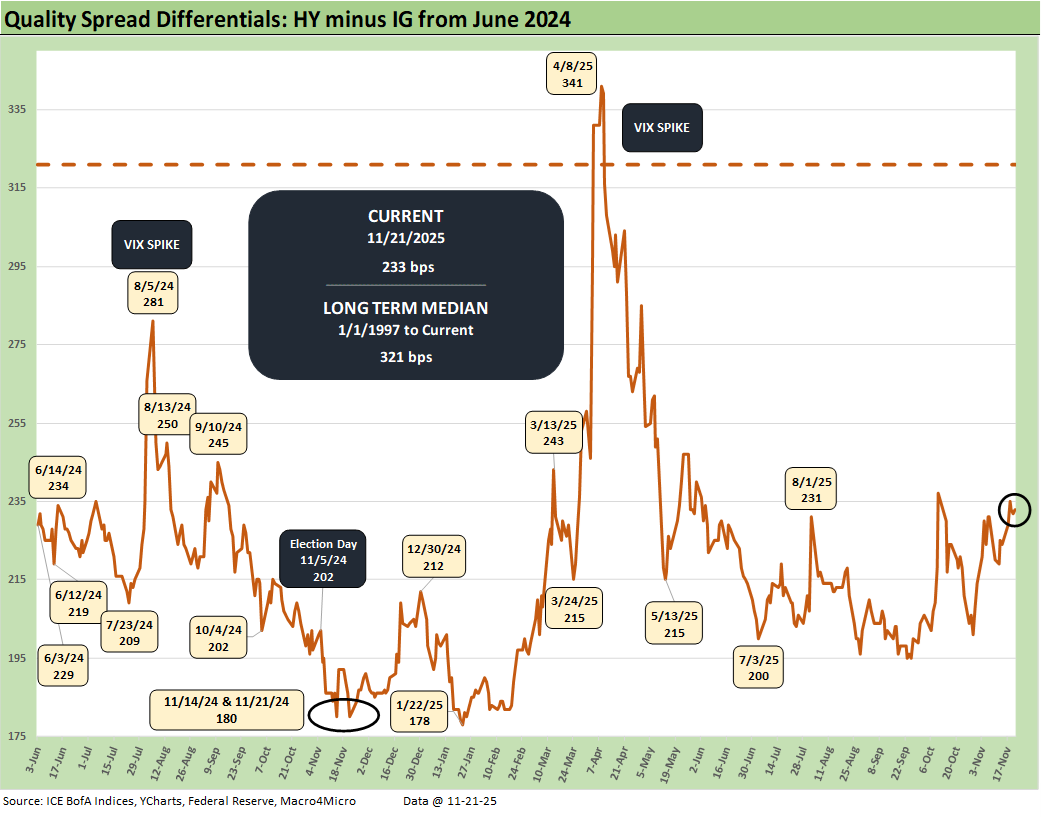
The “HY OAS minus IG OAS” quality spread differentials widened by +9 bps to +233 bps with IG +3 bps wider and HY +12 bps wider. That is dramatically inside the long-term median of +321 bps, which drives home the quality spread compression and lower compensation for taking on more credit risk. The qualifiers on that compression include a much higher mix of BB tier exposure and a much smaller role played by refinancing of highly leveraged deals that have migrated over to the private credit markets.
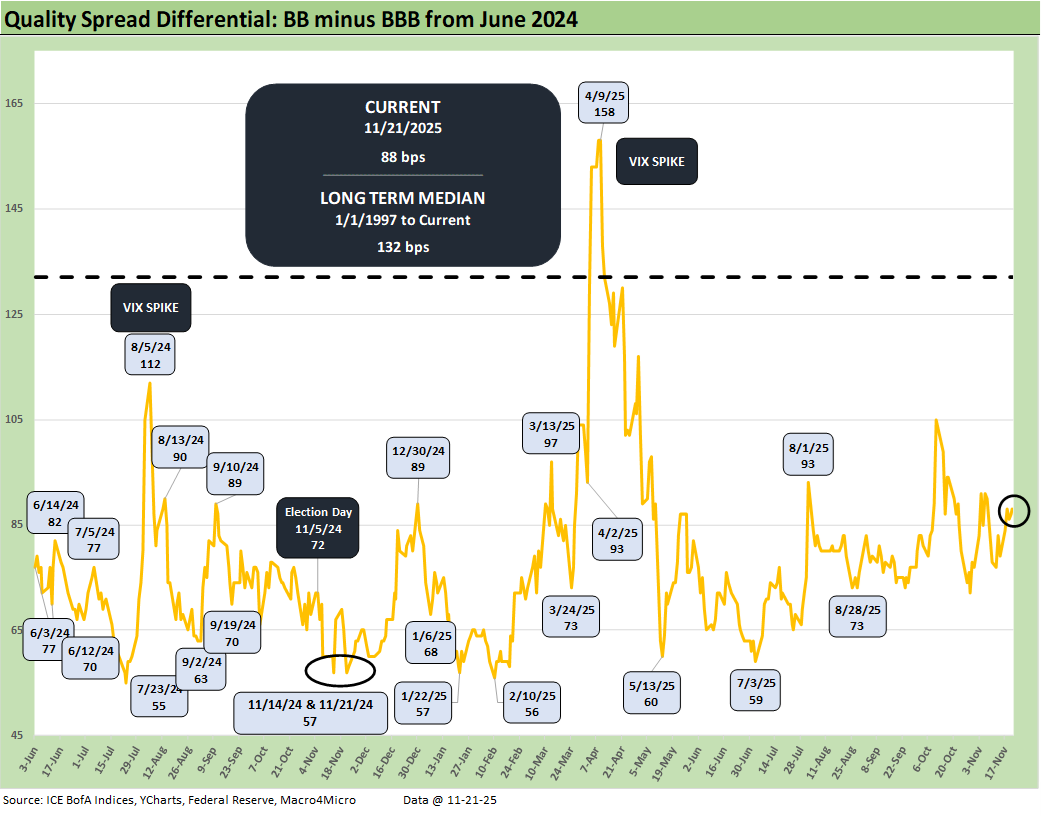
The “BB OAS minus BBB OAS” quality spread compression widened by +9 bps with the BBs wider by +12 bps and BBBs wider by +3 bps. The +88 bps is well inside the long-term median of +132 bps but lower than the recent 50 handle and 60 handle number seen in recent lows in 2024-2025.
See also:
Employment Sept 2025: In Data We Trust 11-20-25
Payrolls Sep25: Into the Weeds 11-20-25
Credit Markets: Show Me the Data 11-17-25
The Curve: Slopes Can Get Complicated 11-16-25
Market Commentary: Asset Returns 11-16-25
Mini Market Lookback: Tariff Policy Shift Tells an Obvious Story 11-15-25
Retail Gasoline Prices: Biblical Power to Control Global Commodities 11-13-25
Credit Markets: Budget Armistice or GOP Victory Day? 11-12-25
Simplifying the Affordability Question 11-11-25
The Curve: Back to the Future 11-9-25
Market Commetary: Asset Returns 11-9-25
Mini Market Lookback: All that Glitters… 11-8-25
Credit Markets: Little Shop of Worries 11-3-25
Mini Market Lookback: Not Quite Magnificent Week 11-1-25
Synchrony: Credit Card Bellwether 10-30-25
Credit Markets: Call Me After Trouble Arrives 10-27-25
Market Commentary: Asset Returns 10-26-25
Existing Home Sales Sept 2025: Staying in a Tight Range 10-26-25
Mini Market Lookback: Absence of Bad News Reigns 10-25-25
CPI September 2025: Headline Up, Core Down 10-24-25
General Motors Update: Same Ride, Smooth Enough 10-23-25
Mini Market Lookback: Healthy Banks, Mixed Economy, Poor Governance 10-18-25
Mini Market Lookback: Event Risk Revisited 10-11-25
Credit Profile: General Motors and GM Financial 10-9-25
Mini Market Lookback: Chess? Checkers? Set the game table on fire? 10-4-25
JOLTS Aug 2025: Tough math when “total unemployed > job openings” 9-30-25
Mini Market Lookback: Market Compartmentalization, Political Chaos 9-27-25
PCE August 2025: Very Slow Fuse 9-26-25
Durable Goods Aug 2025: Core Demand Stays Steady 9-25-25
2Q25 GDP Final Estimate: Big Upward Revision 9-25-25
New Homes Sales Aug 2025: Surprise Bounce, Revisions Ahead? 9-25-25
Mini Market Lookback: Easy Street 9-20-25
Home Starts August 2025: Bad News for Starts 9-17-25
Industrial Production Aug 2025: Capacity Utilization 9-16-25
Retail Sales Aug 2025: Resilience with Fraying Edges 9-16-25
Mini Market Lookback: Ugly Week in America, Mild in Markets 9-13-25
CPI August 2025: Slow Burn or Fleeting Adjustment? 9-11-25
PPI Aug 2025: For my next trick… 9-10-25
Mini Market Lookback: Job Trends Worst Since COVID 9-6-25