
Footnotes & Flashbacks: Credit Markets 8-18-25
Credit spreads continued to narrow alongside solid equity performance as CPI and PPI signaled inflationary pressures.


That’s a big tariff challenge.
Credit tightened again this week with IG at +75 bps after a -5 bps move and HY at +288 bps after -6 bps, underscoring favorable investor risk appetites even with valuations near cyclical tights and a mixed macro picture of softer labor and inflationary pressures.
Core CPI increased to 3.1% in July from 2.9% in June while PPI posted a sharp +0.9% MoM gain this past week. Together, they provide a read into where tariff-linked cost pressures are building but not enough to shake equity or credit markets – yet.
Last week’s Retail Sales numbers showed continued consumer strength, but consumer sentiment moved lower on elevated inflation expectations (see Retail Sales Jul 25: Cautious Optimism in the Aisles 8-15-25). Upcoming retail earnings will be key to understanding where consumer behavioral changes lie and what strategies retailers have used in response.
The next few weeks of economic releases will set the stage for September’s FOMC meeting with important color coming from the July PCE, Aug payrolls, and Aug CPI. July payroll data, which included major downward revisions, supported calls for easing, but inflation trends will be the key swing factor. We’ll be on the lookout for any new insights out of this week’s Economic Policy Symposium hosted by the Kansas City Fed at Jackson Hole.
We remain at historically low spread levels and the risk asymmetry remains heavily towards widening if data or Fed policy disappoints in the coming weeks.
Below we update our rolling weekly credit markets commentary and spread recap. We already addressed a range of moving parts in our earlier posts over the weekend:
Footnotes & Flashbacks: State of Yields 8-17-25
Footnotes & Flashbacks: Asset Returns 8-16-25
Mini Market Lookback: Rising Inflation, Steady Low Growth? 8-16-25
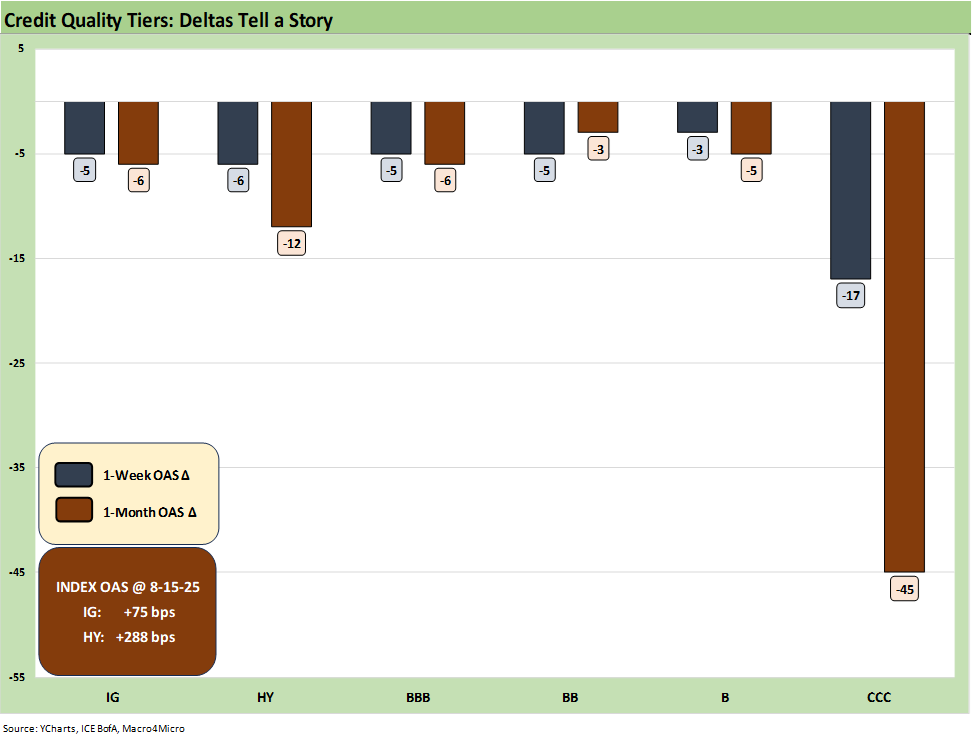
The above chart updates the credit spread deltas for 1-week and 1-month, with IG spreads ending the week at +75 bps and HY ending at +288 bps. The -5 bps tightening this week for IG brought the index below the latest 4Q24 lows of +77 bps, as well as the low of +79 bps seen in Mar 2005 at the height of the housing bubble.
IG fully retraced back below levels provoked by the July payrolls revision shock, while HY remained virtually flat to the +286 bps level to start the month. The overall trend across the 30-day trailing underscores the persistence of the tightening impulse over the past several months. The move last week keeps HY marching well below the +300 bps level, further under the 2014 and 2018 cyclical lows, and even into the June 2007 range.
The current mix of risks increasingly appear detached from market pricing with many tariff adjustments and new Section 232 tariff headwinds still ahead as the market faces semis and pharma risks. Tariff headlines this week focused on semis with Trump’s 300% rate proposal, though it also received a very muted market reaction.
July inflation data did not shock markets, but the divergence between a milder CPI increase and sharper PPI move suggests tariff-linked costs are building up beneath the surface. That tension feeds into the institutional credibility erosion by Team Trump and questions around their end game on controlling the BLS and BEA. These should be major red flags for market participants, and the Aug payroll will be an interesting test of policy aggression.
There is ample room for volatility to pick back up as markets will have to reconsider both macro conditions and policy direction. (More pauses on China? More retaliation risk? The FOMC at 25 or 50 bps in Sept? etc.)
On the fundamental side, company earnings commentary has reinforced that tariffs carry real and immediate effects on the expense lines though the pricing reactions are “for later” in many industries. The next leg of the analysis is how forward-looking views fare as pricing strategies are “market tested” at sea level in the later summer and fall as economic releases and pricing data show up at a lag.
This coming week, retailers will provide some key data points and commentary on tariff impacts. We expect that such insight will flow into the Fed policy debate in advance of the September meeting.
HY remaining anchored around the +300 level is a vote of confidence in the balanced overall credit picture and the better positioning in higher income, shorter duration assets during a period of UST uncertainty. The BB heavy weighting of the HY index has been supportive of returns as noted in the next chart.
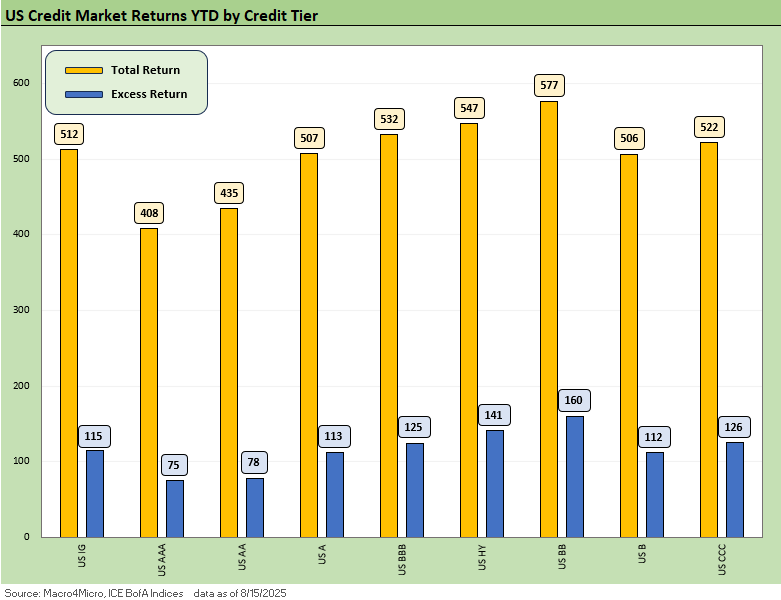
The above chart updates the YTD total return and excess return for IG and HY as well as the credit tiers. Excess returns are still not impressive with little upside potential from spread compression, but IG and HY are at least solidly positive at this point. New issues in HY also have the “coupon edge” for income seekers. A 6.92% composite HY YTW tells a favorable story of cash income in new issue flows and refi-and-extension actions. The current composite HY coupon is 6.56%. There is a wide range of coupons in the post-ZIRP world, so new issues in HY hold a lot of allure.
YTD total returns show the benefits of the modest bull steepener that has supported the short to intermediate UST curve segment (see Footnotes & Flashbacks: State of Yields 8-17-25). That duration angle can support the trade-off along the BBB/BB divide for the now well-established HY Light strategy.
Excess returns remain constrained and even the tightening bias leaves little room for further compression at such rarefied spread levels. Going forward, the combination of consumer stability, inflation trends, and Fed policy will dictate whether credit can keep pushing to all-time lows. We don’t see that as likely if rational pricing of risk prevails.
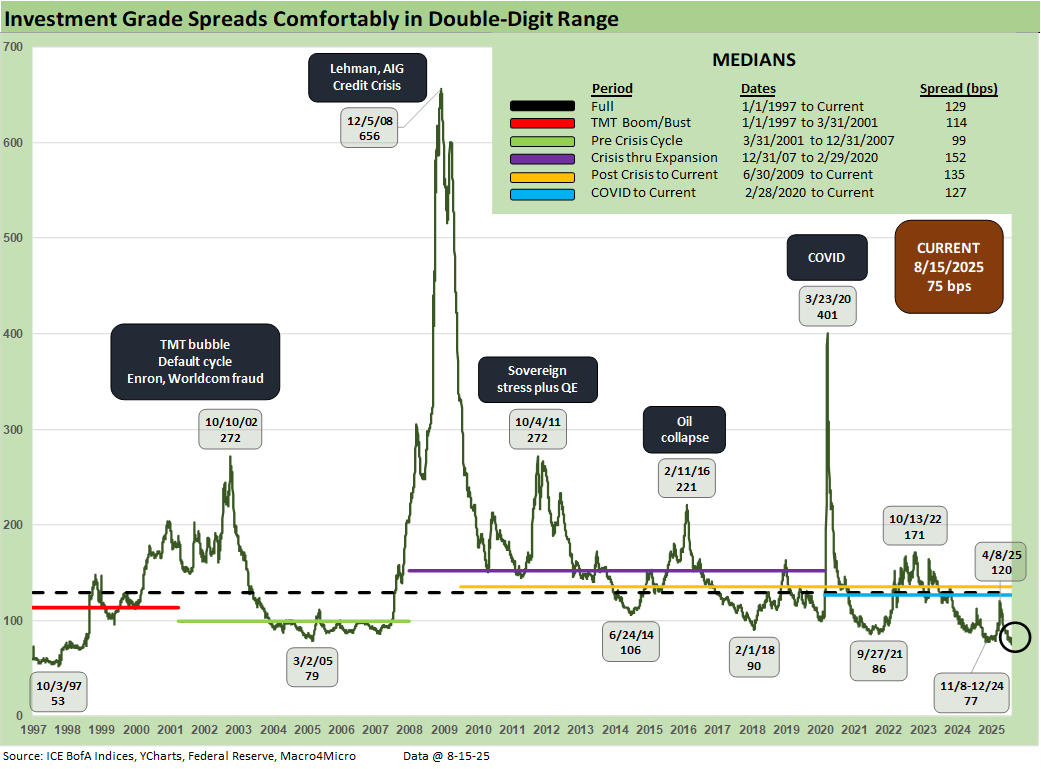
The double-digit IG spreads at +75 bps breaks through the 4Q24 lows of +77 bps and the Mar 2005 low of +79 bps. The long-term IG OAS median of +129 bps leaves a lot of room for widening and drives home how this market is priced for sustained dulled senses around tariff risks.
Valuations at these levels leave little cushion for negative surprises, but the 4.95% yield offered by the IG index still delivers significant income relative to the ZIRP era. Current coupon new issues, whether “new money” or refinancing low coupon bonds, continue to see a very solid base of demand after years of ZIRP and normalization. Income is back in the picture this credit cycle and reinforces these increasingly stretched valuations.
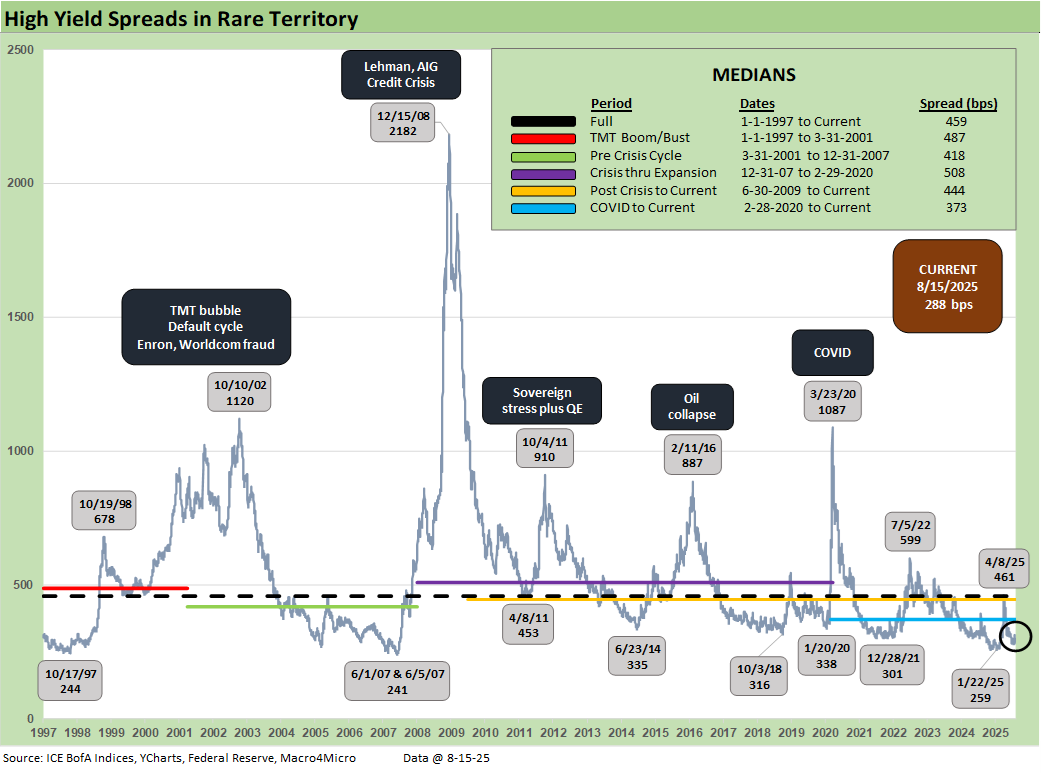
HY spreads ended the week at +288 bps, tightening -6 bps and moving further below the 2014, 2018 and 2021 lows. This marks almost a full retracement back to early August pre-payroll levels.
We see the 2018 period as a key comparison given the tariff backdrop running in parallel with the Dec 2017 tax bill. That did not end well the first time with very poor asset returns in 2018 before Powell and the FOMC needed to step in during 2019 in a period that Trump calls his “Greatest Economy Ever.”
Even as macro risk picks up in the conversation, the BB-heavy index and higher quality overall index have anchored valuations for now. The January +259 bps low underscores that there is still room for the most bullish to continue to justify the grind tighter. However, past periods of extended stretches under the +300 bps line suggest an underlying sensitivity to setbacks in policy actions or UST volatility.
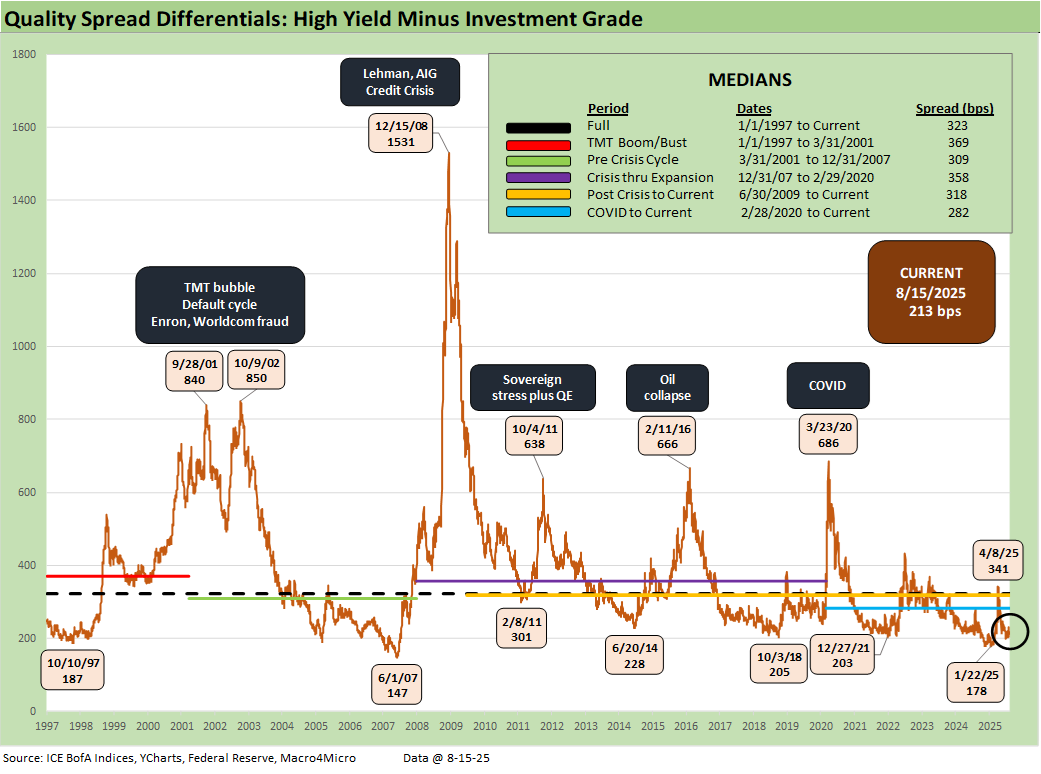
The “HY OAS minus IG OAS” quality spread differential narrowed -1 bps to +213 bps this week, keeping within the range of 2014, 2018 and 2021 lows. The compressed level still allows little room for setbacks in fundamentals at the macro level. Even a 15% baseline tariff is a clear catalyst for some issuers and broader economic pain as tariff impacts flow into pricing and expenses.
Correlation with potential equity volatility is a constant companion for HY as seen in April, but the overall fundamentals are solid in the IG and HY issuer base with earnings signaling still-healthy banks and generally well managed tariff costs so far. However, the supplier chain adjustment process will remain a major headwind for many industries.
Despite all the noise, it takes a lot of problems to trigger a recession (see Macro Menu: There is More Than “Recession” to Consider 8-5-25). Just think back to the pre-COVID expansion from the June 2009 cyclical trough through early 2020. Over more than a decade, we saw major swings in HY spreads and equity market volatility but no recession and the COVID recession of 2020 just lasted from February to April according to NBER.
Many variables have to go wrong from consumers to industry groups to cause a recession. We did not even have a recession in 2022 when inflation spiked – consumers remained solid and unemployment remained low.
As tariff impacts emerge, we remain focused more on fundamental erosion by major industry groups (autos, energy, etc.) and stress on the consumer. The consumer sector facing tariffs will be a challenge as will the fallout for the small business sector and retailers from tariff expenses and up-front cash demands to pay customs.
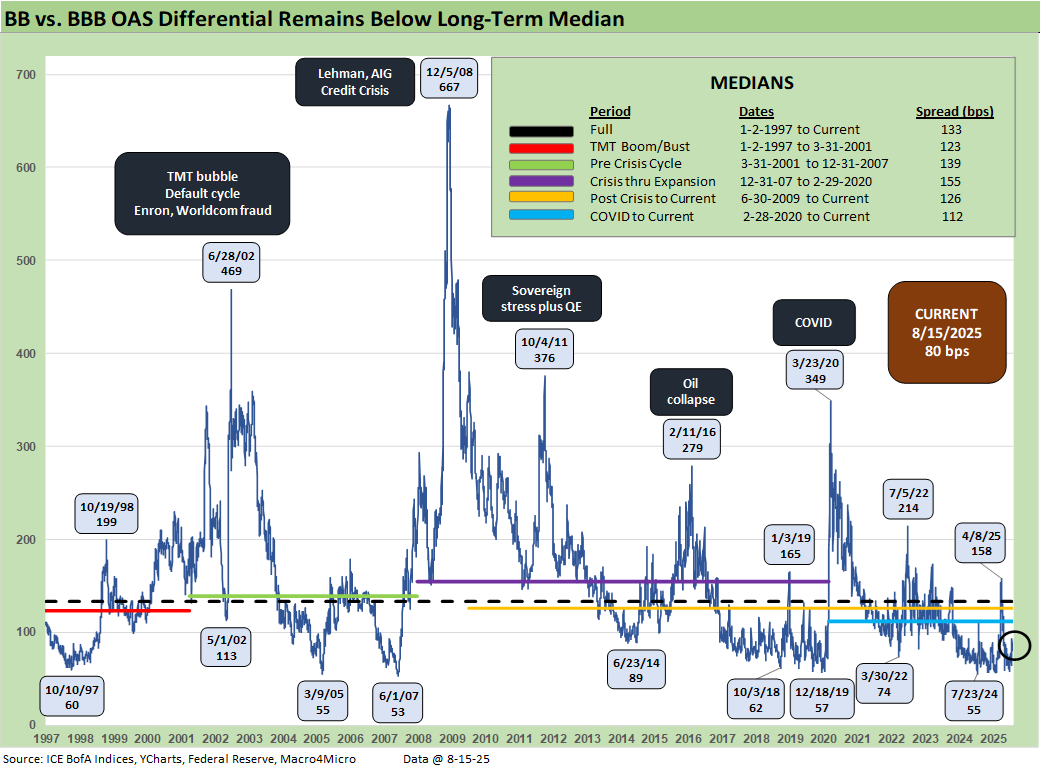
The “BB OAS minus BBB OAS” quality spread differential remained at +80 bps this week as credit markets tightened evenly across the speculative divide. We remain outside the tightest levels seen in recent months, but this metric can be very volatile as we saw with the spike to +158 bps after Liberation Day. Autos and Energy will be important sectors to watch for potential volatility in those tiers with Autos already reporting major tariff costs.
The oil price story is always a tricky one for issuers with high commodity exposure with Iranian and Russian supplies no small wildcards. OPEC actions also have been less than friendly to energy bulls in 2025. Oil remains below the highs seen after the Iran bombing highs but well above the late May $60 level.
For autos, it is very hard to see any good news coming out of the trade policies. Stellantis and Ford followed the earlier GM commentary with caution around the tariff headwinds. Those headline tariffs go beyond tariff expenses for the big OEMs and creep into supplier chain disruption risk and financial viability threats along the Tier 1, 2, and 3 supplier chain.
There is only “degrees of bad” for the OEMs from tariffs and potential catastrophe for some OE suppliers. Dealers and auto retail are the most resilient and the OEMs will need to take action to support their retail customer strategies.
There will be much to sort through in the auto sector in the coming months including the cost impact of high tariffs on steel, aluminum and now copper. The Mexico impact on production chains will be an especially important variable for US suppliers and OEM cost structures with GM’s exposure on light vehicle supply a critical factor.
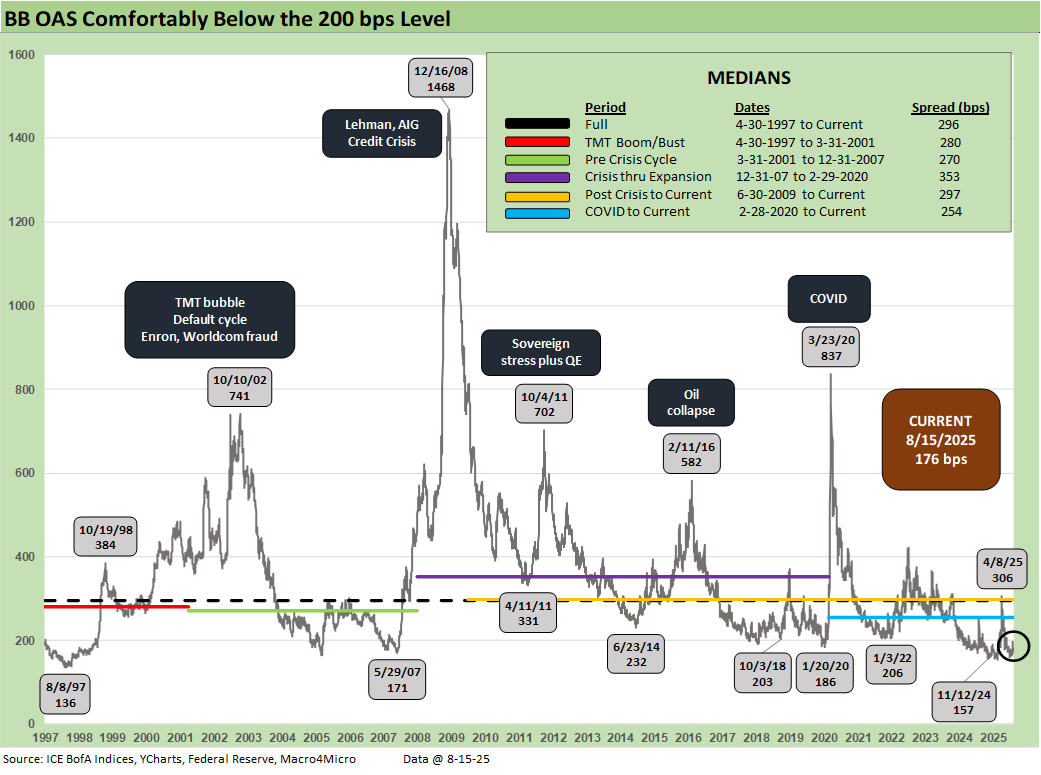
The sub-200 BB tier OAS line is a rare one to cross with tightening of -5 bps to +176 bps extending the steady grind that has defined most of 2025. We have seen BB spreads stay in that range since early May. That is not too far above the dazzling +157 bps low of Nov 2024 with the May 2007 lows also in view (+171 bps).
This level leaves the Oct 2018 cyclical low as a notable comp for a frame of reference, given the timing of the fresh sell-off in energy into Dec 2018. Though the current levels are vulnerable given the extraordinarily tight pricing, the higher quality index and low default rates leave plenty of room for rationalization of these levels. For longer time horizons, the BB tier has been a great place to be.
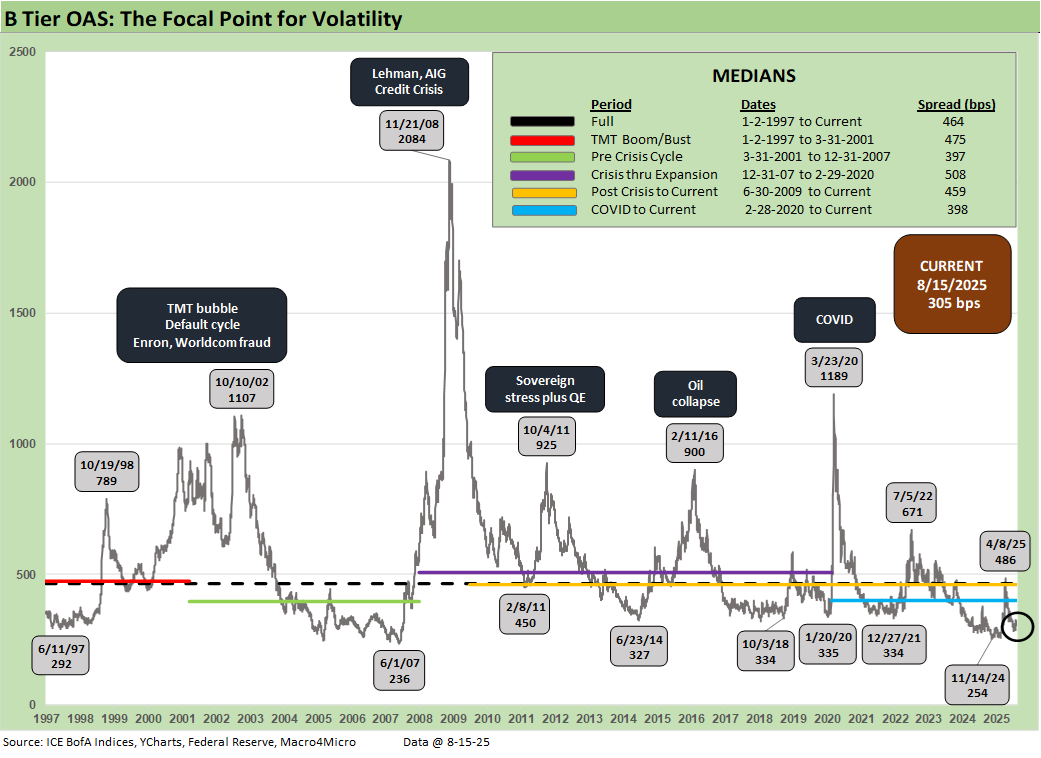
The B tier is the sweet spot of legacy HY fund investors and the current +305 bps is well inside Oct 2018 and June 2014 lows and -159 bps below the long-term median of +464 bps. The 7.08% YTW remains attractive but there is very little buffer for any downside shock from here. Deterioration in lending conditions would disproportionately impact lower rated credits as the risk premium compensation vs. BBs continues to narrow.
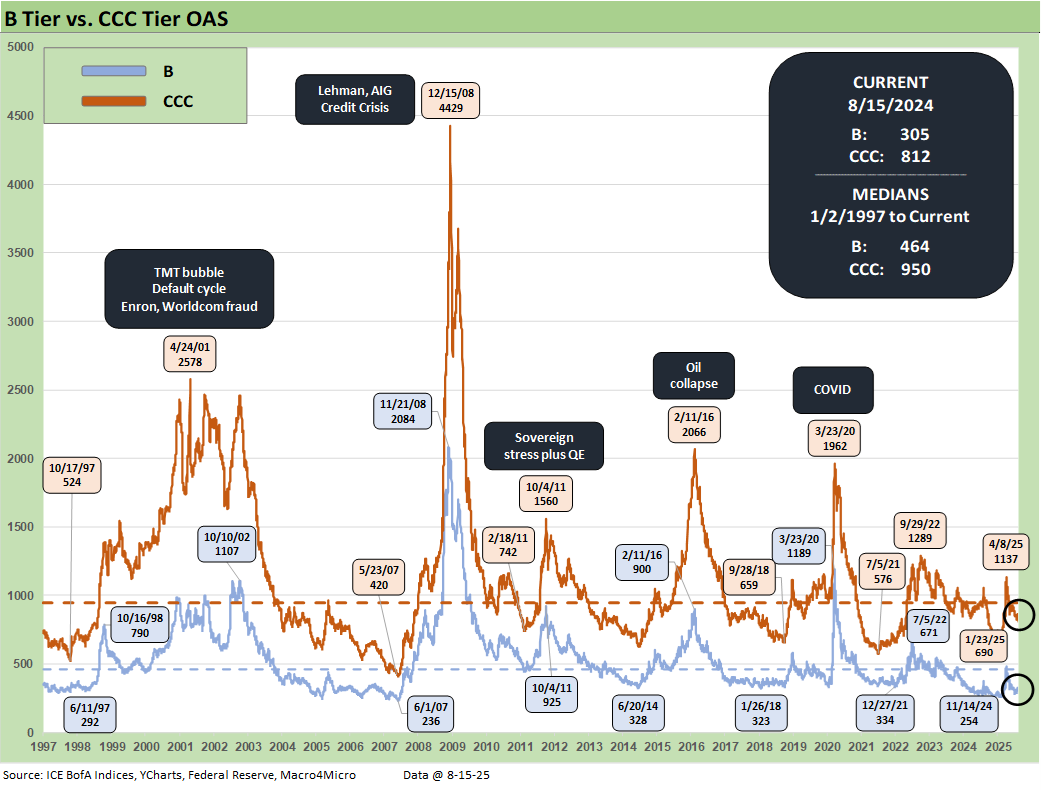
The B vs. CCC tier OAS time series is plotted above. The timeline for B and CCC spreads highlights the points of major divergence along the way (see The B vs. CCC Battle: Tough Neighborhood, Rough Players 7-7-24).
The current CCC tier OAS at +812 bps tightened by -17 bps the past week, moving away from the long-term median of +950 bps. The CCC YTW crossed below the 12% threshold to 11.89% after being above 14% in the Liberation Day sell-off. The underlying constituents are widely dispersed across an 82.95 composite dollar price. The CCC tier is still in the pricing zone of equity-like risk-returns with such yields as investors still appreciate that volatility can pick up very quickly there.
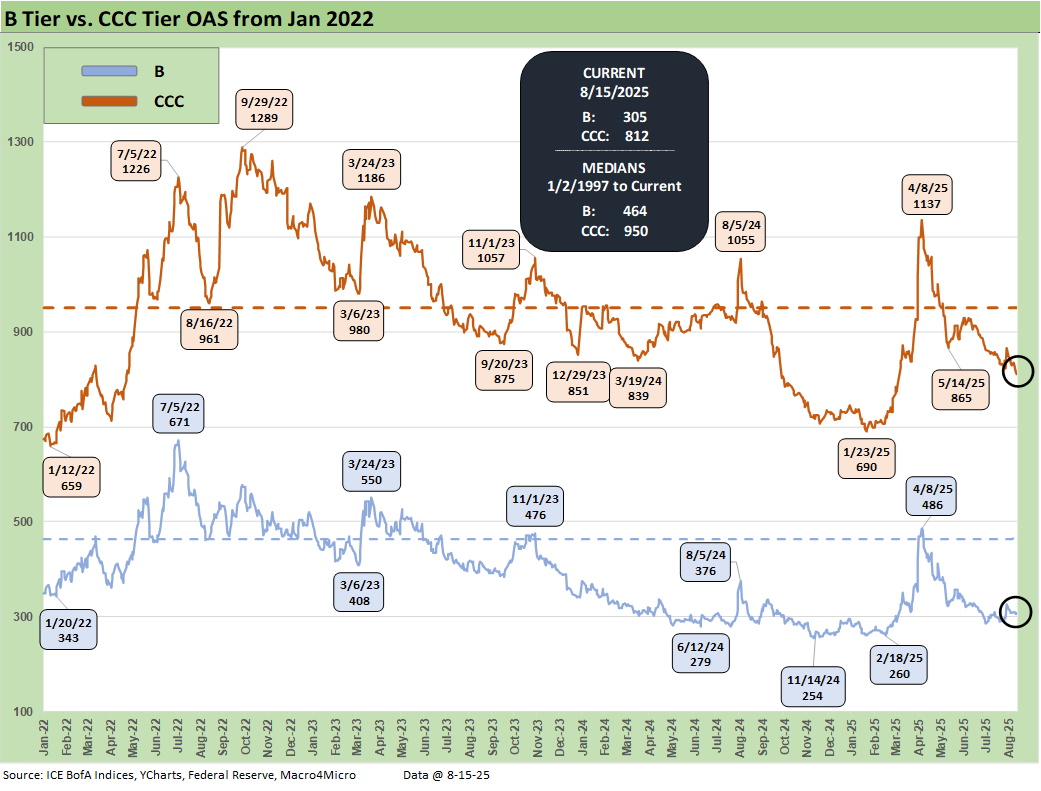
The shorter timeline from Jan 2022 just ahead of the end of ZIRP and start of the tightening cycle gives better granularity on the movements from a low for CCCs of +659 bps in Jan 2022 to a peak of +1226 bps in July 2022 and +1289 bps to end Sept 2022. Then spreads came down to the Jan 2025 tights of +690 bps ahead of the recent spike and whipsaw to current levels (+812 bps) that remain wide to those early 2025 lows. The above shows some of the divergence in the speed with which B’s have moved back below 2022-2024 levels when CCC’s remain elevated near those earlier levels.
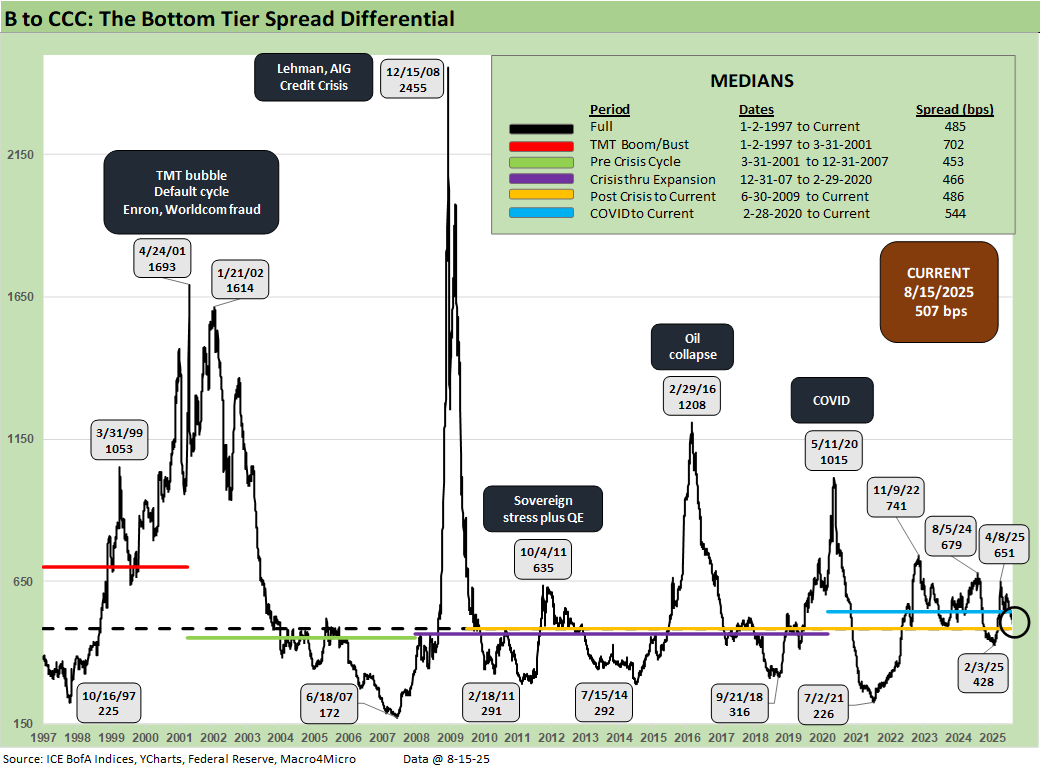
The B vs. CCC tier differential is broken out with the current +507 bps closing in towards the long-term median of +485 bps but still above the distinct market time horizons with the exception of the TMT HY credit cycle with its +702 bps median. The risks this year have seen CCC tier spreads remain wider by +66 bps YTD after the earlier whipsaw while the B tier is now at +9 bps wider YTD.
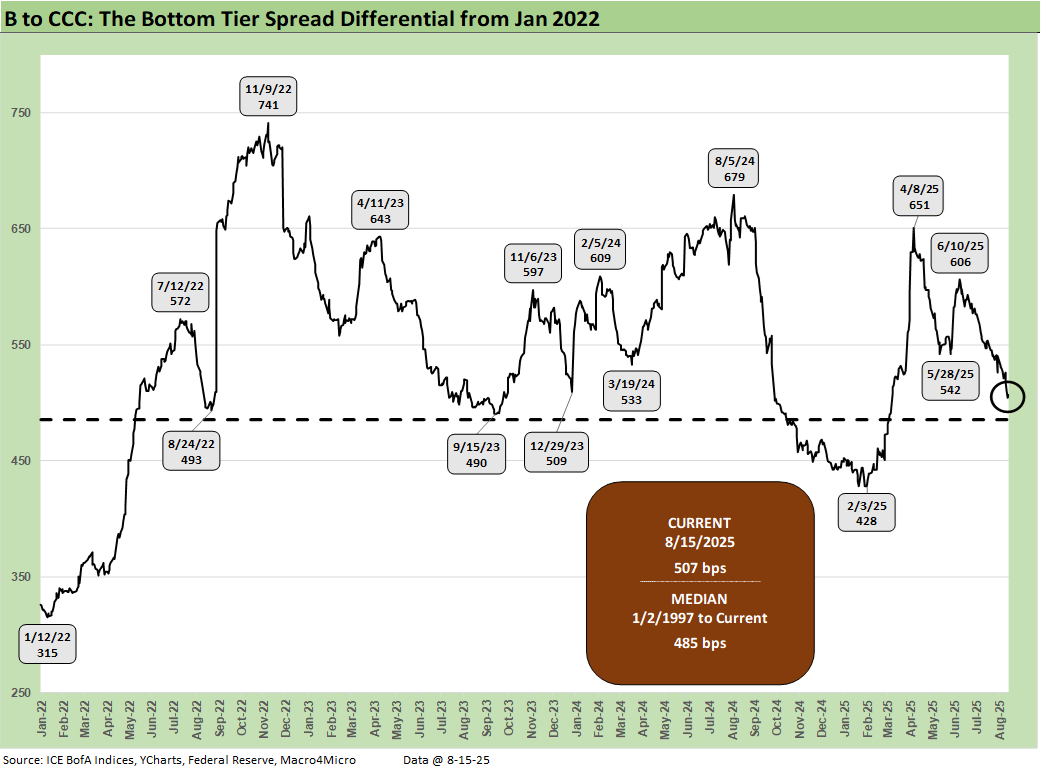
The above chart frames the “B vs. CCC tier” quality spread differential across the short timeline for better granularity. Quality spreads had widened with a vengeance after the +428 bps low of Feb 2025 to the early April spike of +651 bps on April 8. The subsequent rally sees this metric at +507 bps, moving slowly towards the long-term median but with significant risk of renewed widening.
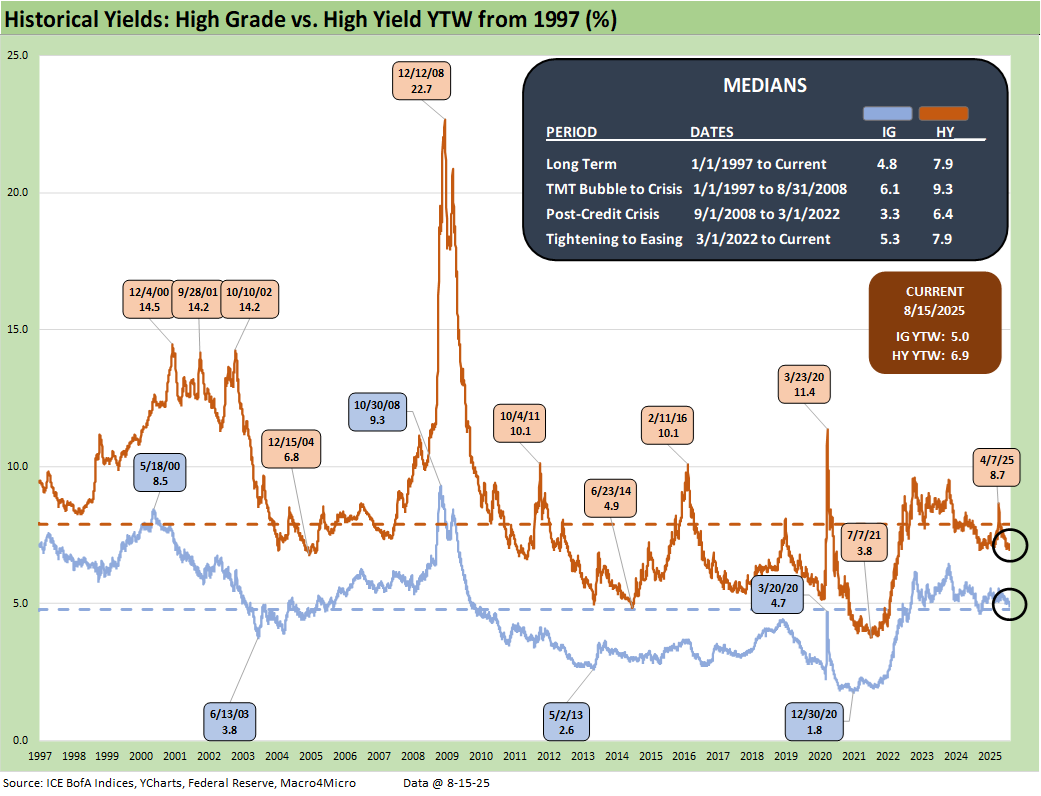
Moving away from spreads, which are well below long-term medians, yields for both IG and HY have a more complex story in historical context given the post-crisis distortions of ZIRP and “normalization.” The normalization period of Dec 2015 to Dec 2018 never really got on track with the economic weakness and Fed easing of 2019 followed by a COVID crisis and return to ZIRP in Mar 2020 (ZIRP ended March 2022).
As a reminder, 2018-2019 was the “Greatest Economy in History” according to the current White House resident. As we’ve covered in past commentaries, the numbers do not agree with that assessment – not even close.
The current IG YTW at 4.95% (vs. 4.98% last week) stayed largely flat with spread tightening offsetting another modest upward UST shift. IG YTW remains below the 6.1% pre-ZIRP median on overall YTD UST curve moves.
The HY YTW decreased to 6.92% this week (from 7.01%) vs. a pre-ZIRP 9.3% median. We consider the pre-ZIRP years the most rational frame of reference in light of the post-crisis ZIRP and QE as well as the COVID Fed reactions.
Spreads will remain a key swing factor for reaching those yield medians of pre-ZIRP years, and we just saw material volatility in credit risk pricing in HY since early April. UST yields are a tougher call with the tariff backdrop still threatening stagflation as well as the potential for a further technically driven upward UST curve shift on the supply-demand fears.
The stagflation debate just saw some material inflation signals this past week (core CPI, PPI) after we saw wavering employment numbers injected into the handicapping drill. Team Trump will try to rewrite that history with the help of a new candidate to head up the BLS. More White House rejection of unfavorable data, whether inflation or employment, could create more worries in the market including concerns around the direction of the dollar.
Away from stagnation + inflation, old fashioned recession risk would pressure UST rates lower and credit spreads higher, but this is no ordinary cyclical turn. We cover the UST shapeshifting in our separate Footnotes publication on the State of Yields as the UST curve continued to rise this week after the inflation data.
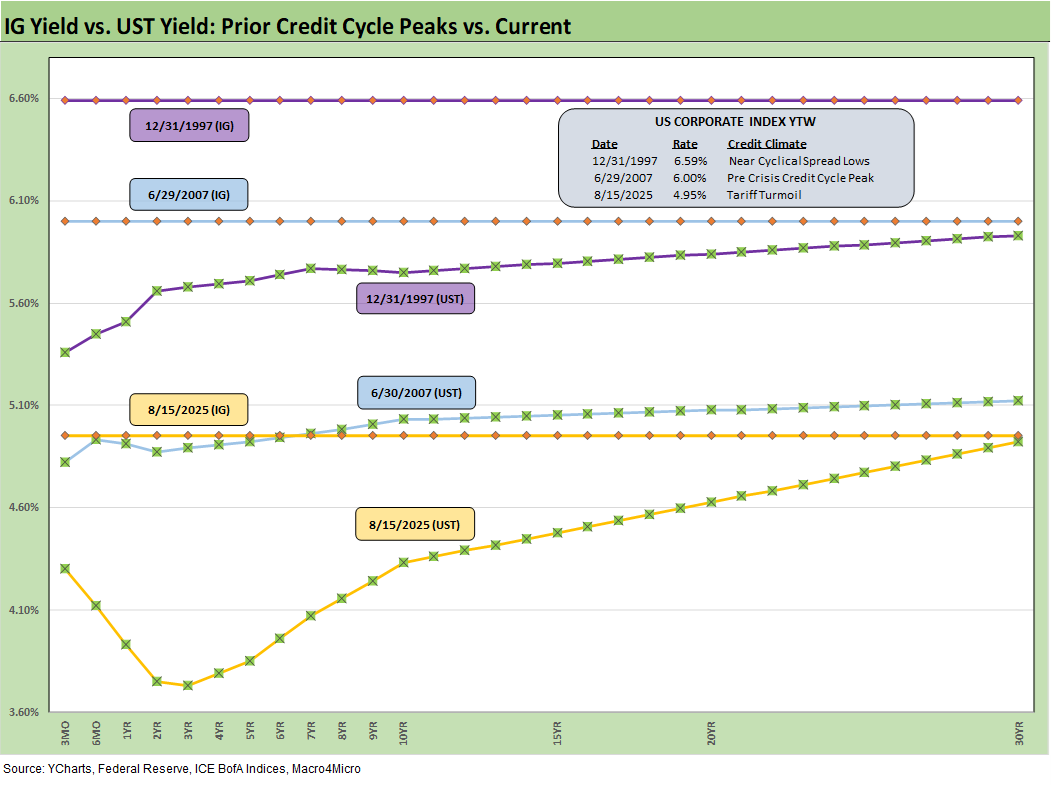
The above frames current IG index yields vs. previous credit peaks along with their respective UST curves. We include both prior credit peaks in June 2007 and Dec 1997 for context as prior peak credit cycles featured high risk appetites and saw investors chasing yields. Those 1997 and 2000 markets saw poor risk symmetry and low spreads.
Today’s UST curve is still low in the context of those historical credit peaks. We saw a recent glimpse of rising long yields along the timeline and the return pain that comes with it.
The focus remains on the budget deficit and UST supply as the main driver for duration risk here as we get clarity on the size of the deficit increase. Expected revenues flowing into the US Treasury from tariffs come with the potentially conflicting impact of lowering imports and undermining domestic tax revenue if the cycle weakens.
Reagan got a taste of disappointing tax revenues in the 1980s that caused him to reverse some tax policies (notably on the corporate side). The growth stimulus from the One Big Beautiful Bill may fall well short with few forecasts above 2% GDP growth in the markets. The Fed, OECD, World Bank, and many major banks had been calling for 1% handle US GDP growth this year and next. The market will be looking for more upward revisions in the fall after the FOMC meeting. The tariff impact vs. Fed action vs. tax bill benefits frames the debate.
Stagflation risks will stay in the mix with the current market beyond the credit cycle peak after the tariffs, and long-dated yields still could go easily higher along with spreads widening again for another round of return pain.
The weak dollar has had the effect of making tariffs even more expensive for US buyers. The dollar at one point had seen its worst performance since the 1970s with a mild recent rebound. That is the exact opposite effect of what Ryan and Brady were promising back in 2017 with their Border Adjusted Tax proposals (aka BAT Tax or tariffs). That plan was supposed to overhaul corporate taxes. The GOP controlled Senate dissed their plan and did not even consider it. Times change.
The short to intermediate IG market is still the safest bond game for now. The funds that are asset class constrained to HY can take refuge in the higher quality layers. Overall corporate default risks in HY bonds remain in check (private credit is its own distinct story and mix).
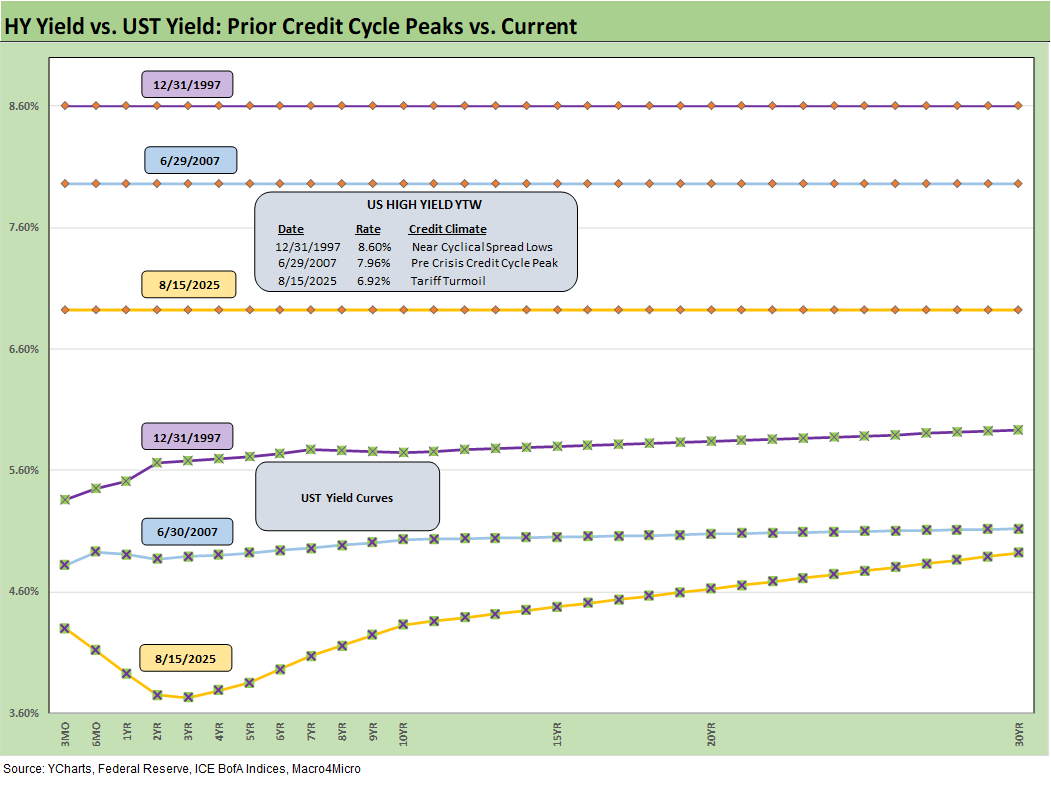
The final chart does the same 1997 and 2007 drill but for HY index yields. This week’s UST move leaves HY index yields below prior peak credit cycles at 6.92% as of Friday vs. 7.96% in June 2007 and 8.60% in Dec 1997. The recent spread widening had moved HY index yields higher, but the recent reversal and rolling UST moves leave the current HY index YTW well below both the 2007 peak and 1997 HY index levels.
The widening during April gave flashbacks to the volatility and major spread moves of the 1997-98 and 2007-08 periods that also posted triple-digit widening months. The sheer speed of risk repricing that has happened in earlier cycles and with the Liberation Day shock offers reminders even if those moves were for very different reasons.
We would highlight that the quality of the HY mix (industries and issuers) is superior today to those in 1997-1998 and 2007-2008. That is especially the case in the IG financial sector vs. 2008, where some securities firms and some banks were like a grenade with a loose pin.
Below we roll forward some updated commentary on the credit cycle…
The challenge is identifying a fundamental transmission mechanism to more trouble for financial metrics and relative risks of default. Identifying a catalyst for pain in the current market would highlight tariffs or trade wars hitting the macro drivers (the consumer) and micro drivers of corporate profitability and cost mitigation actions to offset the tariff expense. Trade war risk has subsided on EU’s apparent surrender and Japan taking what it could get. Canada and Mexico are still open questions. The oft misrepresented “buyer pays” reality will hit margins or require higher prices regardless.
The recent tariff strategy is both unpredictable and unprecedented in modern capital markets, but at least the banks are much healthier. The Aug. 1st deadline passing was trumped by the payroll headlines, but the Section 232 actions remain underway with a lot more slated to come with a 200% tariff threat to pharma a notable one.
The tariff attack on pharma could come at a lag of more than a year to 1 ½ years, but a year in the life of global supply chains (e.g. China-based ingredients, EU production) for US and high value-added manufacturing in EU and Asia is not very long. Such policies also entail immediate disruption and higher costs. One can only guess the fallout in pharma pricing, more trade conflict across supplier chains, and basic logistics.
The trade deal actions remain a threat to inflation, the economic cycle, and corporate profitability. Even as negotiations begin to resolve to more reasonable tariff levels, the approach damages alliances and creates a lot of justified distrust and potential animosity with major and minor trade partners. That creates opportunities for China to step into the relationship and geopolitical disarray.
There is still very little to show in final “deals” as frameworks still need granular detail and legally binding agreements. Japan has been a notable source of confusion and disagreement. Headlines await later this year on how many billions in tariffs will ultimately be an allocated cost by industry group and issuers and how “transitory” the inflation may be in macro context.
We also see higher quality levels in the HY bond index as a starting point vs. 2007 and the late 1990s TMT bubble years. The reality is the tariff impacts and supply-side disruptions are only now just beginning in substance.
China was a rough lesson for the markets. As we’ve now seen across the earnings season, the tariff cost estimates are rolling with notable examples in autos and retail. The latest increase in tariffs and effective dates may complicate that picture again.
It is useful for Trump to play his hand with pauses as the mood moves him in his own murky game theory plan, but corporate investment, big ticket purchase decisions by consumers, and FOMC policy setting can also take a protracted break as well. That would mean slower investment growth in many cases.
The bad old days…
Looking back even more, the turn in the credit cycle always comes at some point and often with an external trigger or “assist” that can set it off. During 1990, securities firms started to collapse including Drexel’s Chapter 11 in Feb 1990 and bridge loan related bailouts of Shearson Lehman, First Boston, and Kidder Peabody. We do not face that type of financial intermediary meltdown risk here (at least not yet). In a protracted stagflation bout, eyes will return to the regional banks.
The summer of 2007 was the start of major problems in the credit markets with asset risk and leveraged counterparty exposure and bank/broker interconnectedness risk soaring. Despite that backdrop that worsened in August 2007, the equity markets and S&P 500 and NASDAQ kept on rallying into Oct 2007. Later in the turmoil and well after the fact, the start of the recession was tagged as Dec 2007 (see Business Cycles: The Recession Dating Game 10-10-22).
The 2007 experience reminds the market that credit leads the economic cycle and equity lags. The same was true in 1999 with the HY default cycle underway and NASDAQ at +86% that year. This time around, the credit markets did not expect the tariff insanity. The initial spread wave in April quickly reversed but there could be fresh rounds. The China downside scenario was the worst and is now a lower risk. What is shocking was the poor White House grasp on the risks. China had a lot more tricks up its sleeve in supply strategies (e.g. pharma).
Buyer “writes the check” on tariffs. Facts matter.
The real economic effects are more geared to the periods ahead when tariffs will be rolling in at the transaction level. That will be the reality point. We expect HY to be unhappy again in the fall and spreads to average wider as the tariffs roll into actual corporate fundamentals.
There are no frictionless wheels in high tariffs. The buyer pays the tariff at customs (literally “writes the check”). How that gets spread around the economic chain from the seller to buyer to wholesale and end customer has a lot of moving parts.
The “seller pays” and “selling country pays” has been a clear falsehood from the Trump camp, and he admitted as much when he demanded that Walmart “eat” the tariff cost. Why would there be anything to eat if the seller pays? He has been out again each week repeating that with the latest tariff wave on the march to the deadline. The most recent was “India pays” the tariff.
Shady and misleading discourse is never new to Washington. Substitute the question “who writes the check to customs” for the “who pays the tariff” and it is easier to corral those who play semantics and tweak key words. The reality is that Trump never “collected hundreds of billions” from selling countries.
Trump recently highlighted his mega collection process yet again, reiterating the hundreds of billions he “collected” from selling countries. He even cited a hard number in one live session ($600 billion). We cannot tell what Trump remembers as a fact and what he made up. Until the tariff deals are put to bed, outsized “surprise risk” in tariffs remains high on the list. Since Trump essentially breached the USMCA, even a deal is not a reliable deal.
The EU “deal” has a lot of details missing, but that was good news in the sense the EU had been prepared to counter and fight. A trade war with the largest US trade partners would not have been well received by the market. The EU folded and is taking a lot of heat and plenty of mixed reviews in the EU media.
See also:
Herc Holdings Update: Playing Catchup 8-17-25
Footnotes & Flashbacks: State of Yields 8-17-25
Footnotes and Flashbacks: Asset Returns 8-16-25
Mini Market Lookback: Rising Inflation, Steady Low Growth? 8-16-25
Industrial Production July 2025: Capacity Utilization 8-15-25
Retail Sales Jul25: Cautious Optimism in the Aisles 8-15-25
PPI: A Snapshot of the Moving Parts 8-14-25
CPI July 2025: Slow Erosion of Purchasing Power 8-12-25
Iron Mountain Update: Records ‘R’ Us 8-11-25
Mini Market Lookback: Ghosts of Economics Past 8-9-25
Macro Menu: There is More Than “Recession” to Consider 8-5-25
Mini Market Lookback: Welcome To the New World of Data 8-2-25
Happiness is Doing Your Own Report Card 8-1-25
Payrolls July 2025: Into the Occupation Weeds 8-1-25
Employment July 2025: Negative Revisions Make a Statement 8-1-25
Employment Cost Index 2Q25: Labor in Quiet Mode 7-31-25
PCE June 2025: Prices, Income, and Outlays 7-31-25
2Q25 GDP: Into the Investment Weeds 7-30-25
2Q25 GDP: First Cut of Another Distorted Quarter 7-30-25
United Rentals: Cyclical Bellwether Votes for a Steady Cycle 7-29-25
JOLTS June 2025: Lower Openings and Hires, Higher Layoffs YoY and Flat MoM 7-29-25
Mini Market Lookback: Mixed Week Behind, Big Week Coming 7-26-25
Durable Goods Jun25: Air Pocket N+1 7-25-25
Taylor Morrison 2Q25: Resilient but Feeling the Same Macro Pressure 7-25-25
New Home Sales June 2025: Mixed Bag 7-24-25
Existing Home Sales June 2025: The Math Still Doesn’t Work 7-23-25
PulteGroup 2Q25: Still-Lofty Margins see a Mild Fade 7-23-25
D.R. Horton 3Q25: Material Slowdown Still Good Enough 7-22-25
Mini Market Lookback: Macro Muddle, Political Spin 7-19-25
Housing Starts June 2025: Single Family Slips, Multifamily Bounces 7-18-25
Retail Sales Jun25: Staying Afloat 7-17-25
June 2025 Industrial Production: 2Q25 Growth, June Steady 7-16-25
CPI June 2025: Slow Flowthrough but Starting 7-15-25
Mini Market Lookback: Tariffs Run Amok, Part Deux 7-12-25
Mini Market Lookback: Bracing for Tariff Impact 7-5-25
Asset Return Quilts for 2H24/1H25 7-1-25
JOLTS May 2025: Job Openings vs. Filling Openings 7-1-25
Midyear Excess Returns: Too little or just not losing? 7-1-25