
2Q25 GDP: First Cut of Another Distorted Quarter
2Q25 GDP (advance est.) sees another round of major headline distortions in Net Exports and Private Inventory. Consumer PCE and GPDI were weak.


Nothing quite like a clear picture
The swings in imports and exports and changes in private inventory are the typical distortion lines each quarter, and 2Q25 saw +4.99% positive contribution to GDP after -4.61% in 1Q25. The change in private inventories was -3.17% in 2Q25 after +2.59% in 1Q25 (Table 2 of release). This was heavily about the tariff working capital strategies.
For the most important economic activity lines and deltas (Table 1 of release), 2Q25 PCE posted +1.4% in a rebound from 1Q25’s +0.5% but still at the second lowest since 2Q23.
Gross Private Domestic Investment (GPDI) posted -15.6%, down from +23.8% in 1Q25. The lines under GPDI showed “Fixed Investment” at +0.4% with Nonresidential at +1.9% (down from +10.3% in 1Q25) and Residential at -4.6% (down from -1.3% in 1Q25). The biggest hit in Nonresidential in 2Q25 was Structures at -10.3%.
Government consumption and investment weighed in at +0.4% (up from -0.6% in 1Q25). The 2Q25 +0.4% was the second lowest (ahead of 1Q25) since 2Q22 in the peak inflation quarter and start of the tightening cycle.
The PCE price index number of 2.1% for 2Q25 was good news vs. 1Q25 at +3.7% and the 2.5% for Core PCE for 2Q25 was down sequentially from +3.5%. The market anxiously awaits the June PCE and consumer income and outlays release due tomorrow.
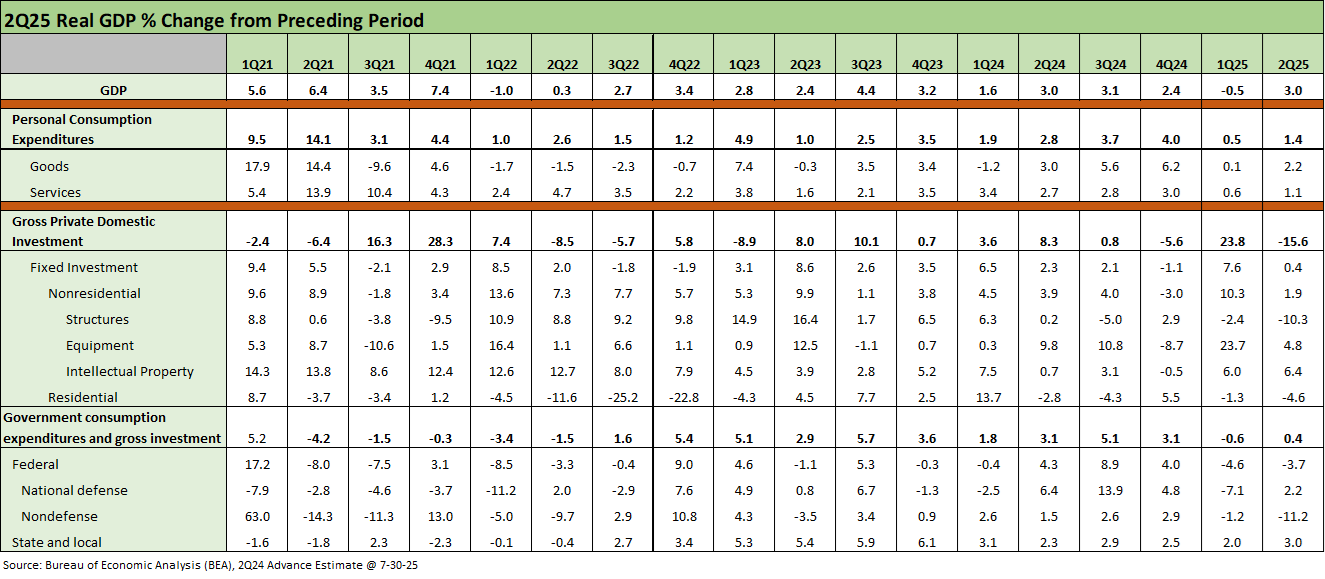
The above table breaks out the timeline for the main moving parts of the GDP lines we watch in Table 1. We look at Table 2 for the relative contributions of the big distorters such as Net Exports of Goods and Services (+4.99% in 2Q25) and “Change in Private Inventories” (-3.17% in 2Q25). Those two taken together amounted to +1.82% after the same two lines amounted to -2.02% in 1Q25.
When you look beyond those two 2025 quarters along the past 25 years, the 2Q25 GDP growth was just another weak quarter consistent with the poor growth history of the post-2000 administrations. That is the case on both sides of the aisle with some banner periods occasionally posted after some brutal event-driven weakness (COVID being the worst plunge and best rebound).
For some history of what impressive economies look like, see Presidential GDP Dance Off: Clinton vs. Trump (7-27-24) and Presidential GDP Dance Off: Reagan vs. Trump (7-27-24). For a history on the GDP growth rate counts since the Carner years, see The Politics of Objective GDP Numbers: “Flex Facts” on Growth (10-30-24). The sense is that political partisans always rely on adjectives and skip the most relevant numbers since they often get in the way of a false story line. The reality is a debt-heavy sovereign balance sheet typically leads to slow growth (see This Time is Different). That is where the US is now, and the balance sheet is getting worse – regardless of who is in the White House.
Into the major GDP lines…
We summarized the main line items in the bullets, and the Personal Consumption Expenditures line always rules. For 2Q25, PCE was 68% of GDP with Goods PCE at 21% and Services PCE at 47%. The GPDI line was 18%, and the Government Line at 17%. The “Net exports” line was down to -3.0%.
The strange “goal” in Trump’s tariffs is to eliminate the -3.0% while putting the 68% at risk. The theory is the lower -3.0% will be joined by materially higher GPDI with the reshoring and full redeployment of non-US capacity (autos, mining, pharma, etc.). The trick (and the worry) is that the process is largely being funded by corporate expense lines and potentially consumers via price increases. The simple way around that risk is to say “seller pays.” That is both simple and dishonest since the buyer writes the check to customs. The assumption that the seller pays is that 100% of the tariff is covered by seller price cuts to make the buyer whole. Good luck with that.
The worry for the moving parts of GDP is that elasticity of demand matters. That said, it will take months for adjustments to be made and work their way through the system via working capital cycles, capex programs, and relocations, etc. Tariff advocates want to pretend the debate is already over to run with the story line of “tariffs do not cause price increases.” That will become more evident in the MoM CPI lines reported each month and from the household consumer shopping experiences.
There are the “pass through vs. buyer eats the tariff” theories, but there is also the simple reality of supply and demand during the transition process. Besides taking years, the sale of lower cost or proprietary offshore products (e.g. apparel from Asia, pharma from Europe, metals from resource rich regions, etc.) can shift the supply-demand balance and take prices higher the old-fashioned way. That is, supply-demand imbalances run their natural course and prices often rise. We got a taste of that after COVID.
A lot of information and disinformation flows lie dead ahead.
GDP comments:
1Q25 GDP: Final Estimate, Consumer Fade 6-26-25
1Q25 GDP 2nd Estimate: Tariff and Courthouse Waiting Game 5-29-25
1Q25 GDP Advance Estimate: Roll Your Own Distortions 4-30-25
1Q25 GDP: Into the Investment Weeds 4-30-25
Trump's “Greatest Economy in History”: Not Even Close 3-5-25
Gut Checking Trump GDP Record 3-5-25
Presidential GDP Dance Off: Clinton vs. Trump 7-27-24
Presidential GDP Dance Off: Reagan vs. Trump 7-27-24
2024:
4Q24 GDP: The Final Cut 3-27-25
4Q24 GDP: Inventory Liquidation Rules 1-30-25
GDP 3Q24: Final Number at +3.1% 12-19-24
2Q24 GDP: Final Estimate and Revision Deltas 9-26-24
State Unemployment: A Sum-of-the-Parts BS Detector 6-30-24
1Q24 GDP: Final Cut Moving Parts 6-27-24