
CPI July 2025: Slow Erosion of Purchasing Power
The latest CPI remains biased higher, but the CPI tariff impact pace is slow. Both sides of the political debate remain well armed.


No beef. I’ll have the chicken. Hold the lettuce and tomato please.
While signs of inflation and trade impacts can be found in some key product groups, the total impact on CPI has been mild so far with a flat headline CPI at +2.7% YoY (+0.2% MoM) while Core CPI ticked up to +3.1% (+0.3% MoM) from +2.9%.
For some other high level specialized aggregate indexes (Table 3), we see All items less shelter at only +2.1% YoY (+0.2% MoM). Total Services was at +3.8% (+0.3% MoM) and Services less rent of shelter was at +4.0% (+0.3% MoM).
Total Food remains in check at 2.9% YoY with Food at home +2.2% YoY (-0.1% MoM) and Food away from home +3.9% (+0.3% MoM). Energy deflation at -1.6% YoY (notably motor fuel/gasoline) provided headline CPI support, but Electricity remains at +5.5% YoY even after a mild July number (-0.1% MoM).
We have seen some Durable Goods CPI impact from tariffs in the sequential move to +0.4% MoM, but that is from a level that had been in deflation mode with Durables only +1.2% YoY. That will likely rise through the end of 2025 on materials costs (steel, aluminum, components, etc.) with pressure on supply chains and finished goods imports.
We cover Apparel below in the charts, but the timing of those recent heavy tariffs on low-cost Asian countries will take more months to show up in transactions, with later deliveries and seasonal patterns.
The tariff headwinds will point at food groups such as Tomatoes (+3.3% MoM), Lettuce (+4.0% MoM), Coffee (+2.3% MoM), and Beef (+1.5% MoM on beef and veal, Uncooked Beef Steaks +2.3% MoM). Overall, Food at home was only -0.1%. For YoY, Meats posted CPI of +5.8%, Beef and Veal +11.3%, but Poultry was only +3.1%. Coffee was +14.5% YoY.
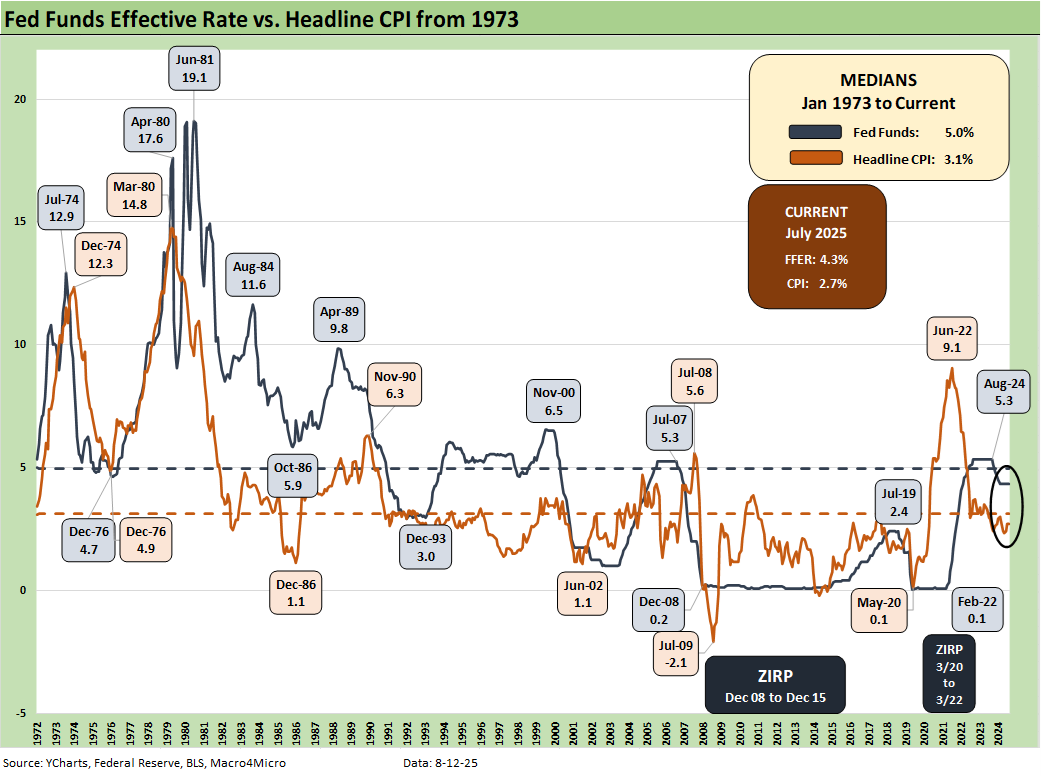
The above chart is our usual update of headline CPI across the cycles plotted against fed funds. Those of us who came of working age back in the 1970s stagflation years fully appreciate the caution of the FOMC about the tariff effects on inflation and GDP growth. Their desire to come to grips with the flow-through effect of tariffs is rational and not partisan. Stagflation is the worst enemy.
The FOMC is aware that the tariff is paid by the buyer to customs and not by the selling country and thus a cash expense to the importer. Trump keeps saying the opposite and his trade team will not state that basic fact in the interest of career preservation. Bessent finally admitted that the buyer pays customs after being persistently questioned in one Q&A session on Morning Joe (“Who writes the check?”). It took multiple attempts in that interview even at this late stage during the same week Trump claimed that “India pays the tariffs.”
As framed in the chart, the stagflation years of the early 1970s after the Arab Oil Embargo of Oct 1973 and in the 1980-1982 double dip were ugly times for the economy as macro shocks and industry restructurings were exacerbated by a need to adapt strategies and cost structures to rapid deregulation across many sectors.
The chart offers a reminder that current headline CPI (2.7%) is below the long-term median for CPI (3.1%) and ended 2024 below that line (Dec 2024 CPI at 2.9%). Fed funds is also lower than the long-term median of 5.0%. Even with all those ZIRP years and the very low UST normalization period from late 2008 to March 2022, the fed funds rate offers a comfortable incremental cushion above CPI of 1.6 points currently. Trump has called for 300 bps of easing, and that would send that fed funds vs. CPI differential into the negative zone.
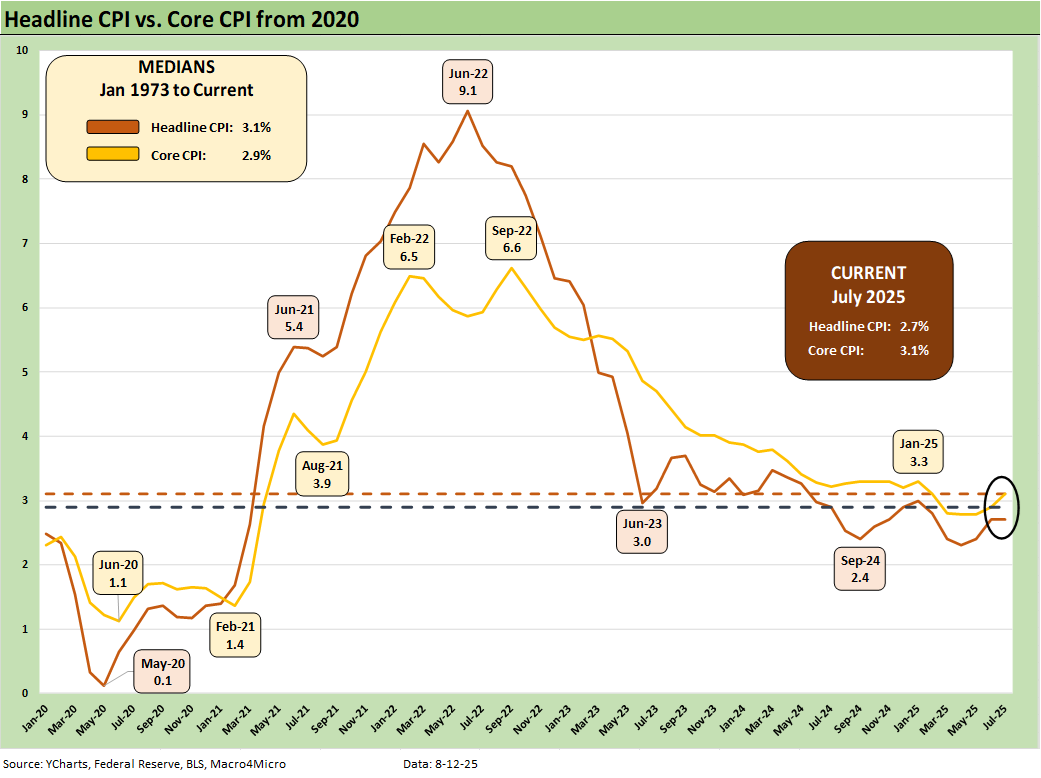
The above chart updates the running Headline CPI vs. Core CPI from 2020 for a frame of reference that is heavily wagged by energy. We frame recent numbers vs. the post-1973 medians in the box in the upper left of the chart. We are below the long-term headline CPI median but the June Core of +3.1%, which ticked up sequentially from +2.9%, is now flat to the long-term median from 1973. The partisan statement by Trump that “We have no inflation” should read “We are at median Core CPI inflation.”
The headline inflation including food and energy gets into the wild ride of energy across cycles (see Inflation: The Grocery Price Thing vs. Energy 12-16-24). We covered some notable food groups in the bullets above with mixed CPI profiles by line item. Food and energy are commodities, so there is a reason core has been embraced as a favored metric over the years (see Inflation Timelines: Cyclical Histories, Key CPI Buckets11-20-23).
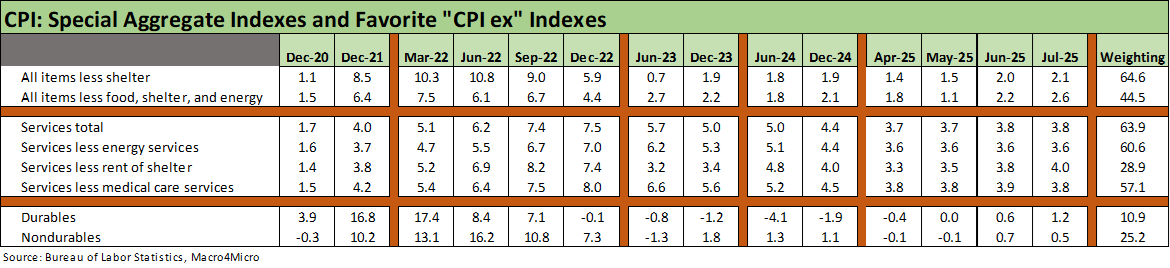
The above table highlights some more specialized CPI indexes (the “CPI ex” lines), and these still look good on an ex-shelter basis. Goods (Durables and Nondurables) are low, but the Durables CPI is trending higher now as it has exited its deflation zone on the back of tariff pressures. Services remain a challenge across a few variations with shelter or ex-shelter.
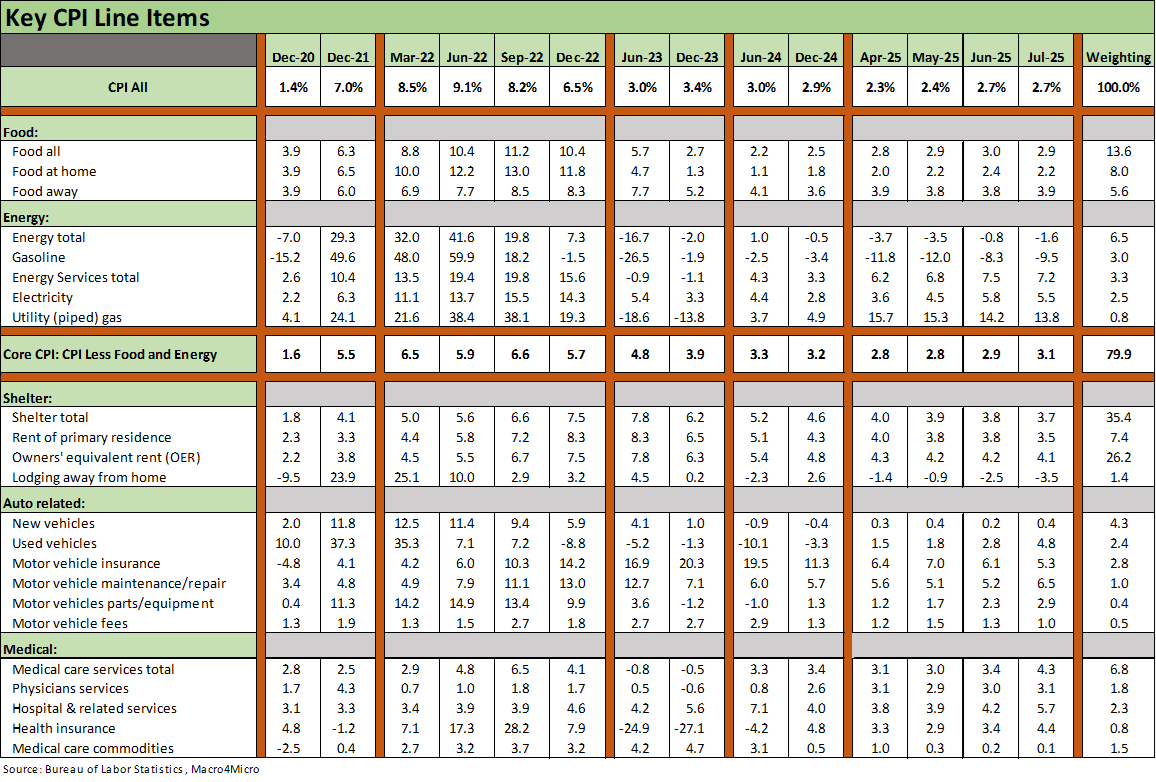
The Big 5 groupings above include our own version of the automotive mix (see Automotive Inflation: More than Meets the Eye 10-17-22). The automotive chain from supplier to OEMs will be one of the most negatively impacted industry groups in the mix with supplier chains in danger and OEMs likely to take heavy tariff expenses near term as they develop strategies to minimize the damage without roiling their critical dealer networks and alienating retail customers.
While the flow-through of direct tariff impacts on supplier chain inputs across materials and the tech chain (semis, integrated components from offshore, etc.) will be costly, the adjustments to sourcing will include lost volumes and impaired economics of non-US assembly lines and imported finished vehicles (e.g., Mexico and Canada capacity).
The industry trade literature is all over the map on how much will eventually get passed on through the chain to retail buyers, but new vehicle prices have been minimally affected overall to this point as the major US-based OEMs eat the costs and plan their responses. They need to take stock of what Japan and Korean OEMs will be doing as the smoke clears on their ill-defined trade “deals.” The OEMs will also need to address “cost sharing” with their supplier chains.
So far, the new vehicle CPI fallout has been minimal, but we are starting to see the logical uptick in used vehicle prices to a +4.8% YoY (+0.5% MoM). The affordability challenge for vehicles (new or used) and the potential for lower available supply is expected to keep upward pressure on used car prices ahead of the timeline when more of the costs flow into new vehicles.
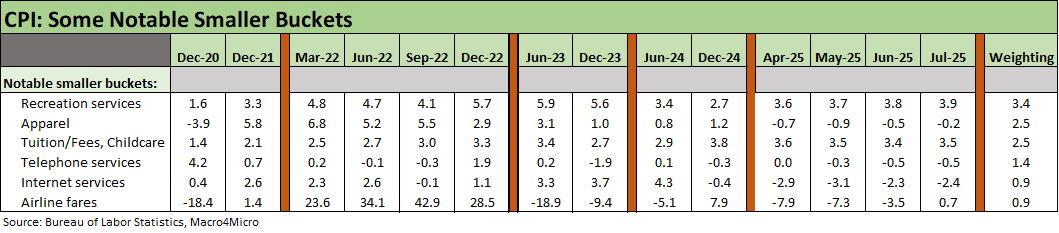
The above table shows some of the mainstream household items, and the most notable highlight is that apparel has been held in check. For apparel, there are some big question marks for the fall and winter as the low-cost labor arbs (notably the newly assigned tariffs in Asian countries) feel the impact of high tariffs at customs. That will go hard on retailers and consumers. High tariffs on low margin retailers speaks for itself – it is trouble. China is on another 90-day pause while Mexico is also on an extension. Those are both major “labor arb” trade partners.
See other Inflation Related:
PCE June 2025: Prices, Income, and Outlays 7-31-25
CPI June 2025: Slow Flowthrough but Starting 7-15-25
PCE May 2025: Personal Income and Outlays 6-27-25
CPI May 2025: The Slow Tariff Policy Grind 6-11-25
Employment Cost Index 1Q25: Labor is Not the Main Worry 5-1-25
Inflation: The Grocery Price Thing vs. Energy 12-16-24
Inflation Timelines: Cyclical Histories, Key CPI Buckets11-20-23
Fed Funds – Inflation Differentials: Strange History 7-1-23
Fed Funds, CPI, and the Stairway to Where? 10-20-22
Automotive Inflation: More than Meets the Eye10-17-22
Inflation: Events ‘R’ Us Timeline 10-6-22
Recent Tariff commentary:
US-Italy Trade: Top 15 Deficit, Smaller Stakes 7-18-25
US-France Trade: Tariff Trigger Points 7-17-25
Germany: Class of its own in EU Trade 7-16-24
US-Canada Trade: 35% Tariff Warning 7-11-25
India Tariffs: Changing the Music? 7-11-25
Taiwan: Tariffs and “What is an ally?” 7-10-25
US-Trade: The 50% Solution? 7-10-25
Tariff Man Meets Lord Jim 7-8-25
South Korea Tariffs: Just Don’t Hit Back? 7-8-25
Japan: Ally Attack? Risk Free? 7-7-25
US-Vietnam Trade: History has its Moments 7-5-25
US Trade in Goods April 2025: Imports Be Damned 6-5-25
Tariffs: Testing Trade Partner Mettle 6-3-25
US-UK Trade: Small Progress, Big Extrapolation 5-8-25
Tariffs: A Painful Bessent Moment on “Buyer Pays” 5-7-25
Trade: Uphill Battle for Facts and Concepts 5-6-25
Ships, Fees, Freight & Logistics Pain: More Inflation? 4-18-25
Tariffs, Pauses, and Piling On: Helter Skelter 4-11-25
Tariffs: Some Asian Bystanders Hit in the Crossfire 4-8-25
Tariffs: Diminished Capacity…for Trade Volume that is…4-3-25