
PCE June 2025: Prices, Income, and Outlays
Headline PCE was slightly warm, but signs of MoM inflation pressure are showing up along the Goods lines.


Time for some freeze tag?
The PCE inflation line at +0.3% MoM will be the start of a priority focus on MoM trends in the price index to gauge hints (or clear signs) of sequential inflation pressure. Despite that need, the YoY numbers still win the headlines with headline PCE at +2.6% (up from +2.4% in May). Core PCE inflation YoY was flat MoM at +2.8%.
Trump wants to cut fed funds to levels 300 bps below those PCE price indexes while at the same time talking about the greatest first 6 months in Presidential history. That gets a low score on the conceptual consistency meter.
The Goods PCE price line was +0.4% MoM (vs. May +0.1%). The Durable Goods line ticked higher as the MoM price index rose to +0.5% from 0.0% with Furnishings and Household Equipment at +1.3% in June from +0.6% in May. Interestingly, Motor Vehicles/Parts were -0.4% (vs. -0.1%) in May as the OEMs wrestle with their tariff and cost strategy. A lot of costs are being eaten there as covered in Auto OEM earnings.
Nondurable Goods PCE prices MoM rose to +0.4% MoM from +0.1% in May. Notable increases in Nondurables include Clothing and Footwear at +0.4% (up sequentially from -0.4%). The back-to-school season with the new tariffs will be interesting.
The Services PCE price line was flat MoM at 0.2% and YoY for Services was flat at +3.5%. The Household personal consumption expenditure line for Services saw PCE prices rise slightly to +0.3% from +0.2% while Health Care as a subsector of that line rose to +0.4% from +0.1%
Real consumption expenditures overall were muted at +2.1% YoY and a multi-month low (vs. +2.2% in May) while Disposable Personal Income ran below PCE at +1.7% YoY (flat to May). Real spending on Goods was +2.9% (tied with May for a multi-month low) with Services at +1.7% for another multi-month low. The trends overall show a more guarded consumer in a continuation of recent trends.
Below we update our rolling commentary on past and present PCE inflation and Income and Outlays updated for the most recent data:
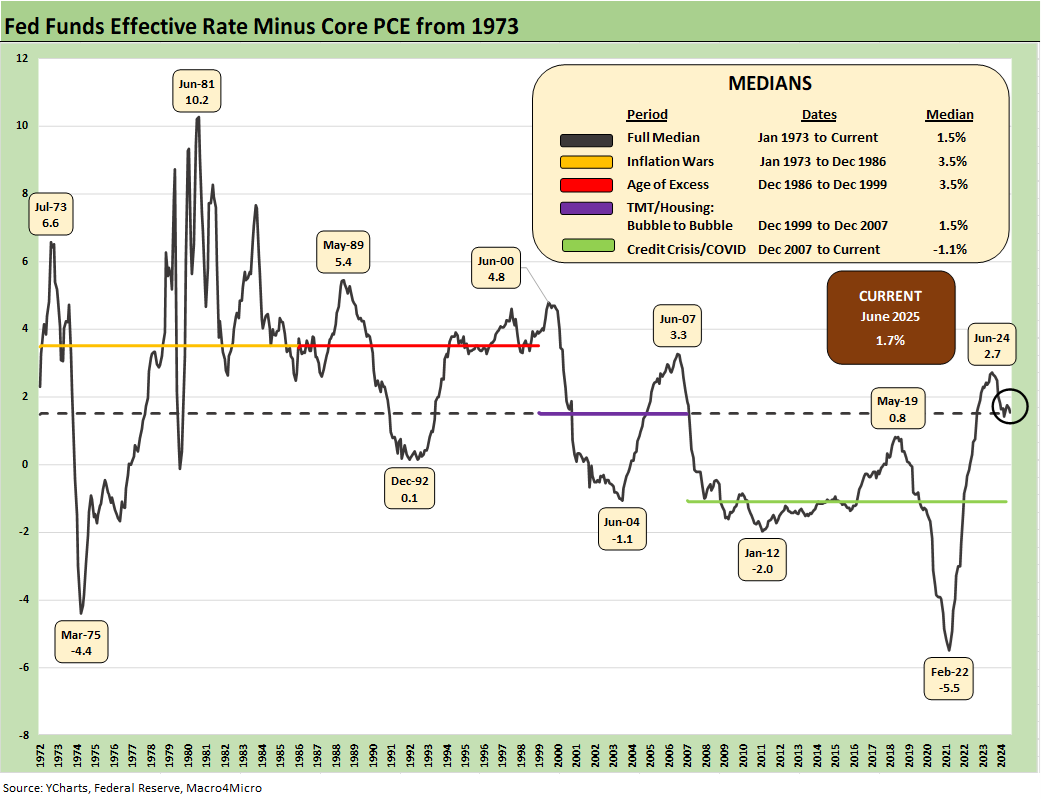
The above time series updates the “fed funds minus Core PCE” differential since 1973 for a read on “real fed funds” and to what extent the Fed is engaged in “real” tightening as opposed to the “closet accommodation” that we saw in much of 2H22 when tightening was moving into higher gear but badly lagging inflation.
The long-term differential is +1.5%, and the differential now is +1.7%, flat to May. That leaves room for easing, but the final judgement on actions comes down to how you see the tariff threat and what that might mean for forward inflation or stagflation risk.
With more tariffs “officially set” and a few major ones open (notably Canada and Mexico with China always an adventure), the threat of what has been an open-ended risk on the “reciprocal” (but actually not reciprocal) tariffs have been largely quantified with a schedule to be semi-solidified as of Aug 1 (tomorrow). We saw South Korea set and Mexico get a fresh extension in the last 24 hours.
The 1.7% differential on fed funds vs. Core PCE does not leave much room in that differential for a materially adverse move in Core PCE at current fed funds rates. A move higher in inflation from tariffs could push that number well inside the median differential of 1.5% and even send the metric into negative range. Anyone who experienced 2022 (let alone those of us ringside for 1974-1975 and the 1979-1982 ride) remember that inflation numbers can move quickly.
The expectation of 2 cuts in 2025 leaves the FOMC room to maneuver, but Trump will continue to rant and rave given his anger over facing a rare pocket of institutional control that he lacks. Remember that an independent Fed was a great help to Trump in 2019 as the Fed cut rates in the face of lagging exports and weaker capex during a period that Trump gas called the “greatest economy in history” (Why did it need help?).
An independent Fed also saved the credit markets and arguably the banking system from a crisis with their active use of a wide range of support tools starting in March 2020. During that period, it is worth remembering that at more than a few points Trump demanded a negative fed funds rate. Then his GOP Congressional allies would blame Powell for moving rates too low even at ZIRP.
The Fed actions in 2020 would be blocked by some of the “reforms” that Trump and the Project 2025 playbook are calling for (see Chapter 24 of Project 2025). The architects of Project 2025 are seeing this message creeping into Bessent commentary and potentially into legislation down the line. That is worth keeping on the radar screen as a hand-picked, in-substance subordinate gets chosen to run the Fed in 2026.
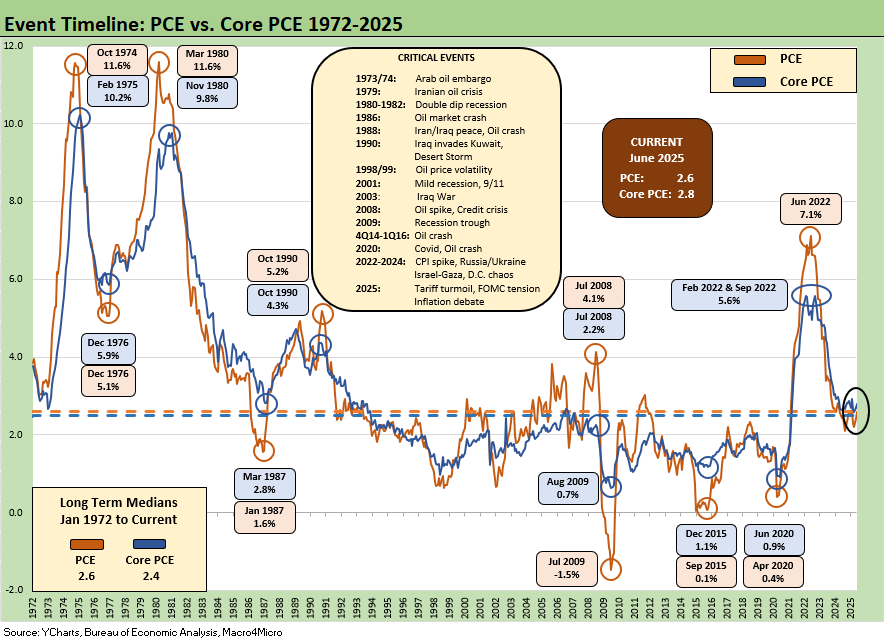
The above chart updates the long-term time series for PCE vs. Core PCE across the decades and cycles. We see the 2.6% headline PCE long term median in the lower left (flat to the current 2.6%) and the 2.4% Core PCE median (vs current 2.8%). That is dramatically better than where we came from in 2022 but still above the 2.0% target. The June 2025 PCE numbers are good levels in long term context, but they just moved in the wrong direction again at a time when the FOMC is bearish on the PCE inflation forecast.
In the absence of the tariff uncertainty, the Fed might have room to cut sooner, and Powell said as much multiple times. That set Trump off on round N+1 of insulting Powell. The attacks on Powell are a constant from Trump (who states that “the seller pays the tariff”). Trump has the new FHFA head Bill Pulte joining the tirade. Pulte’s economic credentials are that he majored in Broadcast Journalism and is a descendant (grandson) of the legendary founder of Pulte Group. (He is thus a fellow traveler with Trump in the silver spoon club).
Trump has also enlisted the architect and co-author of Project 2025 and now head of the OMB, Russell Vought, who can call on his nonexistent capital markets experience and lack of economics background (and his Political Science degree from a small Midwestern evangelical college) for his thoughts. Project 2025 seeks to change the Fed mandate and give control to elected officials.
As the medians above highlight and the following charts show, it takes a lot to go wrong to get sustained 2.0% PCE inflation. What no one in the White House seems inclined to point out in the FOMC bashing is that multiple trade wars could cause more than a few economic calamities including stagflation. So far, Trump has dodged that bullet with China and more recently with the EU, the #1 trade partner of the US. The absence of documentation and clarity keep the risks of disagreement high.
We are still not getting a full-throated admission from Trump that the buyer pays the tariff although his threats against retailers on price increases imply as much. The 2Q25 earnings season has left no doubt on who pays the tariffs in fact (the buyers write the check to customs) and in economic terms (note the auto OEM earnings reports). The impact from sellers to buyers to supplier chain intermediaries to finish goods producers to retailers and customers will take months to sort out. Watching the monthly MoM CPI and PCE price differentials will be a regular exercise for tangible evidence of the real story.
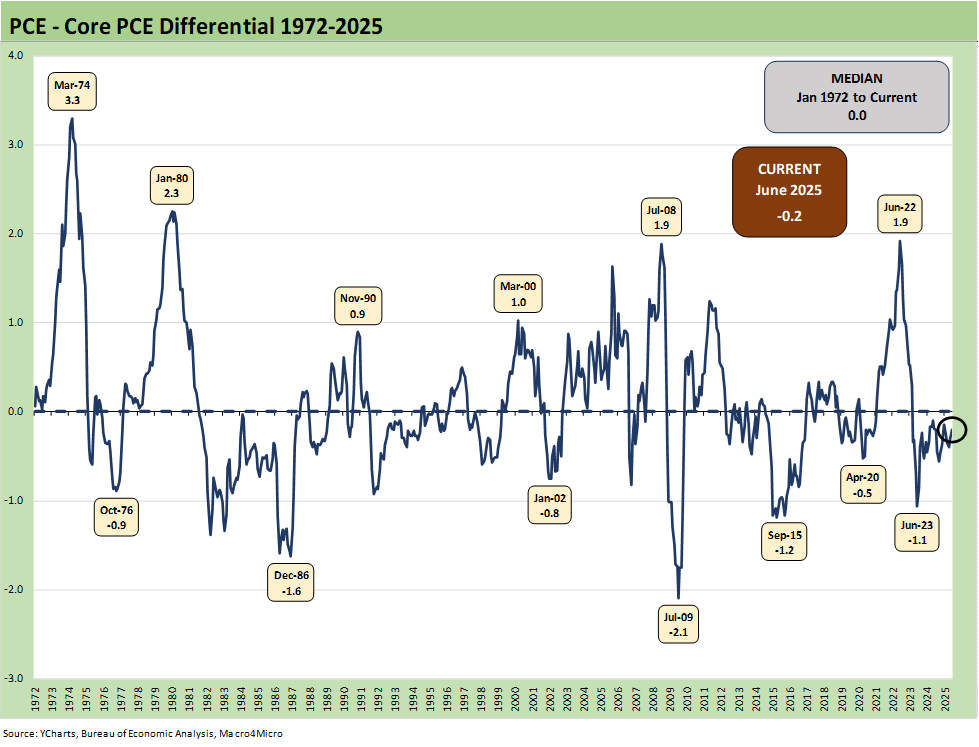
The above chart frames the long-term differential history between PCE and Core PCE since 1972. The long-term differential is zero and we currently stand at -0.2%. The volatility around that compressed long-term median ties into the energy wildcard with some food distortions also back in the 1970s. We look at some of the CPI energy and food inflation moves in separate commentaries (see Inflation: The Grocery Price Thing vs. Energy 12-16-24, Inflation Timelines: Cyclical Histories, Key CPI Buckets11-20-23).
The oil X factor will remain one that Trump and team want to work in their favor. The recent Iran bombings and brief but intense Israel-Iran clash brought a short-lived scare as WTI climbed to near $74 before dipping back to the mid-60s compared to WTI at $60 at the end of May. Iran’s inability to respond and the lack of further escalation eased anxieties along the energy inflation chain. Trump continues to keep the heat on Iran. Iran + Russia = a lot of supply to handicap.
Now we move into the tariff threats by Trump against buyers of Russian oil as he seeks to end the Ukraine war. WTI bounced back to higher levels and is over $69 as we go to print. We expect China to ignore the threats, but India reportedly has temporarily suspended purchases according to some trade headlines as India wrestles with Washington on a trade deal.
Eventually, Russian oil supply back on the market would satisfy the oil price plunge ambitions even for Core PCE since the energy bill flows into goods and services costs and can impact PCE ex-Food and Energy. Lower energy costs also bolster consumer confidence in the peak driving season and are supportive of the ag sector as well as easing freight and logistics costs.
Rooting for Russian supply for the wrong reasons clearly has its limitations with the fate of Ukraine a sticking point. A more material trade clash with Canada and the overt hostility shown that country by Trump would be bad for the US and Canada and raise oil price uncertainty with Canada by far the largest importer of crude with very attractive economics for US refiners. The tariff process is hopefully in the home stretch with Canada, but Trump appears to be looking for more reasons to come down hard on Canada including their recent support for a two-state solution for Palestine.
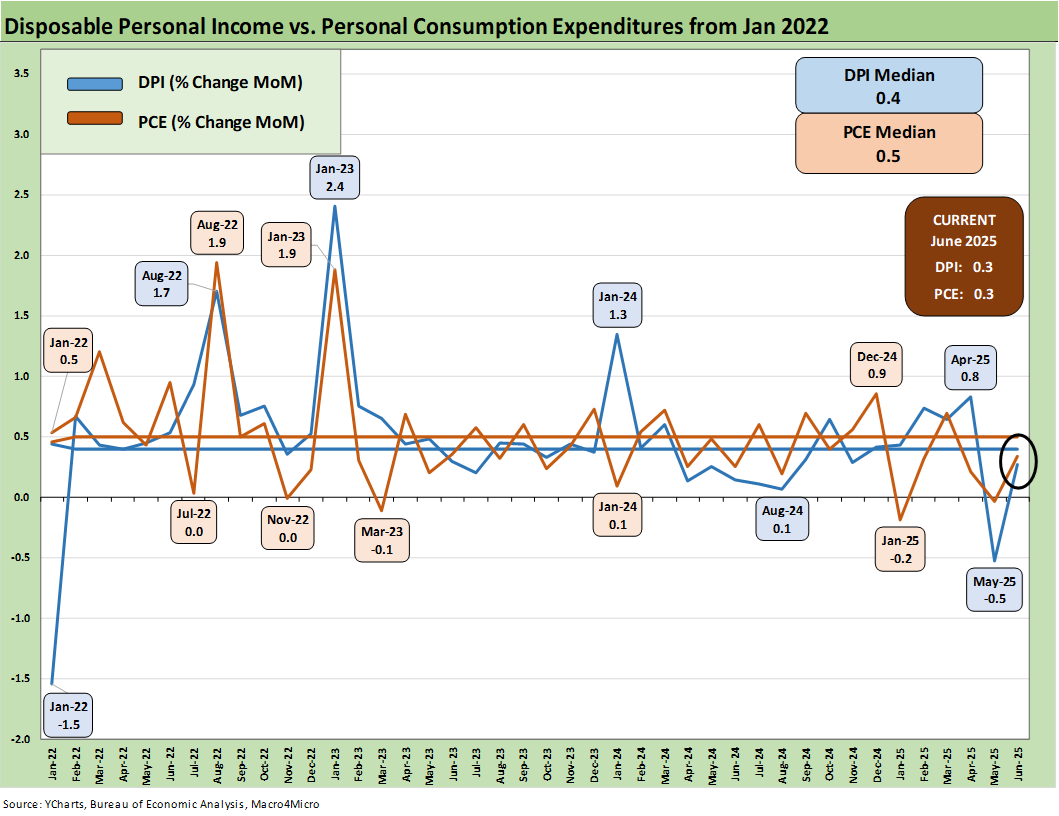
The above chart covers the time horizon for DPI vs. PCE from early 2022 as the tightening cycle kicked into gear after March 2022. Life in Jan 2022 was still quiet for Disposable Personal Income. We saw consumption running at weak levels in May 2025 at 0.0% (revised) in current dollars MoM before a MoM recovery in June to +0.3%. Disposable Income (DPI) recovered to +0.3% MoM from -0.5% in May.
Looking back, the 2021 period was a big macro rebound in GDP off the COVID peak period. The strong macro backdrop in 2021 and heavy dose of fiscal accommodation did not mesh well with residual supply side shortages in goods broadly as 2022 saw the end of ZIRP and a material inflation spike.
Oil was a problem after the Putin invasion of Ukraine in late Feb 2022, and inflation hit a high in June 2022 at +9.1% for CPI as a headline grabber (headline PCE at +7.1% in June 2022) before the steady inflation slide to current rates. Core PCE had dueling peaks at +5.6% for Feb 2022 and Sept 2022.
For May 2025, DPI came in negative and PCE was 0% (as revised). The economists on the screen are tagging the DPI as “noisy,” but the PCE consumption lines have already seen more than a few bad consumer indicators including the advance 2Q25 GDP estimates this week (see 2Q25 GDP: First Cut of Another Distorted Quarter 7-30-25). Pressure is likely to remain high with tariffs and if we see more disarray in the markets with other trade partners (notably Mexico and Canada as the #1 and #2 trade partner nations). Employers and consumers will have decisions to make as the side effects of tariffs unfold. Policymakers and GOP legislators defer to Trump on anything tariff related but consumers and corporate investors get to make up their own minds.
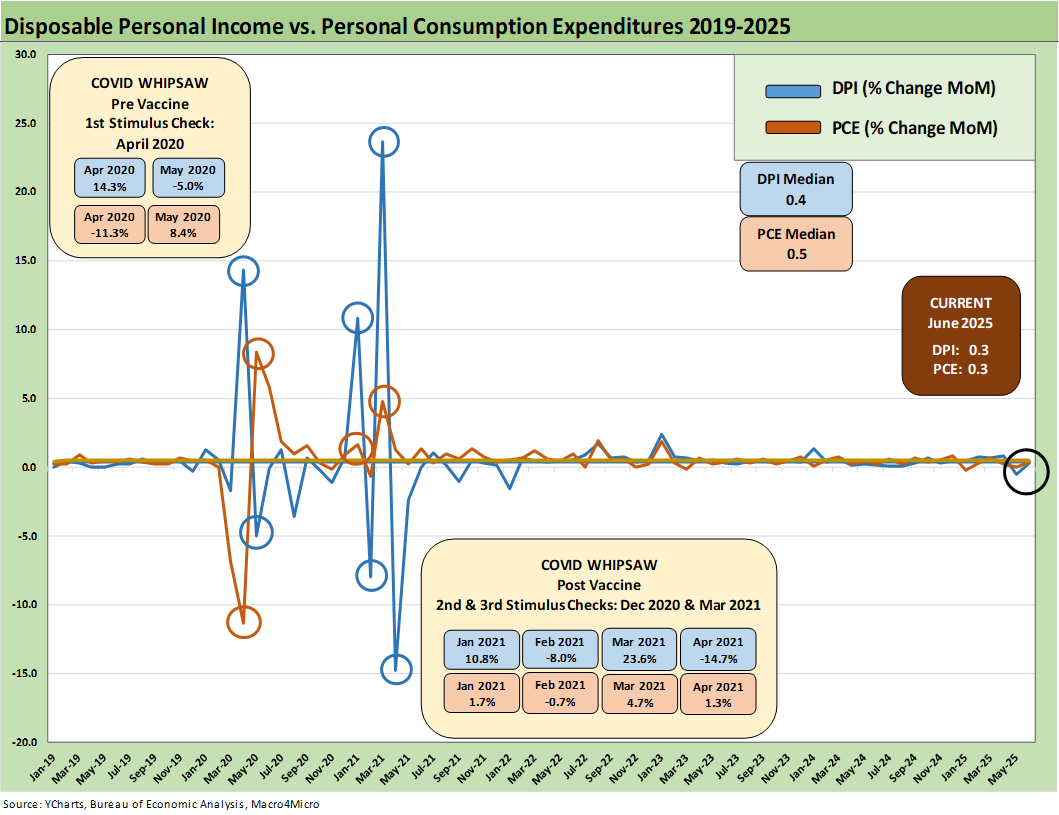
The above chart plots MoM DPI vs. PCE as a read on how wild things got during and right after the pandemic peak. These comments are somewhat of a replay each month with some edits and updates. This is a chart we use each month to revisit the DPI swings that came with the three COVID relief/stimulus packages. That included two under Trump and one under Biden.
As a reminder, Trump signed the CARES Act in March 2020 (shows up in the DPI in April 2020) and Trump also signed the Dec 2020 legislation disbursed in Jan 2021 (Trump seldom mentioned that Dec 2020 act since it was easier to blame Biden and Powell). Biden signed the America Rescue Plan (disbursed in March 2021) that was a demand pile-on (we would argue over the top) in a supply constrained environment (thus inflation). The DPI and PCE wave tied to each of those shows up in the chart above.
The vaccine was announced in early Nov 2020 just ahead of two stimulus actions. That was soon to be a factor in PCE patterns and lag effects in the “great reopening.” The quarterly GDP numbers in 2021 on the post-COVID bounce were numbers generally not seen since the Reagan and Clinton years (see Presidential GDP Dance Off: Clinton vs. Trump 7-27-24, Presidential GDP Dance Off: Reagan vs. Trump 7-27-24).
COVID was a distinct period for supply chains and supply-demand imbalances. With tariffs and potential trade wars, it will be important to look for similar imbalances whether in narrow product categories or in broad commodities and materials areas. Jacking up costs for aluminum, steel, and some copper products (less copper than originally expected) and seeking even more tariffs on pharma and lumber among others will keep expense and price pressure on the front burner. Auto tariffs in Section 232 remain extreme. We await outcomes for semis, pharma, and aircraft/engines/parts added to the Section 232 pipeline.
Supply-demand factors are timeless in significance. Washington spends too much time not discussing how supply and demand fits into their plans (since it usually does not fit into their thoughts). Dislocations that were underway in shipping and freight can cause many unintended consequences (all bad for consumers). The recent China battle offered a reminder.
The typical political game in the 2024 election was to concentrate inflation cause-and-effect on the March 2021 disbursement highlighted in the chart above. The idea is that a single stimulus plan signed by Biden in early 2021 was the cause of all inflation. That is another case of “dumbassery” in the Washington tradition. We see it on both sides of the aisle across the decades, but that was an especially dumb sales pitch from the “politically axed.” That Biden plan certainly made things worse from the demand side, but it is a more complex story.
The invasion of Ukraine by Russia in Feb 2022 also drove the ensuing spike in inflation to a June 2022 CPI high of 9.1%. That invasion was caused by Putin, who seldom gets mentioned by policy architects as they consider what went wrong in 2022.
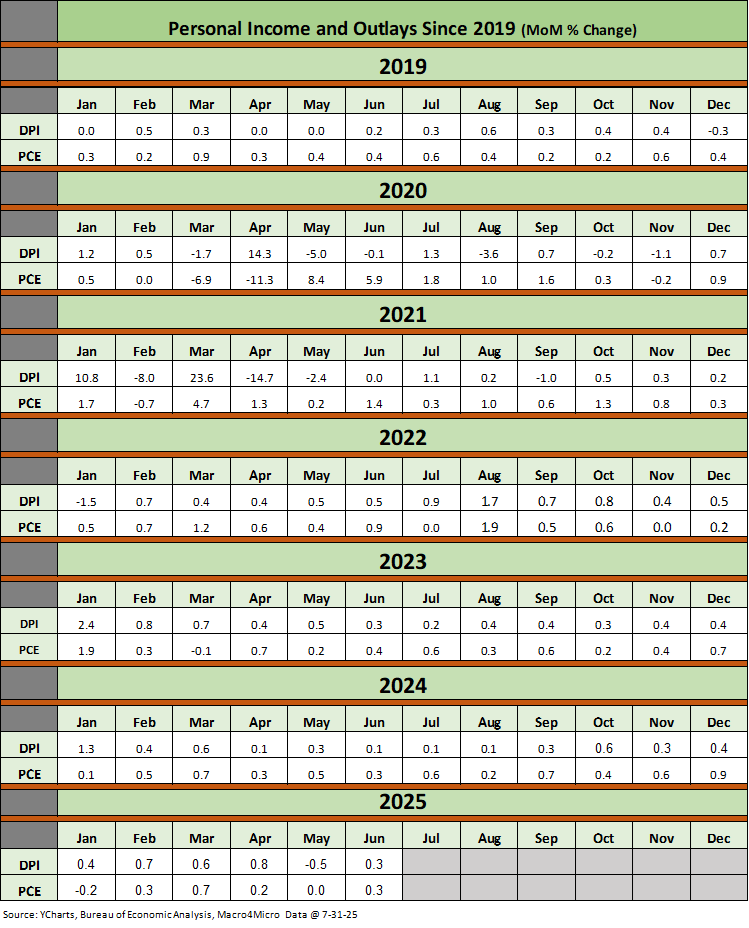
The above table plots the monthly Disposable Personal Income MoM change numbers vs. the Personal Consumptions Expenditures numbers across the years from 2019 through June 2025. It is an easy scan across key time periods for a look at turning points in DPI (e.g. stimulus payments) or PCE.
One exercise to do from time to time is to look at Table 1 in the monthly “PCE release” for the granular dollar amount on each line. While this month’s personal income is underwhelming news (see line 32 for the DPI total), the line items can show some volatility. We like to look for gaps between DPI and PCE.
Any reader of Table 1 can simply tick off which lines might come under pressure in the coming months with tariffs including household expense lines such as health care or durable goods that face tariffs (pharma, consumer durables). The recent budget bill with the tax cuts and offsets were all over the screen every day, but it is always worth remembering that a tariff is a regressive tax that hits lower income consumers harder. The same is true of Medicaid costs based on the income brackets of Medicaid users. Medicaid shows up in the government social benefits line (income). And that is going lower.
On cash drains and where tariffs fit in, legislators can vote with their party, but the tariff facts are the “buyer pays” or exactly and literally “the buyer writes the check to customs.” Try to get the White House to admit that basic fact.
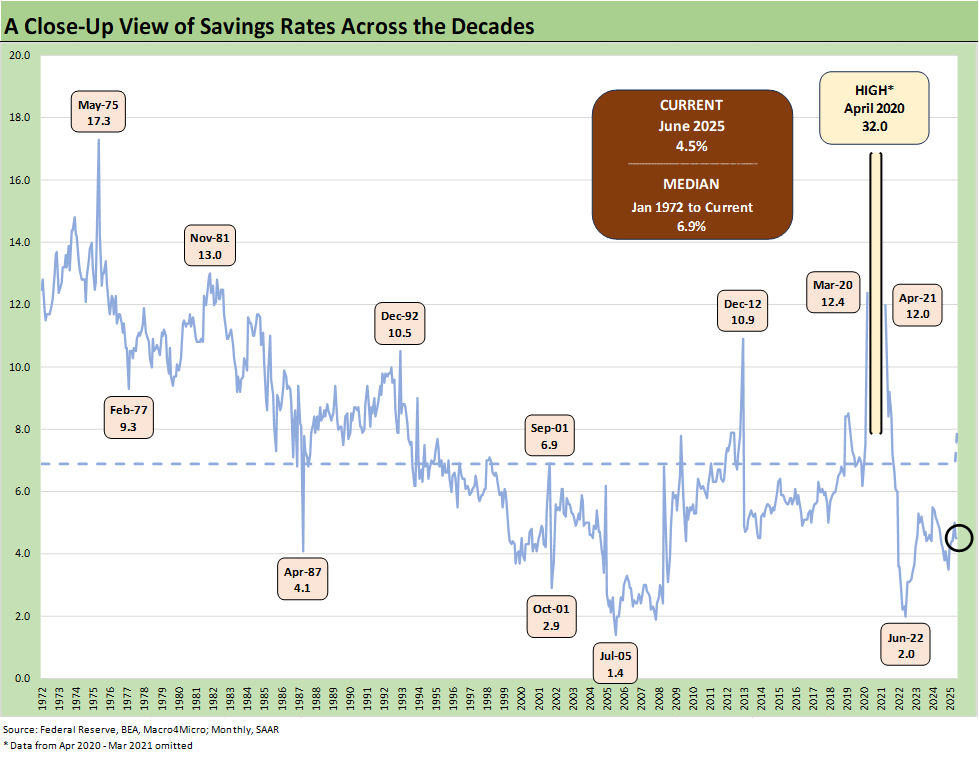
The savings rate numbers for June were flat to May at 4.5% from a recent high of +5.0% in April, which was up from the Dec 2024 lows of +3.5% before moving up into the 4.0% handle range for each month to date in 2024 ex-April at 5.0%.
We have looked at the savings rates issues across the cycles in past commentaries (see Savings Rates: Context Across the Cycles 10-27-23). We have seen waves of restatements but they are useful in gauging consumer trends. Rising savings rates are often consistent with a more defensive consumer, and we have seen ample evidence of that in “soft economic releases” such as surveys. We also heard plenty of empirical evidence on earnings calls including some very mixed retail earnings. Homebuilders also have been feeling the pressure (see links at bottom).
We have looked at the savings rate dynamics in earlier commentaries (see Savings Rates: Context Across the Cycles 10-27-23). Savings rates peak in times of worry (occasionally panic) as evident in the chart above. The period leading into May 1975 was no picnic while Nov 1981 and Dec 1992 had a raft of issues.
Sometimes there are anomalies during expansions such as in 1987 when the oil patch had basically crashed starting in 1986. Regional stress was high, and banks and thrifts were failing. People had to draw down savings or they saved to weather the storm.
Along the timeline, COVID and the various stimulus actions across cycles had a distorting effect on the numbers as well. The exercise is one of looking at the numbers and seeking out trend lines across the income and outlays disclosure.
Adjustments to income at the industry levels or stress in major regions can move multiple lines in what is a derived number. Radical adjustments to transfer payments tied to political tides (like the attack on Medicaid in recent legislation) could strain these numbers in 2025-2026. Some of the recent legislation will play out over years. The same variability is true for income lines as more workers get deported and cyclical conditions could lead to payroll pressure.
There are always multiplier effects and layers. Tariffs are not just about border taxes to bolster the UST revenue line. The tariffs have great significance for household budgets and corporate revenues, costs and capex budgets. That tariff impact could spill into cost-cutting actions and capital budget pauses. That is when the rule of “one man’s capex is another man’s revenue” spills into “one man’s expense line reaction is another man’s inflation” (or job loss).
Markets:
2Q25 GDP: Into the Investment Weeds 7-30-25
2Q25 GDP: First Cut of Another Distorted Quarter 7-30-25
United Rentals: Cyclical Bellwether Votes for a Steady Cycle 7-29-25
JOLTS June 2025: Lower Openings and Hires, Higher Layoffs YoY and Flat MoM 7-29-25
Footnotes & Flashbacks: Credit Markets 7-28-2025
Footnotes & Flashbacks: State of Yields 7-27-25
Footnotes & Flashbacks: Asset Returns 7-27-25
Mini Market Lookback: Mixed Week Behind, Big Week Coming 7-26-25
Durable Goods Jun25: Air Pocket N+1 7-25-25
Taylor Morrison 2Q25: Resilient but Feeling the Same Macro Pressure 7-25-25
New Home Sales June 2025: Mixed Bag 7-24-25
Existing Home Sales June 2025: The Math Still Doesn’t Work 7-23-25
PulteGroup 2Q25: Still-Lofty Margins see a Mild Fade 7-23-25
D.R. Horton 3Q25: Material Slowdown Still Good Enough 7-22-25
Housing Starts June 2025: Single Family Slips, Multifamily Bounces 7-18-25
Mini Market Lookback: Macro Muddle, Political Spin 7-19-25
Housing Starts June 2025: Single Family Slips, Multifamily Bounces 7-18-25
Retail Sales Jun25: Staying Afloat 7-17-25
June 2025 Industrial Production: 2Q25 Growth, June Steady 7-16-25
CPI June 2025: Slow Flowthrough but Starting 7-15-25
Footnotes & Flashbacks: Credit Markets 7-14-25
Mini Market Lookback: Tariffs Run Amok, Part Deux 7-12-25
Mini Market Lookback: Bracing for Tariff Impact 7-5-25
Payrolls June 2025: Into the Weeds 7-3-25
Employment June 2025: A State and Local World 7-3-25
Asset Return Quilts for 2H24/1H25 7-1-25
JOLTS May 2025: Job Openings vs. Filling Openings 7-1-25
Midyear Excess Returns: Too little or just not losing? 7-1-25