
United Rentals: Cyclical Bellwether Votes for a Steady Cycle
We look at the latest URI numbers in the context of a solid year for URI and capital goods in equities.

The equipment rental business has always been one of our favorite indicators for cyclical end market signals whether in non-residential construction or across the wide range of industrial verticals on the other side of the lease. URI is sending more favorable vibes than we picked up from Ashtead in terms of capex guidance and as URI offers color from its Customer Confidence Index.
The value of the URI guidance is rooted in the depth and breadth of its customer base with 1,615 North American branch locations and over 27K employees that all roll up into a very useful lens to gauge customer activity and expectations. The resilience of the URI capex program and related guidance is another vote of relative optimism during June quarter earnings.
URI jumped on earnings day by almost 9% as the buyback program grew by $400 mn and guidance was generally affirmed at the midrange for capex and EBITDA. The increased buyback guidance was based on the incremental cash flow impact of the bonus depreciation terms of the tax bill, but the capex guidance is to us the main cyclical gut check each quarter. Gross and net rental capex were unchanged.
Solid growth in Specialty Equipment, EBITDA margins in the mid-40% range, and favorable secular growth in leasing vs. buying are the usual anchors for optimism on free cash flow and low leverage that support the credit profile.
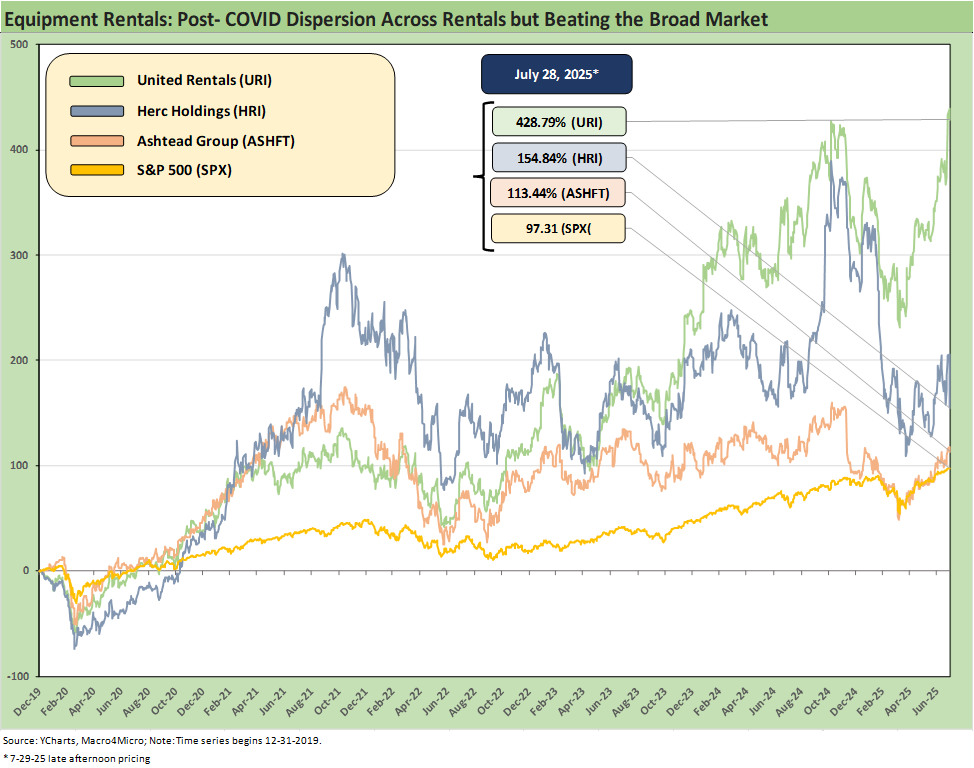
The above chart frames the running performance of the equipment leasing equities vs. the S&P 500 since the end of 2019. The easy takeaway is that all 3 beat the S&P 500 over that timeline even as Herc Holdings took a beating today after its earnings.
United Rentals (URI) is a clear winner by a healthy margin on its exceptional growth trajectory fueled by M&A and heavy reinvestment (see Credit Snapshot: United Rentals 4-1-25, Credit Crib Note: United Rentals 11-14-24). URI’s stock jumped higher by almost 9% with its earnings report last week as its buyback guidance was increased. URI equity is higher by around 17% the past month including today’s weakness.
Ashtead and its Sunbelt unit have lagged URI in relative terms after a great decade of expansion (see next chart), but Ashtead is still ahead of the broad market (see Credit Snapshot: Ashtead Group 7-21-25). Herc Rentals (HRI Holdings) was pummeled today after its earnings report with the stock off by over -17% as we go to print. That continues a volatile history. Even with that effect. HRI has had a good run across this latest cycle.
As we cover in our Herc Rentals single name work, we have been negative on the credit story given HRI’s rating in the BB tier and the post-deal leverage and execution risk (see Credit Snapshot: Herc Holdings 4-23-25, Herc Rentals: Swinging a Big Bat 2-18-25, Credit Crib Note: Herc Rentals 12-6-24). Herc will be an adventure, but if they lag, they could just as easily end up owned by one of the Big 2. URI’s market cap is over 13x that of HRI.
With 7% handle new issue coupons in a very tight market and a distinctive industry profile in portfolio context, it was easier to get comfortable with Herc new issue bonds in its recent M&A refinancing in June. That was a matter of price, and the deal was placed as a single B tier value at the time. The rating agencies have certainly given Herc Rentals (HRI) a lot of credit for executing on a balance sheet repair program.
As we have covered in the past, the equipment leasing industry has demonstrated its lower business risk profile over and again and the cash flow flexibility and low leverage of URI especially should earn more benefit of the doubt at this point for across-the-board IG ratings on URI unsecured debt.
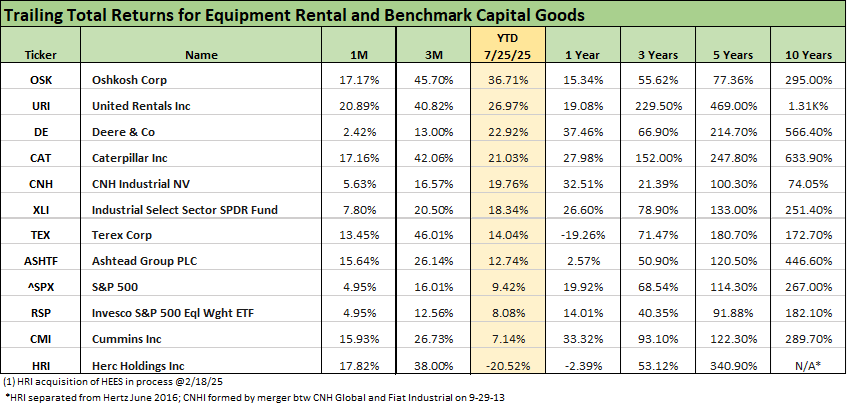
The above table offers a broader review of the equity returns for some notable manufacturers of capital goods combined with the Big 3 equipment leasing companies (URI, Ashtead, Herc). We set the return timeline at Friday close, and we should flag that HRI is now at just worse than -34% YTD (-17% for HRI so far on the day) as the market reacts to the HRI earnings release. The table above also details the S&P 500, the Industrials ETF (XLI), and the Equal Weight S&P 500 (RSP).
The comp chart shows equity returns across a range of time horizons. We line up the companies, ETFs and benchmarks in descending order of YTD total returns. URI certainly distinguishes itself in the group over a range of time horizons and notably over 5 and 10 years as well as before and after COVID. Ashtead also posted a very strong 10 years but has faced more headwinds in recent years.
The aspect of the table above that might be a surprise to some is how well so many of the equipment manufacturers have done YTD. Some of the names are global in scale and some more US-centric. As the recent asset returns highlight, the Industrial ETF (XLI) has been a very solid performer as the conviction runs high that the most damaging trade war risk will be averted (see Footnotes & Flashbacks: Asset Returns 7-27-25). That scenario has clearly worked well for optimists as the in-substance capitulation of the EU and Japan drives home (they of course will not frame it that way). Those outcomes with the EU and Japan do not bode well for the size of the Canadian and Mexico seat at the table.
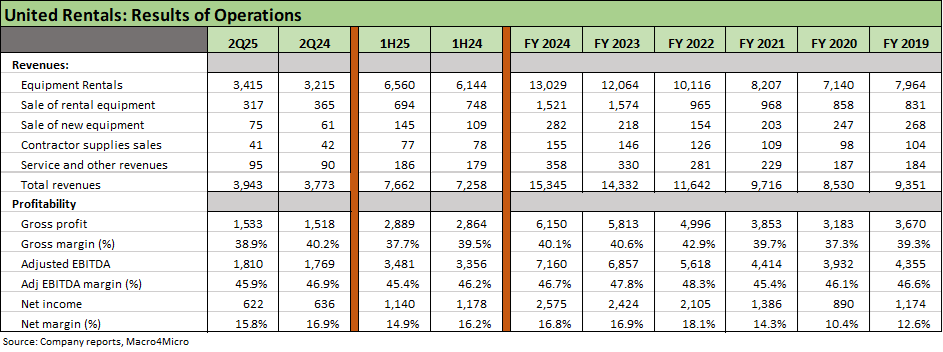
The above table highlights the steady growth of the core rental business with URI rental revenues almost doubling off the COVID lows. The total revenue line highlights the activity in the fleet with the recurring sale of equipment and reinvestment in fleet expansion via capex or acquired fleet.
The simple way to look at the plan from a financial risk perspective is that URI grows its asset base faster than its debt whether it is “buying EBITDA” via M&A or investing heavily in fleet growth via capex. The balance sheet has become stronger even while returning cash to shareholders. URI’s results and the market reaction to their strategy have been impressive. The only ones moving slowly are the credit rating agencies.
The URI story has been one of ongoing expansion of its fleet, broadening of its equipment categories and geographic clusters, and achieving a level of diversification that all adds up to lower portfolio risk in the classic sense.
URI was a major beneficiary of the fiscal support and industry trends that cut across mega projects in infrastructure, data centers, energy (notably LNG), power, semis, and the upside from theoretical reshoring/re-industrialization. Reshoring hopes includes major industries on the other side of protectionism (pharma, metals/mining, auto capacity redeployment from Mexico and Canada, etc.).
The mid to high 40% handle EBITDA margins have been consistent, but URI is seeing some mild compression YoY in 2025. A 45%+ margin leaves a lot of room for capex and capital allocation flexibility and to fund buybacks and dividends as noted in the cash flow chart detailed further below.
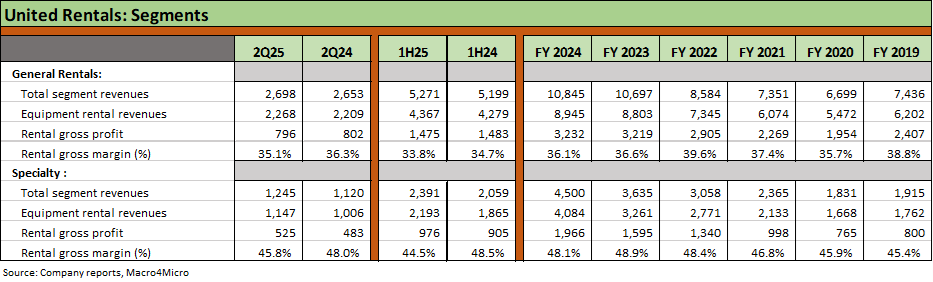
The above table highlights the segment trends with Specialty generating higher margins than the General Rentals mix but both segments generating record revenue run rates. Specialty rental revenues climbed by 14% YoY for 2Q25 and by 17.6% in 1H25.
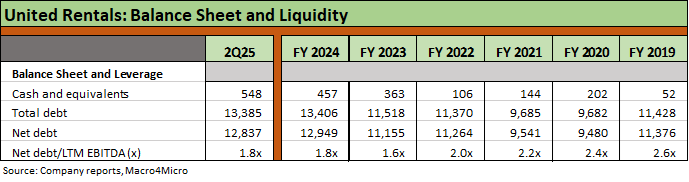
The above table underscores the strong balance sheet of URI with the past two years ending comfortably below 2.0x leverage as organic deleveraging on rising EBITDA continues to be a hallmark of URI. The longer-term financial trends show URI’s ability to grow its revenue, cash flow and asset base at a rate well in excess of growth in debt. For one frame of reference, URI’s total asset base has increased by over $10 bn since 2019 while total debt has risen by less than $2 bn. Leverage of 1.8x is down sharply from 2.6x in 2019.
As we see in the URI stock performance since 2019 captured earlier in this note, the post-COVID expansion has seen URI grow its business meaningfully by capex, reinvestment and acquisition. High margins are sustainable, and URI has regularly demonstrated its ability to allocate free cash flow in a balanced fashion to reward shareholders and protect credit quality.
The resilience of URI’s financial risk profile has been demonstrated across a TMT bubble that burst only a few years after URI’s IPO, a housing bubble meeting an even worse fate, a systemic bank crisis that saw the longest recession since the Great Depression, a pandemic, and the first major inflation cycle in 4 decades that triggered an aggressive FOMC tightening. That is more than a real world stress test for the industry, but it also speaks to the resilience of a US economy that is larger and more diverse than ever despite myriad policy risks and trade tensions.
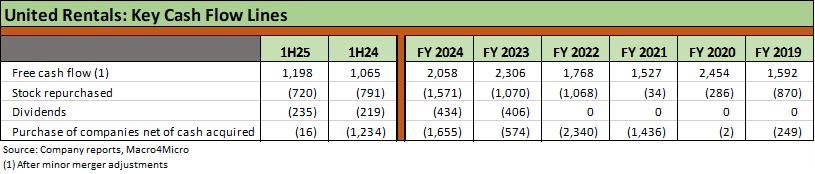
The above table frames the scale of acquisitions, stock buybacks, and dividends across time. URI can line up a $1 bn acquisition as a matter of routine and easily fund them with ABL lines and unsecured bonds in whatever combination they choose and even do 100% unsecured bonds up front. Along the way, URI just keeps throwing off free cash flow.
When URI buys a major equipment leasing operation, it is always good to keep in mind a hefty base of EBITDA and some more product and customer diversity come along with cross-selling opportunities (in both directions) in those deals.
The double-digit billions of dollars of deals across the decades and successful track record make the acquisition line in the chart above a positive for equity holders and neutral for bondholders. URI has gained such a reputation in M&A that when Herc stepped in front of URI on the HEES deal, the more immediate assumption was that HRI must have overpaid. HRI needed to make a move to play catchup, and that was a separate factor.
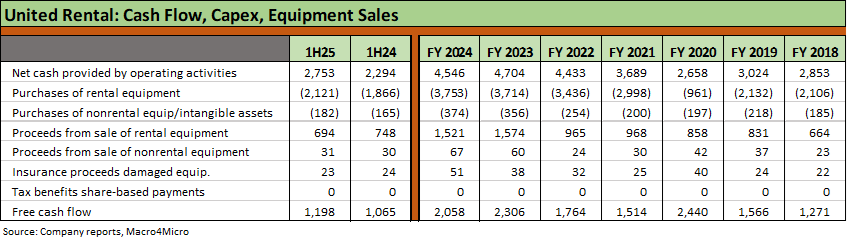
The above table details the moving parts of operating cash flow, capex, and how that flows into free cash flow. The history is very reassuring for lenders and equity stakeholders. The very high EBITDA margins in equipment rental come with the asterisk that there is an embedded capex need to sustain that revenue base. The level of replacement and maintenance capex vs. growth capex is not as transparent as it used to be, but there is no changing the intrinsic competitive advantage of being able to purchase on such a scale. URI can realize superior utilization of the assets with captive labor cost leverage in areas such as fleet maintenance and repair. They also can manage the fleet size through a deep secondary market for used equipment, again highlighting financial flexibility.
See also:
Credit Snapshot: Ashtead Group 7-21-25
Credit Snapshot: Herc Holdings 4-23-25
Credit Snapshot: United Rentals 4-1-25
Herc Rentals: Swinging a Big Bat 2-18-25
United Rentals 4Q24: Strong Numbers Set the Table 2-2-25
United Rentals: Bigger Meal, Same Recipe 1-14-25
Credit Crib Note: Herc Rentals 12-6-24
Credit Crib Note: United Rentals 11-14-24