
Payrolls July 2025: Into the Occupation Weeds
We examine the underlying line item variances in the +73K nonfarm payroll number that brings critical new data for the Fed.


Paging Powell – labor market stimulus check
Nonfarm payrolls grew well under median at +73K in July, including revisions that bring the three-month average down to +35K. The headline is the lowest since the hurricane-affected October 2024, but the three-month average is the lowest since COVID and the lowest for three consecutive positive months since before 2007.
The concentration in the Healthcare and Social Assistance sector that alone contributed +73K payrolls leaves a total net zero growth from the rest of the market. With small gains elsewhere in Services, goods-producing and Government were both negative at -13K and -10K, respectively.
Alone, the soft headline this morning would not have been such cause for concern except that the rolling revisions left May at +19K and June at +14K. While some of these cuts reflect intended reductions in government employment, the broader pattern of downward revisions suggest the August payroll release could reveal signs of broader, sustained deterioration. That brings the FOMC into the picture in a bigger way with the sounding of the “dual mandate alert.”
Today’s data brings more weight to the negative signals from JOLTS earlier this week. The dual mandate for the Fed grows harder to navigate in the months to come with tariff led inflation beginning to show up, even if a September rate cut is still likely given. The debate then would be 25 bps vs. 50 bps like we saw in Sept 2024. August is set up to be a major crossroads for macro data. We see the 2Y UST about -24 bps lower as we go to print and the 10Y UST -13 bps lower.
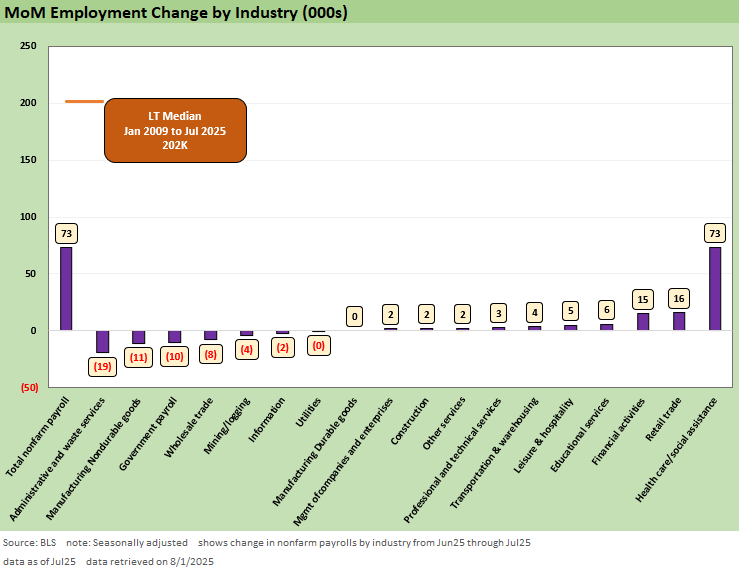
The above chart covers the monthly deltas by key industry groupings from Table B-1 of the Payrolls report. The composition of +73K payroll adds this morning is shown above with only Healthcare showing up with continued strength as momentum in areas like Leisure and Transportation and Warehousing has cooled significantly after seeing growth last year. After showing signs of cooling last month, continuing the trend of relying on Healthcare for payroll growth should be a concerning for cyclical health.
Looking for a bright side, the largest negatives this month were focused in areas that are less critical or already on slow downward trends either by policy design or long-term secular shifts. Starting from the far left, the Administrative and Waste Services decline stemmed from lower-skill and more volatile labor segments like employment services and services to buildings. Employment services, which include temporary help, often decline when permanent hiring improves. While that can be a positive signal in stronger economic backdrops, in this case it is not an offsetting data point.
We’ve covered before the long-running decline of domestic nondurable manufacturing, and further job losses there largely reflect industry consolidation and slow secular death. To some extent further weakness comes as little surprise. For example, declines in Government payrolls stemmed from the deliberate decrease to federal employment. Those planned headcount reductions now add up to a year-to-date decline of –81K and are less about reactive cuts due to fiscal constraints.
The double whammy of a cooler release and major revisions (see below) puts ample pressure on the Fed to cut based on labor market data. The September meeting is likely to bring one cut after this morning to maintain credibility around the employment side of the dual mandate, but the inflation specter is just starting to show up again in the data with PCE this week.
Trump played the biggest round of tariff cards to date yesterday. Though the isolation of the tariff impacts from other macro data (inflation, payrolls, the FOMC) is still challenging at this point, we are still very much in the early innings of the effects playing out in revenue, pricing, expenses and capex and headcount planning. The Fed calculus could get quite challenging from here if the divergence of inflation and fundamentals gets ugly and creeps into the dreaded zone of stagflation.
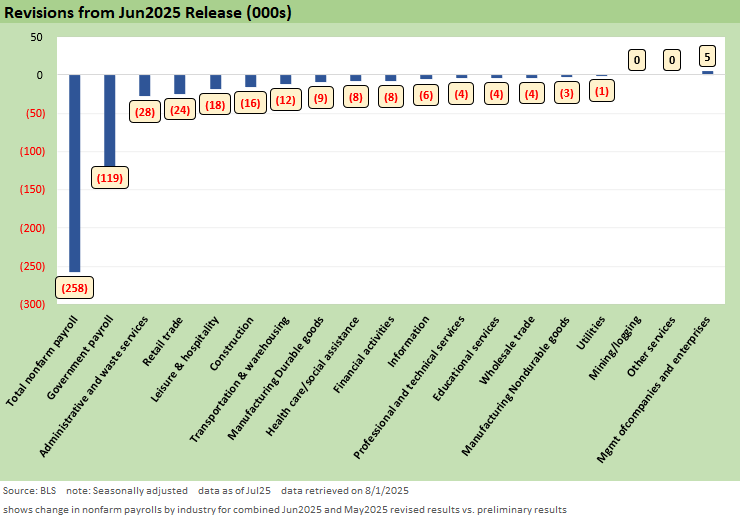
We add the above chart this month to help demystify -258K of major downward revisions that bring May to +19K adds and June to +14K. The magnitude of DOGE layoff activity had been in question the past few months as the data slowly rolled in, but the above paints quite a gruesome picture with Government revisions down -119K. The takeaway in the remainder of the revisions for us is the lack of concentration to specific sectors though the manufacturing picture on the year looks increasingly dim in spite of policy changes aimed at bolstering activity there.
Into the weeds…
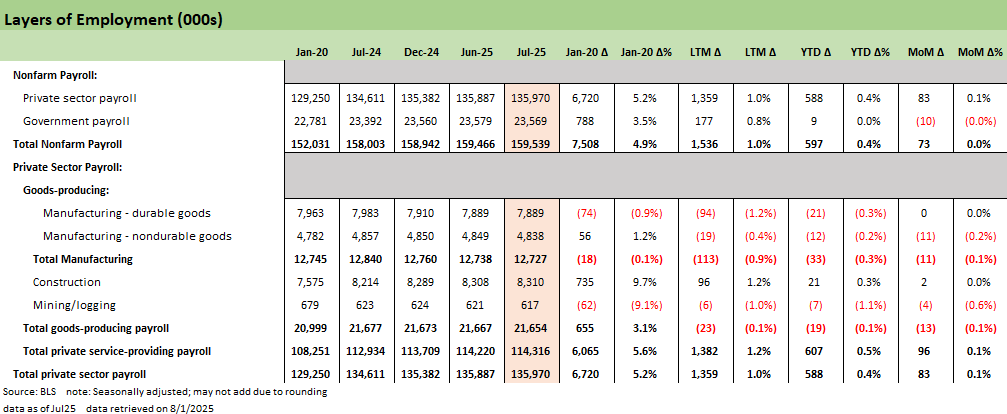
The next series of charts break out granular detail of various occupation lines and industry groupings from this morning’s release with some key histories shown. We start with the broadest level that compares the Public and Private split and the Goods-Producing and Service-Providing sectors. Services typically dominates the payroll growth month to month and it did the heavy lifting as both Goods-Producing and Government were in the red for July.
Before the revisions, last month’s data pointed to a cooling private sector already with gains concentrated in Healthcare and is solidified more after revisions show +59K Healthcare vs. +14K payrolls overall for June. The trendline for July looks eerily similar with +73K Healthcare adds matching the entirety of +73K headline payroll adds, underscoring the narrowness of labor growth.
It would be negligent to remove Healthcare when examining the state of the US labor market, but net of healthcare, payrolls would have declined in the last three months. There are only 127K jobs added in 2025 otherwise across other sectors. Put another way, almost 80% of the payroll adds for 2025 now comes from an industry representing under 15% of the labor force. That is a bleak picture for cyclical breadth.
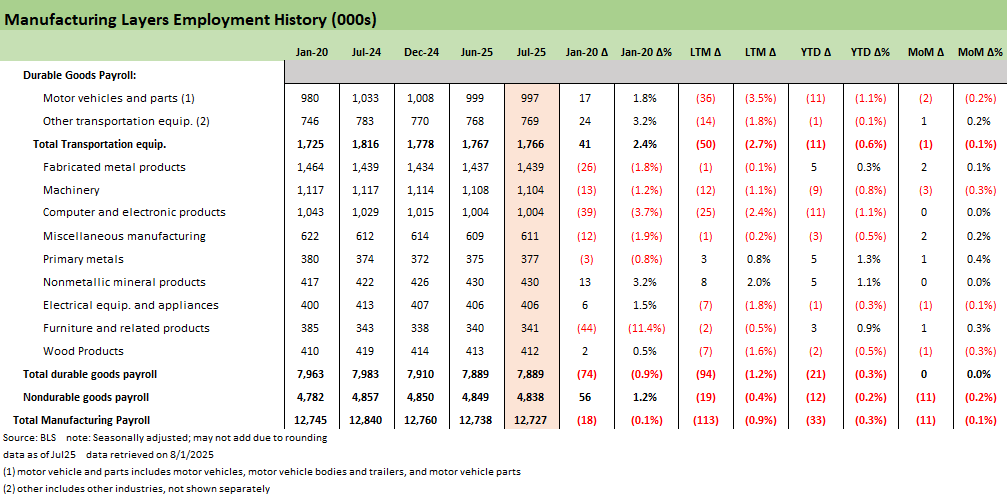
The overall manufacturing picture is shown above and another contraction this month of -11K comes entirely from Nondurables as Durables saw a mixed underlying that totaled 0 adds. Durables is one area where tariffs impacts show up on the inflation side and consumer durables demand has responded by declining as well. The grouping is now down -21K YTD, with Transportation and Computer and Electronics primary drags on the yearly move.
There is little positive news in the recent history above, but one that may see some good news from the tariff impact are the various metal-related lines that have seen minor growth this year as the 232 actions have given enough economic incentive to use domestic Steel, Aluminum, and now Copper suppliers. However, that still raises important questions around tradeoffs as the transportation lines weakness and other metals and materials-intensive supply chains face tough decisions amidst rising costs.
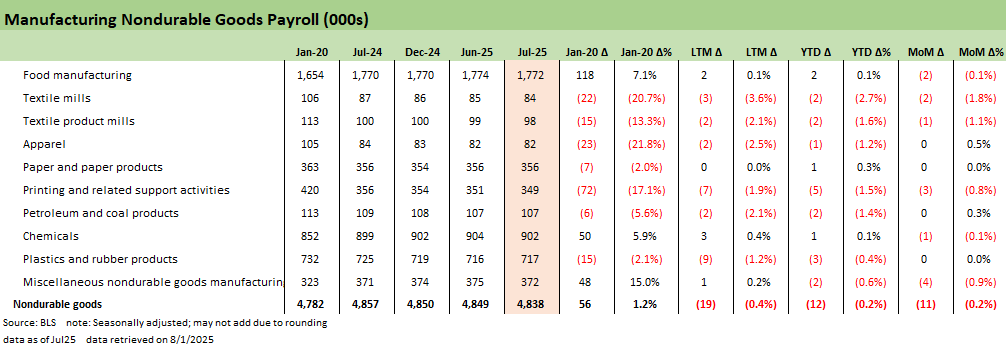
The Nondurables manufacturing lines are shown above with a negative month as several areas saw declines. We still view these as examples of declining domestic production needs and where no amount of tariff regimes could reignite significant domestic investment.
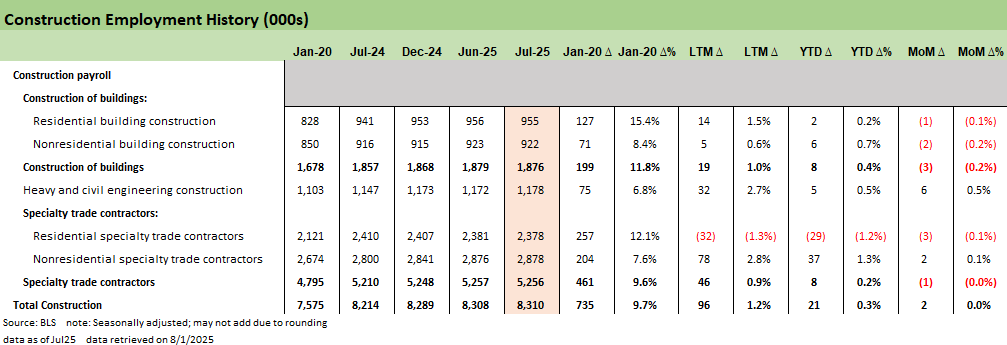
The Construction number passes the month as at least positive at +2K and +21K YTD, even as some of the construction lines shuffle around. The YTD numbers still reflect more late-phase execution on existing projects and the decline in residential activity seen across the year. There is need for power generation and more data infrastructure but the overall outlook for new projects does not show up well across the above numbers.
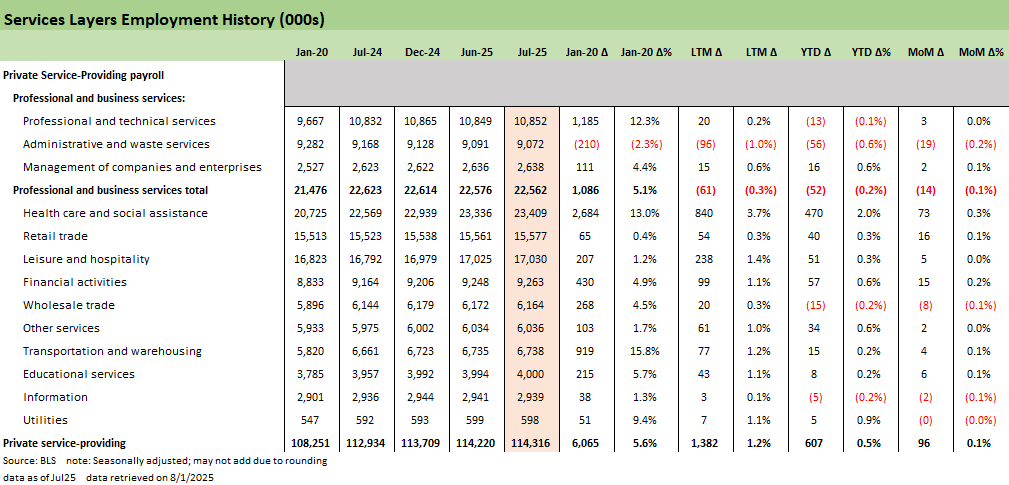
The Services numbers are shown above, and we already covered the Healthcare dominance in the YTD numbers in depth earlier. The slowdown in growth for Retail Trade and Leisure and Hospitality at this juncture points to where discretionary consumer demand may be slowing. The ancillary effects of tariff uncertainty on behavior and fears of higher prices can be enough to lead to retrenchment outside of actually seeing higher price tags. The extent of those effects to overall consumer behavior will continue to be tested in the coming months. For now, the labor picture seems squarely dependent on the ability of Healthcare hiring to persist, and with Medicaid adjustments incoming, that ability will be tested.

Finally, the Government employment lines are above with the split between State and Local vs. Federal payrolls becoming more apparent for the year. Federal declines were not offset this month, but the overall YTD total now sits at +9K.
See also:
Employment July 2025: Negative Revisions Make a Statement 8-1-25
Employment Cost Index 2Q25: Labor in Quiet Mode 7-31-25
PCE June 2025: Prices, Income, and Outlays 7-31-25
2Q25 GDP: Into the Investment Weeds 7-30-25
2Q25 GDP: First Cut of Another Distorted Quarter 7-30-25
JOLTS June 2025: Lower Openings and Hires, Higher Layoffs YoY and Flat MoM 7-29
25
Footnotes & Flashbacks: Credit Markets 7-28-2025
Footnotes & Flashbacks: State of Yields 7-27-25
Footnotes & Flashbacks: Asset Returns 7-27-25
Mini Market Lookback: Mixed Week Behind, Big Week Coming 7-26-25
CPI June 2025: Slow Flowthrough but Starting 7-15-25