
Footnotes & Flashbacks: State of Yields 8-17-25
A complicated mix of economic and political forces are shaping the UST curve as another bear steepener week was notched.


The FOMC challenge: crowded intersection of risk variables to direct.
For the week, a modest bear steepener set back duration as the CPI + PPI one-two punch hit the curve. The overall inflation metrics were manageable enough in the context of the macro indicators to let the equity markets run as a solid June quarter earnings season wraps (see CPI July 2025: Slow Erosion of Purchasing Power 8-12-25, PPI: A Snapshot of the Moving Parts 8-14-25).
We are now moving into a more treacherous retailer earnings season with the July quarter bringing a cross section of major retail names. The market will get more tariff color for the recent quarter and looking ahead. Walmart and Home Depot are among a longer list that cuts across retail subsectors and should give fresh clarity after the constructive retail sales numbers of the past week (see Retail Sales Jul25: Cautious Optimism in the Aisles 8-15-25).
The FOMC is on a short walk to decision day with the crossroad likely to get more crowded with conflicting variables as key inputs for the dual mandate. For now, payrolls are saying “ease” while inflation indicators beg a few more inputs (PCE and another CPI release before the Sept FOMC meeting). We will see if we even get a payroll report for August.
The CPI release this past week offered optimism by showing a flat headline CPI (2.7%) and manageable uptick in core CPI (2.9% to 3.1%) relative to expectations, but then the PPI sent an ugly sequential MoM signal. PPI gets less airtime, but it complicates the easy solution as many more tariff impacts have yet to work their way into the economy and some tariff actions on major goods are still ahead (semis and pharma).
Jackson Hole this coming Friday should bring some excitement and more rhetorical aggression. Meanwhile, the BLS controversy is likely to stay around given the utter lack of experience, political extremism, and dubious qualifications of a candidate who wanted to pause the BLS payroll releases. We even see the street research using code phrases like “institutional erosion” to describe the risks (more politically correct than “politically driven cluster of circles.”).
Below we update our rolling State of Yields commentary
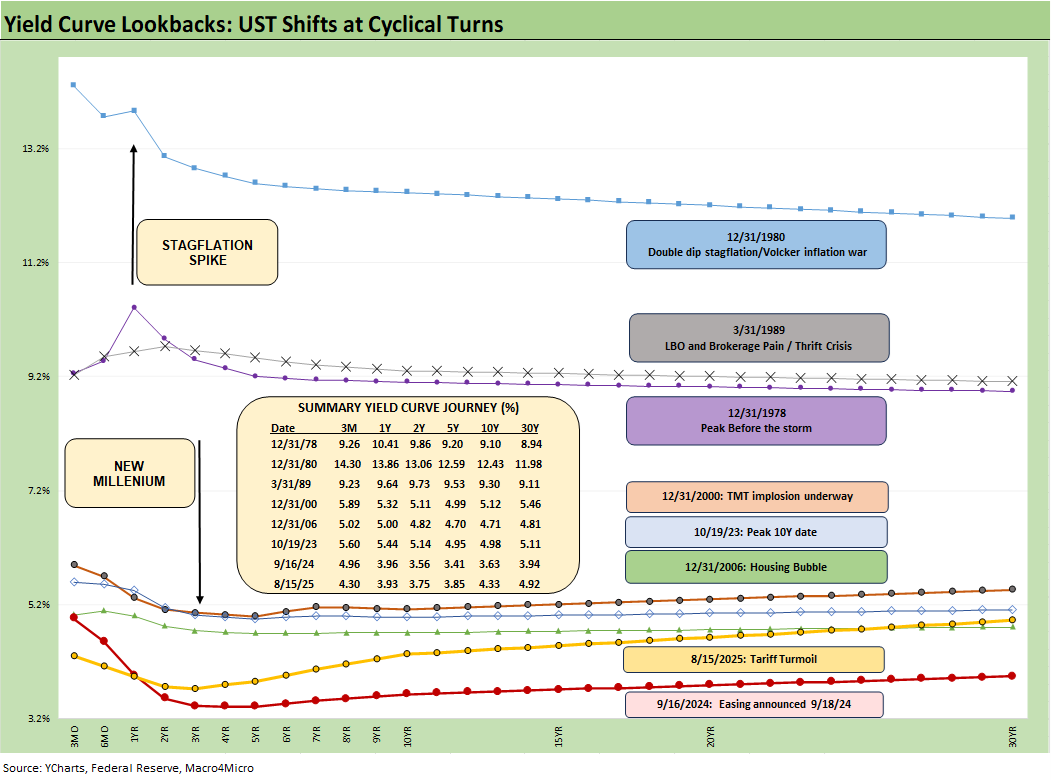
In the above chart, we plot yield curves over a span from the Carter inversion of 1978 across the Volcker years, the1980s credit cycle peak in 1989 (note the 9.2% 3M UST), the TMT cycle faltering in 2000 (on the way to a massive Greenspan easing in 2001), and the housing bubble in 2006. During the 2004 to 2007 period, leveraged derivative exposure and structured credit was out of control and counterparty risk was soaring. Worth highlighting is that the current 3M UST is notably lower than the pre-crisis, pre-ZIRP 3M UST levels.
The chart then jumps from 2006 to 2023, which takes the market beyond the crisis period and the ZIRP years and COVID. Both the post-credit crisis period and COVID prompted the Fed to deliver a wave of market liquidity support and confidence building programs that helped save the capital markets, reopened the credit markets, reduced refinancing risk anxiety, and reduced the contingent liquidity risk profile of the banks.
The credit crisis period from late 2008 and the 2020 COVID crisis period brought plenty of QE and normalization distortions to the yield curve shape. The Fed’s dual mandate made that possible. The market now faces threats to that dual mandate. That is a topic for another day.
The market saw a massive move lower and bull flattener to end 2023 after the 10Y UST peaked in Oct 2023 as we review below. Steeper and higher was not the forecast to start 2024 as the market expected flatter and lower. During 2024, the curve moved in an adverse direction with a bear steepener until a major UST rally alongside the Sept 2024 easing. That soon brought us a fresh steepening with some rallies and sell-offs along the way.
The Fed dilemma ahead…
We are now coming up on another FOMC easing crossroads of historical significance given how badly the stagflation of the 1980-1982 double dip recession proved to be in the record books. No respectable economist on the FOMC wants to join the Fed Hall of Shame for failing to guard against stagflation. That was the fate of Arthur Burns as Fed Chair (1970-1978) and to a lesser extent G. William Miller, who bridged the gap until Volcker arrived in 1979.
Powell is made of more “courageous stuff” than to fold (ease) without data support. With Trump touting his first 6-7 months as the greatest in Presidential history, Trump has a conceptual consistency problem on easing without data support. Trump still has the problem of saying that the seller pays the tariff (again reiterated with India and in the past week’s rhetoric). That means he has power but not much understanding of economics.
The cart and the horse of “weak economy first, easing second” applies in this case, but Trump will not admit to any economic weakness. That frustrates his pitch, so he attacks Powell with insults. When economic weakness shows up (payroll), he goes off the rails and screams “rigged.” History is watching.
There are plenty of power-seeking sycophants on hand to take Powell’s job. They are just not in the seat now. They will be soon enough, and the Fed will then be a captive operation even if only informally. Additional changes will require legislation, which Bessent implies is coming at some point. Legislating is more easily talked about than accomplished. The recent actions around the BLS do not inspire confidence that merit and experience will be the main criteria list for the Fed.
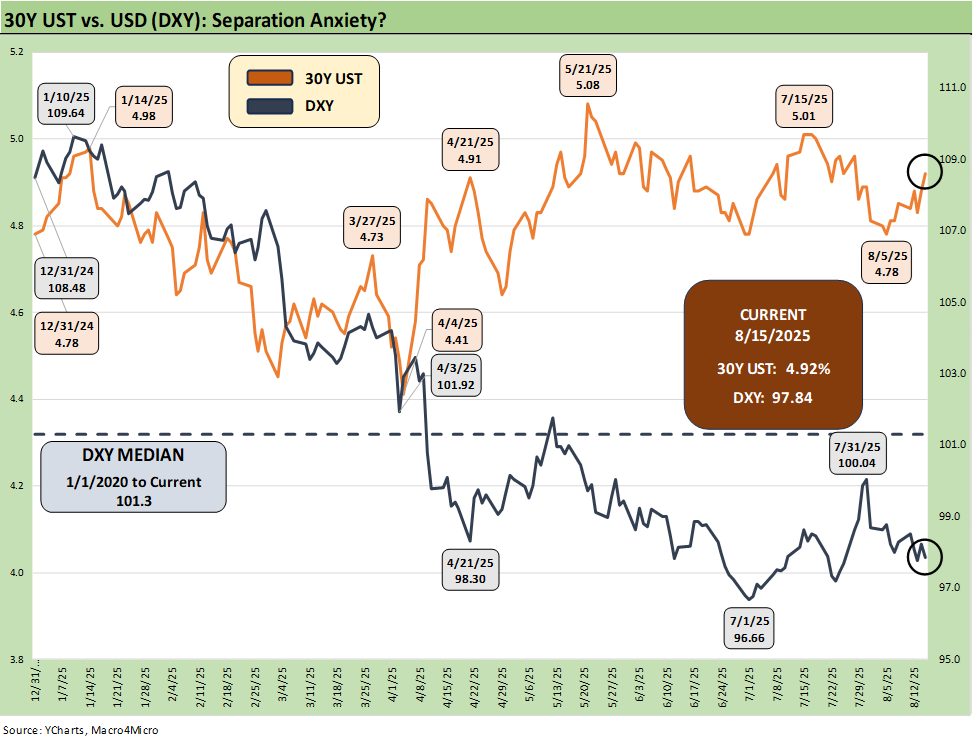
The above chart updates the 30Y UST vs. the dollar index (DXY) from the start of 2025. We saw the dollar weaken again (98.26 last week) and the 30Y move higher this week (last week 4.85%).
The April divergence of the 30Y and DXY makes a statement…(“trouble”)…
We added this chart to the collection as the market focuses more on the juggling act of the need for record UST demand to meet record supply and funding needs. Non-US investors also need to feel comfortable with the dollar and the quality and prudence of US fiscal and monetary governance.
The currency vs. tariff playbook has not gone the way that the Ryan-Brady 2017 Border Adjusted Tax playbook (aka “BAT tax”) had promised. That BAT tax plan in 2017 indicated the USD currency adjustments would play out with a stronger dollar – not weaker. Back then, the GOP openly called it a “tax” as part of their plan to radically overhaul the corporate tax system.
Currency risk: tariffed goods can get cheaper or more expensive subject to the dollar…
The idea of the BAT tax back in 2017 was to slap a 20% tariff on all imports, dramatically alter the corporate tax system, radically change what is deductible, and then let the money roll in. The Senate derided it and did not even take it up after the House pitched it as a transformative overhaul of the corporate tax system. The Dec 2017 Trump tax bill was passed instead. We wrote about it at the time, and the BAT tax bill looked crazy to us. But here we are today with massive tariffs in place and a weaker dollar along with record funding needs.
The part of the pitch that the tariffs would cause the dollar to strengthen materially meant that the currency effects would offset the tariff costs and thus not hurt US purchasers. As with most such innovative bills, that one came with scholarly support and papers on the theories (a U.C. Berkeley Professor).
That theory has now failed in the face of what we see in the above chart. The weaker dollar makes goods even more expensive on top of the tariff depending on the currency involved.
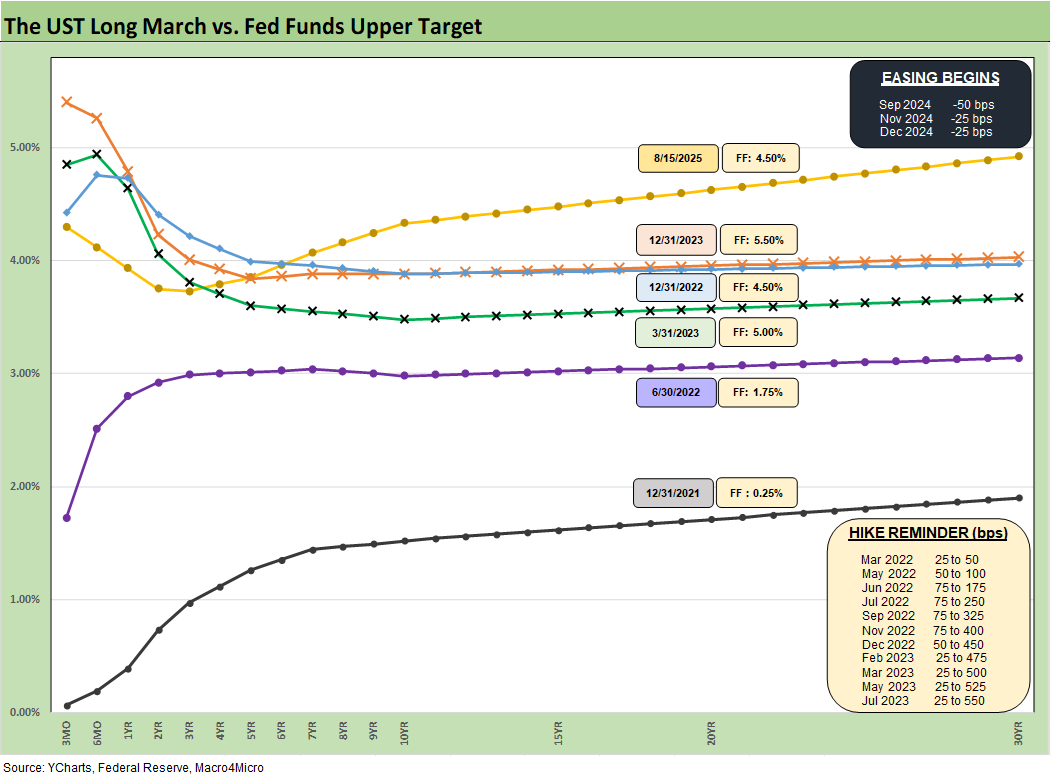
The above replays our weekly chart covering the migration of the UST curve from 12-31-21 with memory boxes detailing the tightening dates and magnitude and more recently the easing. The UST curve seems to intermittently mix bear steepening patterns and flattening rallies since the Sept 2024 lows, but market fear was creeping into the shapeshifting after Liberation Day before calming down with the pause.
The 30Y has been stubborn on the long end during the bull steepening period we have seen YTD. Last Friday’s payroll news and the BLS termination sent the 30Y lower by -11 bps that day (8/8/25).
As detailed below, the 30Y UST saw a modest rise again this past week as the ebb and flow around inflation anxiety carries on for the debt markets. Modest inflation can serve the needs of the stock market as companies stabilize margins, but the love-hate relationship with pricing power can get tricky from the macro level down to the goods-level elasticity of demand.
This week saw another mild bear steepening with the 30Y rising +7 bps in response to mixed economic messages led by a tame Headline CPI number (flat MoM at 2.7% with Core increasing from 2.9 to 3.1%) followed by a hotter than expected PPI report showing the first broad signs of tariff impact. PPI is a leading indicator for inflation and could show up in the PCE price trends later this month.
Despite pressure on wholesale, solid Retail Sales in July underscore continuing consumer resilience despite wavering confidence around tariffs and inflation. Consumers appear to have bounced back from post-Liberation Day softening as they adopt a wait-and-see stance along with the equity markets. Industrial Production was also fairly steady.
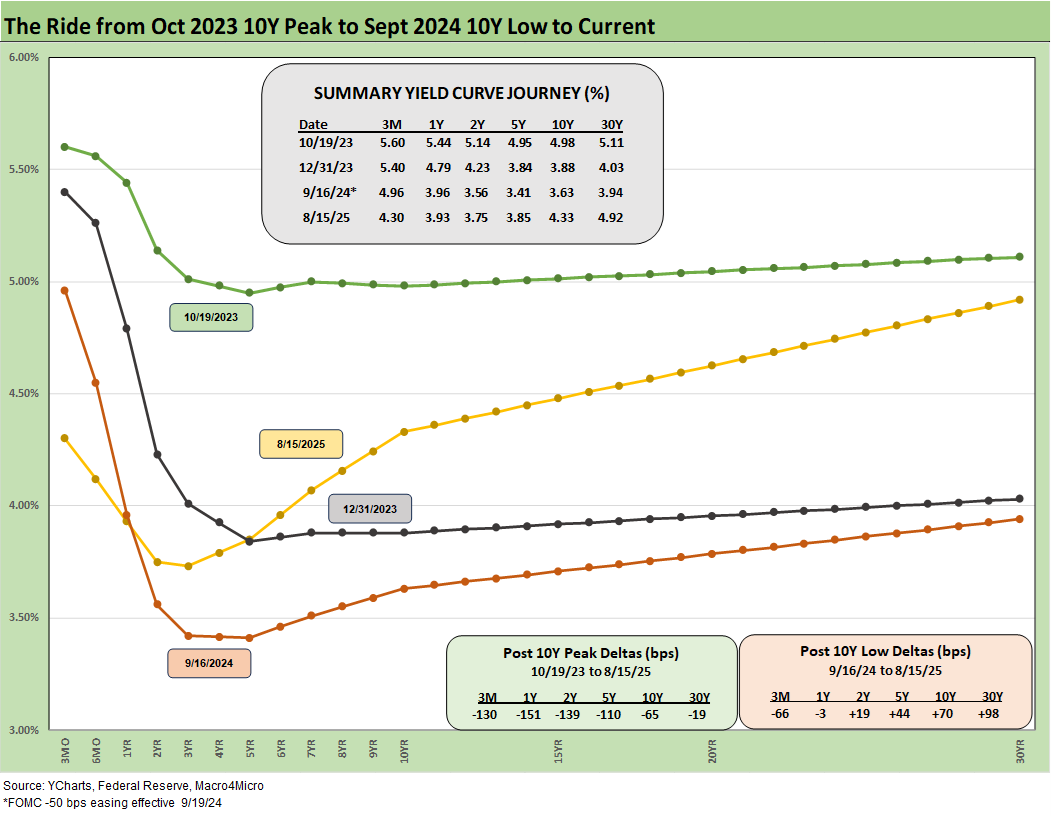
The above chart details the material move from the peak UST curve of 10-19-23 down into the UST bull rally of Nov-Dec 2023 and then eventually into the lows of Sept 2024. The Sept 2024 low tick only came after a bear steepener hit the curve through the summer of 2024. We then moved back into the bear steepener mode not long after the easing until the tariffs roiled the UST markets and initially sent 2Y to 30Y lower on cyclical fears.
The UST shift higher from the Sept 2024 lows and the steepening from the low point at the end of 2023 is reflected in the chart. We see the 10Y and 30Y notably higher now than Sept 2024 with a more normal upward sloping shape from 2Y out to 30Y.
The front end inversion keeps pressure on the Fed…
The challenge is still that front end inversion from 3M to 2Y and from 3M to 5Y. We look at the history of the 2Y to 10Y later in this commentary. That is back in the direction of normal upward sloping, but this front-end inversion tends to favor easing. Powell would be doing just that (easing) if it was not for the fact that the market is looking at its first stagflation risk since the early 1980s.
The inversion anomaly on the front end during a protracted expansion has been hard to shake with the FOMC holding the line over tariff-related inflation questions. Trump hates that Powell has made it clear that the tariff risk is what holds back easing. Powell and the FOMC are hardly alone in this view. After all, Trump still says “seller pays” the tariff. He is not holding a strong factual or conceptual hand.
Under the hood, the July CPI report and the PPI metrics included plenty of signs across the MoM CPI trends that show numerous product group line items seeing prices pushing higher. Fact deniers (like election deniers) will just say it is fake or there is no cause-and-effect.
Trump’s nomination of E.J. Antoni, chief economist at the conservative Heritage Foundation, as the next commissioner of the BLS is Trump’s latest move to control data. The risk with Antoni is the loss of credibility and even availability of payroll data at a crucial point in the economic cycle. Antoni had earlier called for pausing the BLS payroll data.
The Fed dual mandate – employment and price stability – makes the BLS data core to FOMC decision making. The irony is that weak payroll data increases the chance of Fed easing, but Trump opposes any macro data signaling weakness. This, in technical macroeconomic parlance, is called “having your cake and eating it too.”
The Project 2025 ambitions as detailed in Chapters 21 and 24 imply radical changes in how the Fed, the BLS, and BEA are governed. The actions and words of Trump, Bessent, and Lutnick imply this is coming. Earlier in the year, Team Trump literally scrapped major programs and advisory groups who were to help develop the next round of data and system improvements at the BLS and BEA.
Having worked with many economists over the years on the buy side and sell side, the candidate to run the BLS stat effort would be unlikely to qualify for even a mid-level spot the teams I saw put together over the years. The candidate wrapped his degrees in 2000 and has no capital markets experience. There are major gaps in his resume before his degrees also. He is not the problem but a symptom of the problem.
The main problem is the attempt to control the objective data from above to serve partisan needs and mask macro setbacks (see Happiness is Doing Your Own Report Card 8-1-25). It also adds to a long list of “loyalty tests.” These loyalty tests often involve abandoning facts and concepts, which is a bad thing in economics.
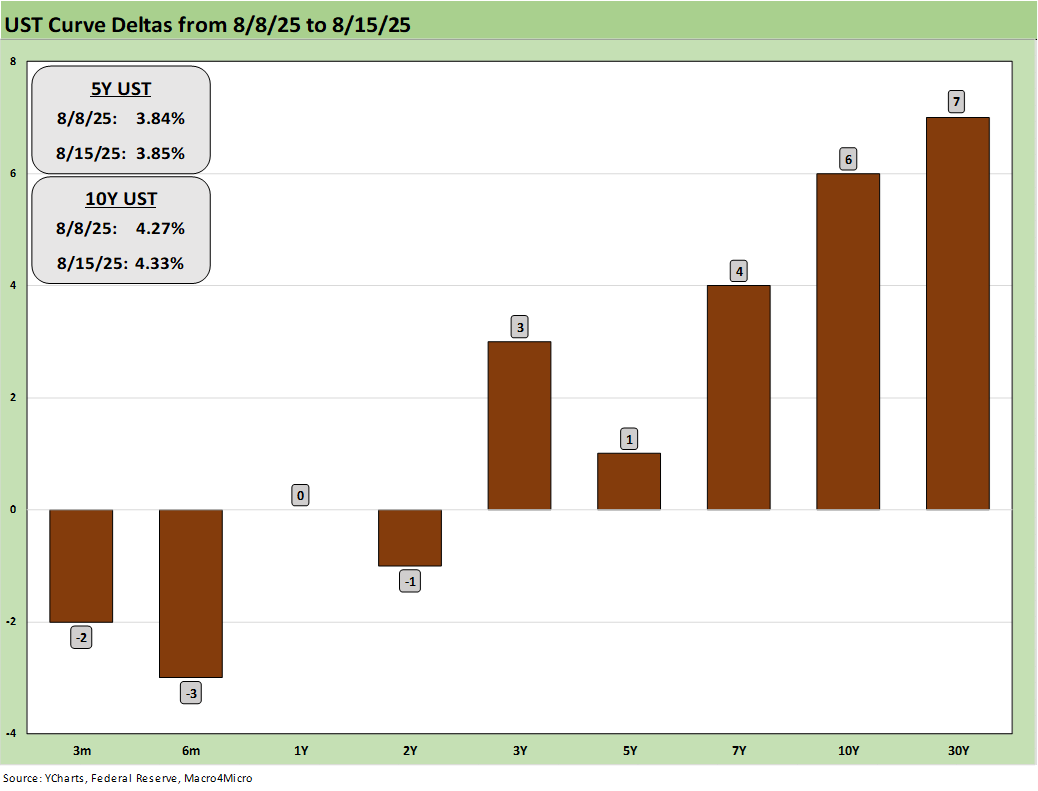
The above chart updates the 1-week UST deltas with a modest upward shift from 3Y to 30Y that hit bond returns during the week (see Footnotes and Flashbacks: Asset Returns 8-16-25).
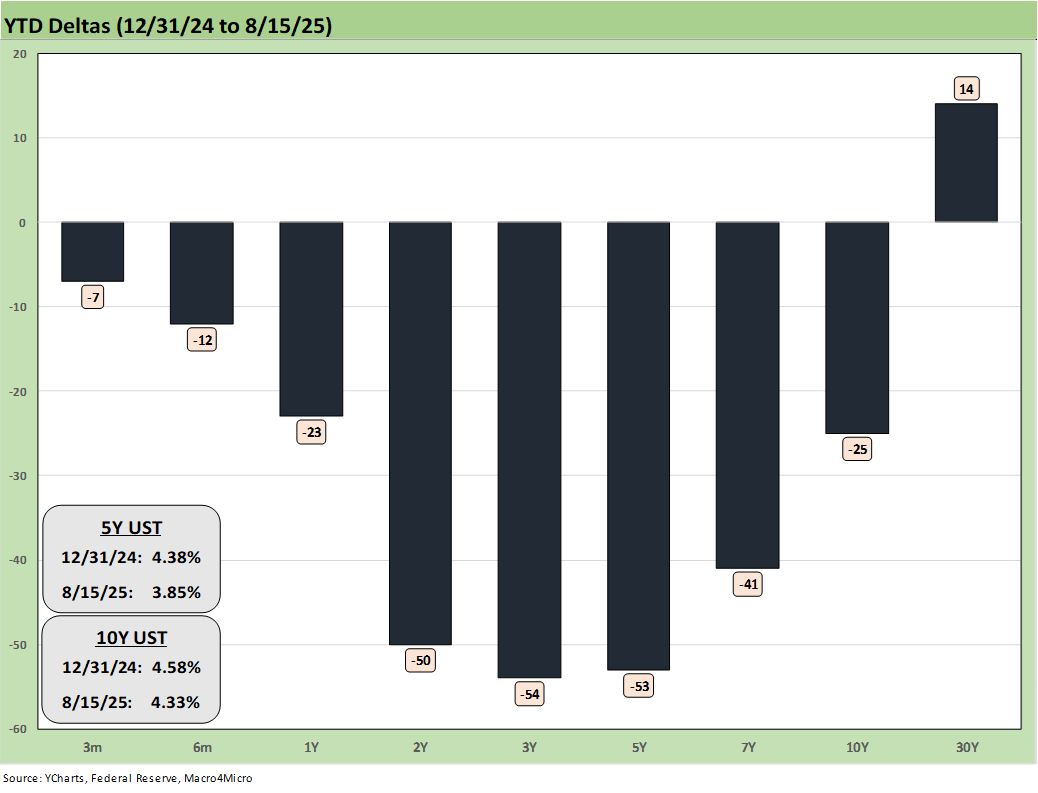
We update the YTD UST deltas above with the bull steepener supporting the bond market and returns of the various bond ETFs we track each week. This past week saw the long duration UST ETF (TLT) drop into last place for the 1-week time horizon in our group of 32 benchmark and ETFS. For the YTD time horizon, all the bond ETFs are positive (see Footnotes and Flashbacks: Asset Returns 8-16-25).
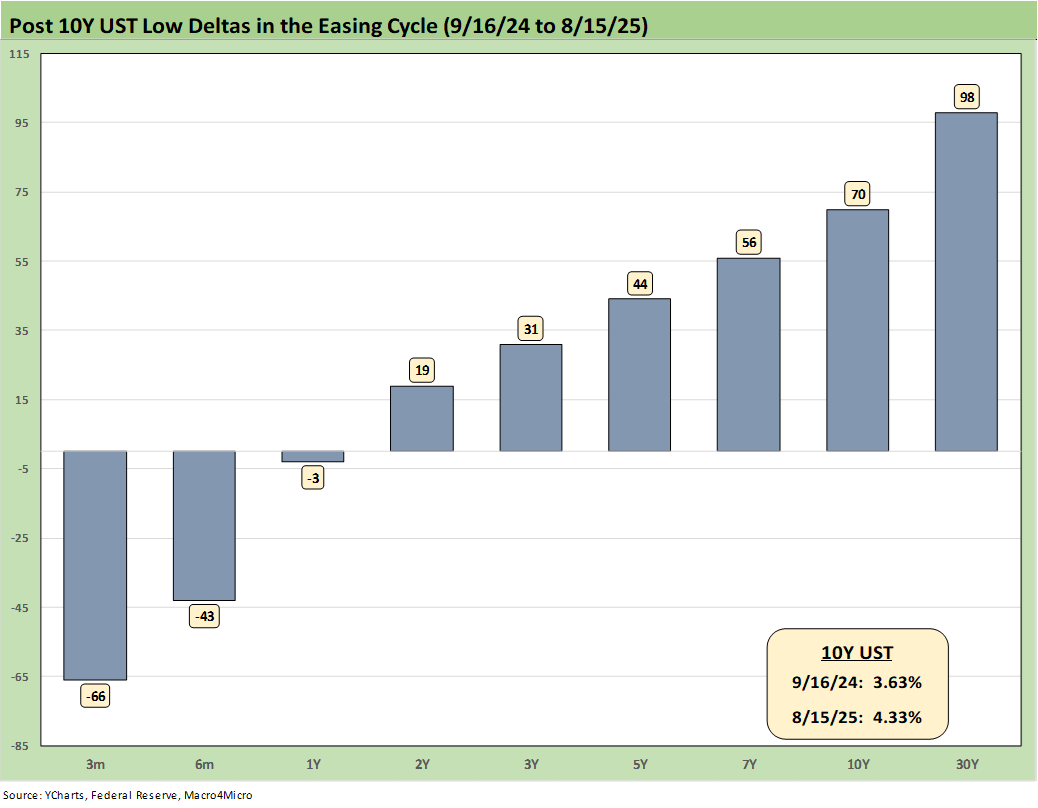
The above chart updates the UST deltas since the 9-16-24 lows that came alongside the Fed easing. That has not worked as many market watchers predicted on the shape of the UST curve and number and pace of easing that was supposed to follow.
Trump continues to rail at the Fed and Powell to lower rates, lately demanding 300 bps of easing. Trump’s demand to ease moved from 100 to 300 unfolded in only a few weeks while he was extolling the greatness of his 2025 economy. The conceptual connective tissue is not doing well on FOMC action vs. the dual mandate. Trump could be trying to blur accountability and distract from the tariff policy as a cause-and-effect link or it could simply be the recurring desire of any White House for lower rates. Trump demanded negative rates in Trump 1.0.
The reality is that Trump’s target fed funds rate for right now would be well below inflation. The market sees inflation running above target, ticking in the wrong direction and tariff impacts just beginning to flow into the numbers while Trump claims his economy is the “hottest” in the world.
We are not sure a de facto stimulus move via negative real fed funds is a conceptually sound (or coherent) plan. Once Trump gets “his guy” in the seat at the Fed, we’ll see what happens. Even if Trump nominates a qualified candidate, we fully expect him/her to succumb to Trump’s demands to ease regardless of the data. A well-pedigreed “yes man” is still a “yes man.”
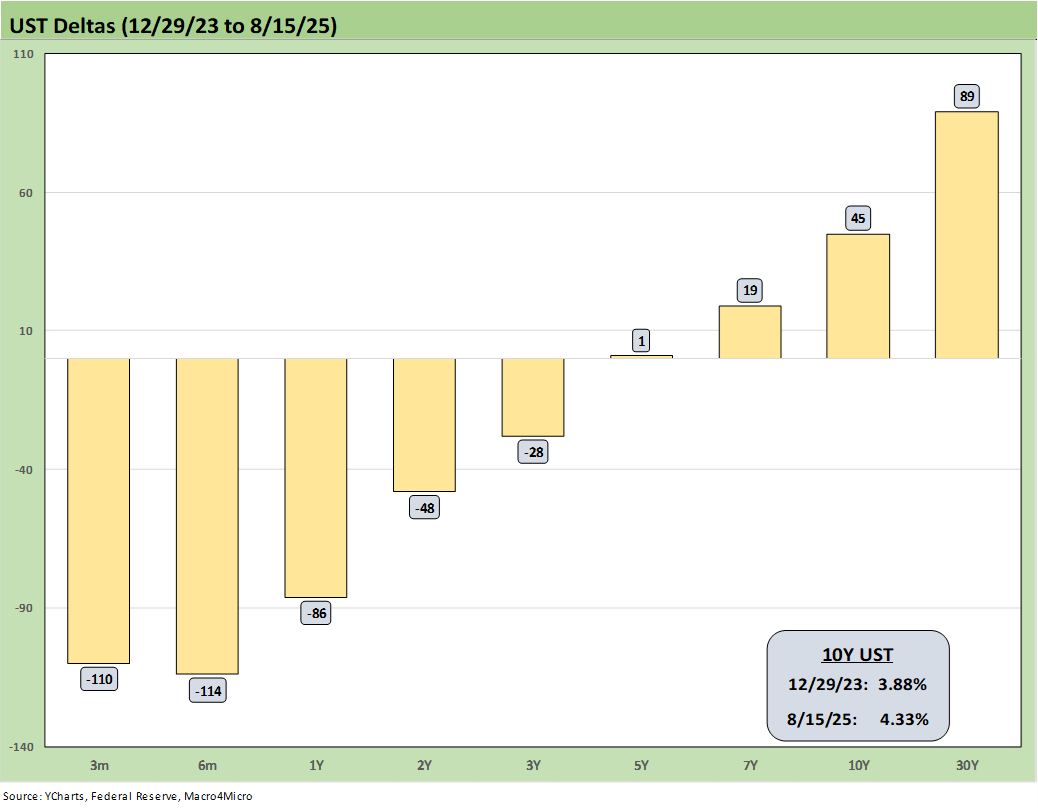
The above chart updates the UST deltas from the end of 2023 after a massive rally in rates and risk in Nov-Dec 2023. The follow-on in 2024 expected by the consensus mildly disappointed the UST bulls in the number of FOMC cuts. The market got 4 x 25 (a double in Sept 2024) but not the 5 to 6 FOMC 25 bps cuts anticipated.
The expectation of a pronounced bull flattening during 2024 also did not play out as expected when a bear steepener prevailed by the end of the year. As detailed in the earlier chart, the 2025 period has fared better for bonds on a modest bull steepener.
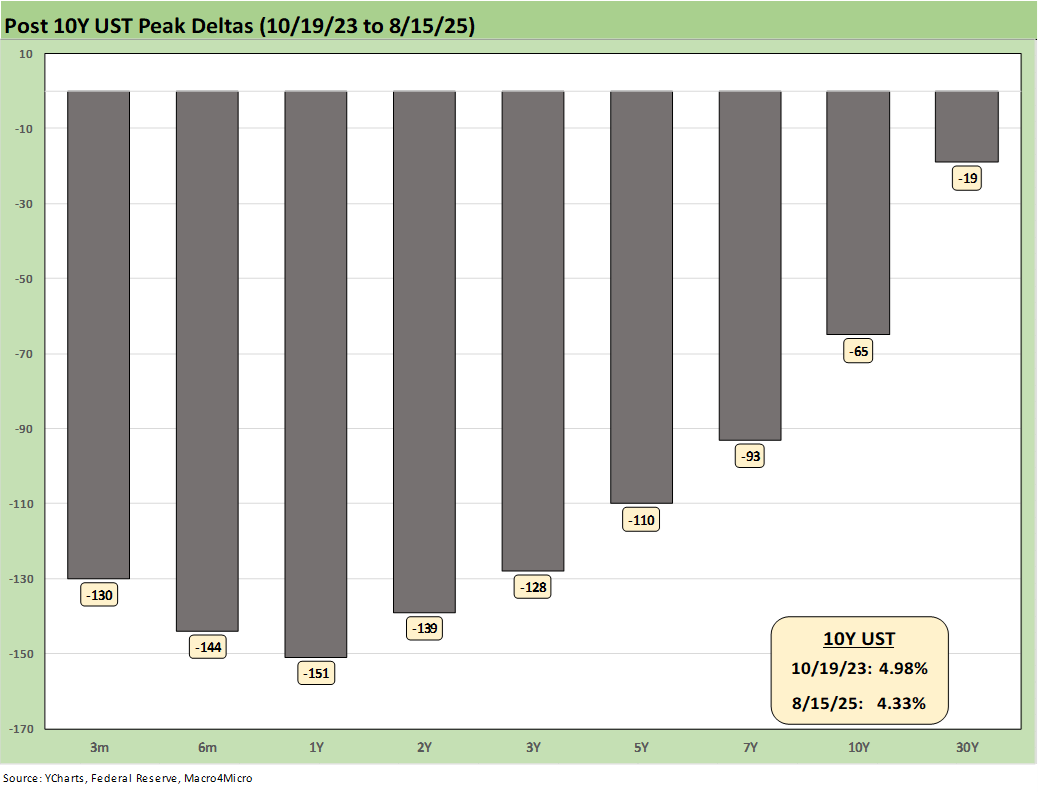
The above chart updates the running UST deltas from the 10-19-23 peak date of the UST 10Y when it barely missed the 5.0% line. For those looking for a frame of reference on what a bad move in inflation metrics might mean, these deltas at least offer a recent set of data points during an inflation fighting year such as late 2023 and into 2024 (until Sept 2024 began the easing process). That is why we keep revisiting that timeline. It reminds us what reversion could mean.
These rally deltas could revert in part or in whole with the wrong inflation outcomes. We don’t need to see 2022 again, but the old saying “It happened before, it can happen again” resonates for many. The market controls the long end of the UST curve, and not the FOMC. Sept 2024 and the aftermath offers a recent data point.
Losing a rally of -93 bps in the 10Y UST above would hurt the mortgage market and would lead to a material valuation headache in equities, M&A economics, and capital project planning. Mortgages have been a drag on housing (new and existing home sales). The risk of inflation heading the wrong way would do more damage. Stubborn rates or higher rates in the short end to 5Y would damage consumer durables financing and related volumes.
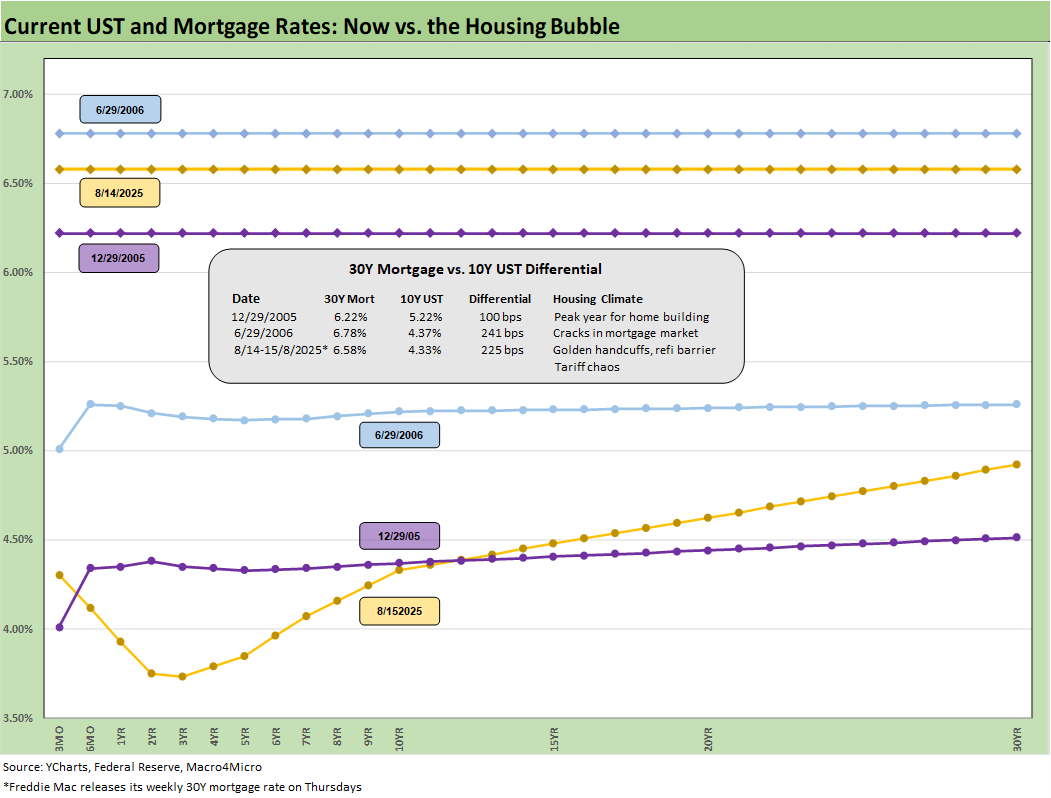
The above chart posts the UST curve for this past Friday and the Freddie Mac 30Y Mortgage benchmark rate (noon Thursday release). We include two useful historical periods including the peak homebuilder year end of 2005 and mid-2006 when RMBS quality concerns were catching headlines as the housing bubble was peaking.
The past week saw the Freddie Mac Mortgage 30Y benchmark rate move slightly lower to 6.58% on Thursday from 6.63% last week. As of Friday close, the Mortgage News Daily survey was 6.58%. We have seen minor moves recently, but they are moving in the right direction. Those smaller moves come after a 200 bps range since fall 2023.
We include a column above detailing the differential between the Freddie Mac 30Y and the 10Y UST. That differential moved lower to +225 bps this week from +236 bps last week and further diverged from the June 2006 +241 differential. The year 2005 posted a differential of only +100 bps and makes a statement on what the mortgage market was like in 2005. The mortgage market was very hot back then in the housing bubble as mortgage volumes soared during that peak homebuilding year and a very busy period of refinancing was running alongside as a source of funds for homeowners.
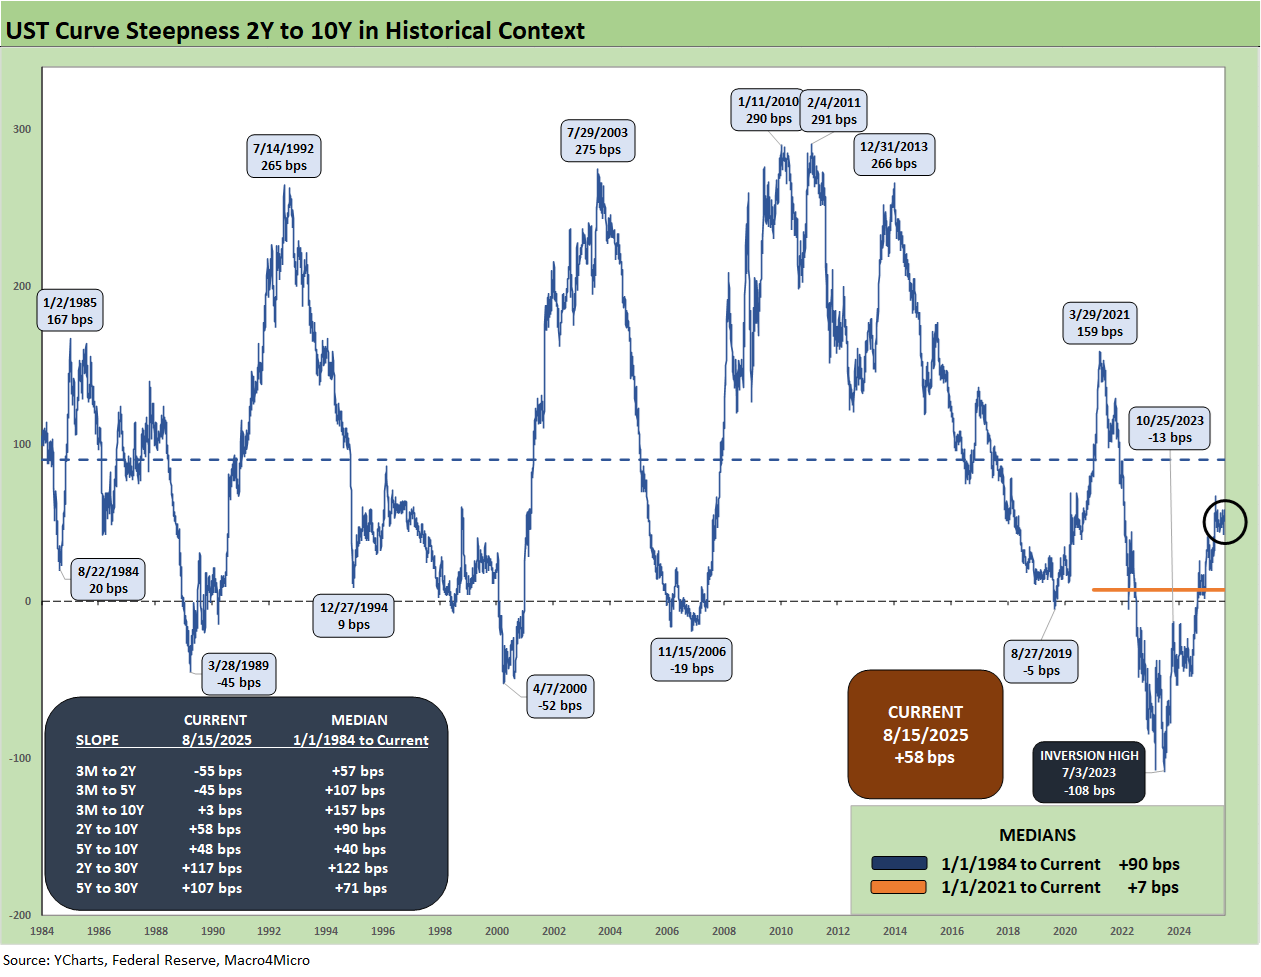
The above chart updates the 2Y to 10Y UST slope after a modest upward shift across 3Y to 30Y this week. The above box within the chart updates the UST curve segments we follow with the latest slope and long-term medians.
The current upward slope of +58 bps has normalized from the peak inversion of -197 bps in May 2023. The +58 bps is well above the post-COVID median but still below the long-term median of +90 bps from 1984.
Currently, the market anticipates 2-3 fed funds rate cuts by year end if inflation cooperates. Trump is in part focusing on interest rate costs from record deficits that will continue each year. Powell and the FOMC have been prioritizing economic pain risk and an impaired policy arsenal that would come with stagflation. After all, the Fed has a legal mandate to do exactly that.
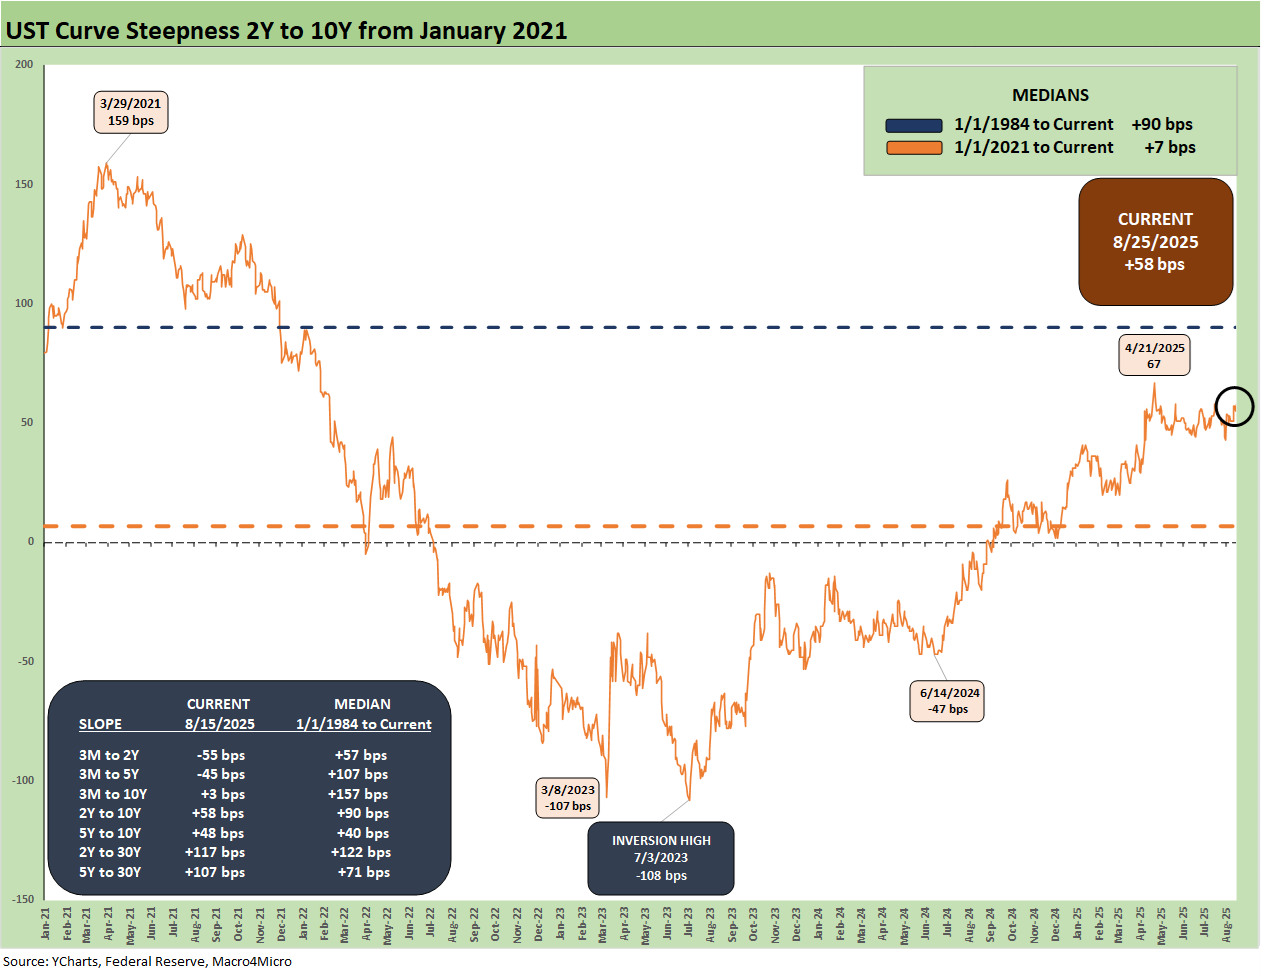
The above chart shortens the timeline to a start date in Jan 2021 when ZIRP was in place to get better granularity on the post-COVID curve shapeshifting. We see the steepening to a peak of +159 bps in March 2021 before the plunge to a peak inversion of -108 bps in July 2023.
While Powell and the FOMC should have moved earlier in 2021, we don’t hear much reference back to Trump demanding negative fed funds as late as May 2020. He was advising the same in 2019 before COVID.
Trump understandably looks for easing and especially when he knows economic growth rates are fading (even if he represents growth and the economy are booming). Trump demanded easing in 2019 when the Fed eased multiple times in 2H19 (see UST Curve History: Credit Cycle Peaks10-12-22). The Fed did not ease on Trump demands but did so on economic weakness (weak capex and weak exports). That was during the “greatest economy in history.”
A rose is still a slowdown by any other name…or something like that…
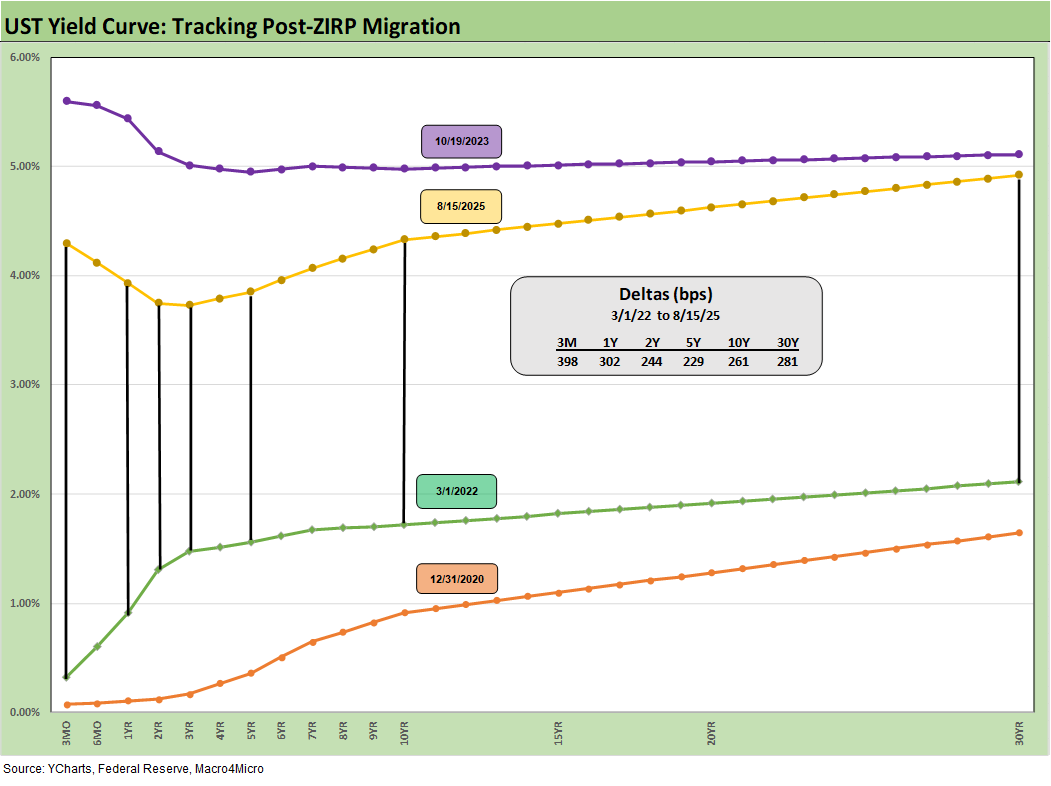
We wrap this week’s State of Yields with an update of the running UST deltas since March 1, 2022 just ahead of the end of ZIRP (effective 3-17-22). We include the 12-31-20 UST curve and 10-19-23 peak UST curve as frames of reference. We see the current U:ST curve still closer to Oct 2023 and especially on the long end and the 30Y.
See also:
Footnotes and Flashbacks: Asset Returns 8-16-25
Mini Market Lookback: Rising Inflation, Steady Low Growth? 8-16-25
Industrial Production July 2025: Capacity Utilization 8-15-25
Retail Sales Jul25: Cautious Optimism in the Aisles 8-15-25
PPI: A Snapshot of the Moving Parts 8-14-25
CPI July 2025: Slow Erosion of Purchasing Power 8-12-25
Iron Mountain Update: Records ‘R’ Us 8-11-25
Footnotes & Flashbacks: Credit Markets 8-11-25
Footnotes & Flashbacks: State of Yields 8-10-25
Footnotes & Flashbacks: Asset Returns 8-10-25
Mini Market Lookback: Ghosts of Economics Past 8-9-25
Macro Menu: There is More Than “Recession” to Consider 8-5-25
Mini Market Lookback: Welcome To the New World of Data 8-2-25
Happiness is Doing Your Own Report Card 8-1-25
Payrolls July 2025: Into the Occupation Weeds 8-1-25
Employment July 2025: Negative Revisions Make a Statement 8-1-25
Employment Cost Index 2Q25: Labor in Quiet Mode 7-31-25
PCE June 2025: Prices, Income, and Outlays 7-31-25
2Q25 GDP: Into the Investment Weeds 7-30-25
2Q25 GDP: First Cut of Another Distorted Quarter 7-30-25
United Rentals: Cyclical Bellwether Votes for a Steady Cycle 7-29-25
JOLTS June 2025: Lower Openings and Hires, Higher Layoffs YoY and Flat MoM 7-29
25
Mini Market Lookback: Mixed Week Behind, Big Week Coming 7-26-25
Durable Goods Jun25: Air Pocket N+1 7-25-25
Taylor Morrison 2Q25: Resilient but Feeling the Same Macro Pressure 7-25-25
New Home Sales June 2025: Mixed Bag 7-24-25
Existing Home Sales June 2025: The Math Still Doesn’t Work 7-23-25
PulteGroup 2Q25: Still-Lofty Margins see a Mild Fade 7-23-25
D.R. Horton 3Q25: Material Slowdown Still Good Enough 7-22-25