
Footnotes and Flashbacks: Asset Returns 8-16-25
The equity markets cruise along and credit spreads narrow while the UST sees another setback.


Washington tariff analysis is a new parlor game. Blindfold included.
The rebound in small caps led the equity rally this past week while credit spreads moved tighter and further into the range of earlier credit bubbles as a good June quarter earnings season winds down. Russell 2000 made it into the top quartile for the 1-week and 1-month timeline and got out of the bottom quartile YTD.
Duration setbacks undermined bond returns this week on a bear steepener move with the combined effects of CPI and PPI hitting the UST even as a modest increase on CPI let the equity markets run (see CPI July 2025: Slow Erosion of Purchasing Power 8-12-25, PPI: A Snapshot of the Moving Parts 8-14-25).
We will now move into the July quarter earnings season with Walmart teed up this week along with Home Depot. Retailers bring a range of perspectives and strategies (pricing, product mix, sourcing changes, cost cutting offsets, etc.) on tariffs and how those will impact a low margin industry that is the most exposed to tariff challenges.
We should get some color during retail earnings season on the Mexico, Canada, China, and Asia tariff effects. Among other issues is the complexity of new tariffs vs. USMCA compliance as a mitigating factor for those with heavy North American trade partner exposure (e.g. La-Z-Boy).
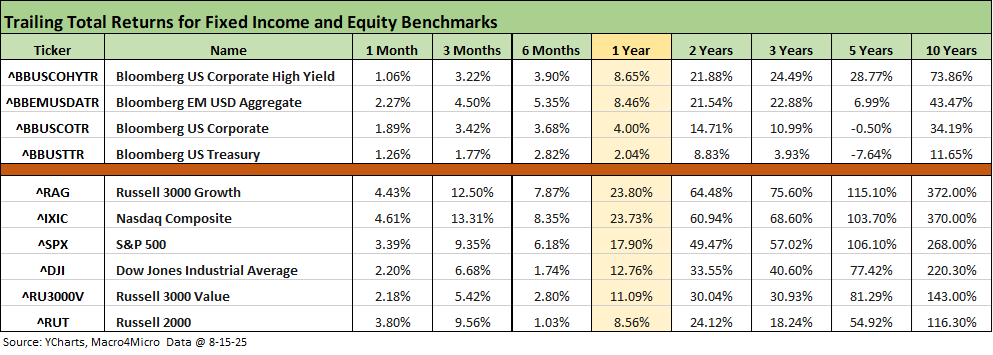
The above high-level debt and equity benchmarks show a very serene 1-month and 3-month timeline considering the early April tariff noise. The rolling 1-month debt return numbers are all better this week despite the UST shift.
The 1-month equity numbers are mostly better (4 of 6) but with all 6 equity index lines positive for 1-month vs. 3 negative last week. The 3-month equity returns reflect the strong rebound off of the Liberation Day plunge.
The rolling return visual
In the next section, we get into the details of the 32 ETFs and benchmarks for a mix of trailing periods. Below we offer a condensed 4-chart view for an easy visual on how the mix of positive vs. negative returns shape up. This is a useful exercise we do each week looking for signals across industry groups and asset classes.
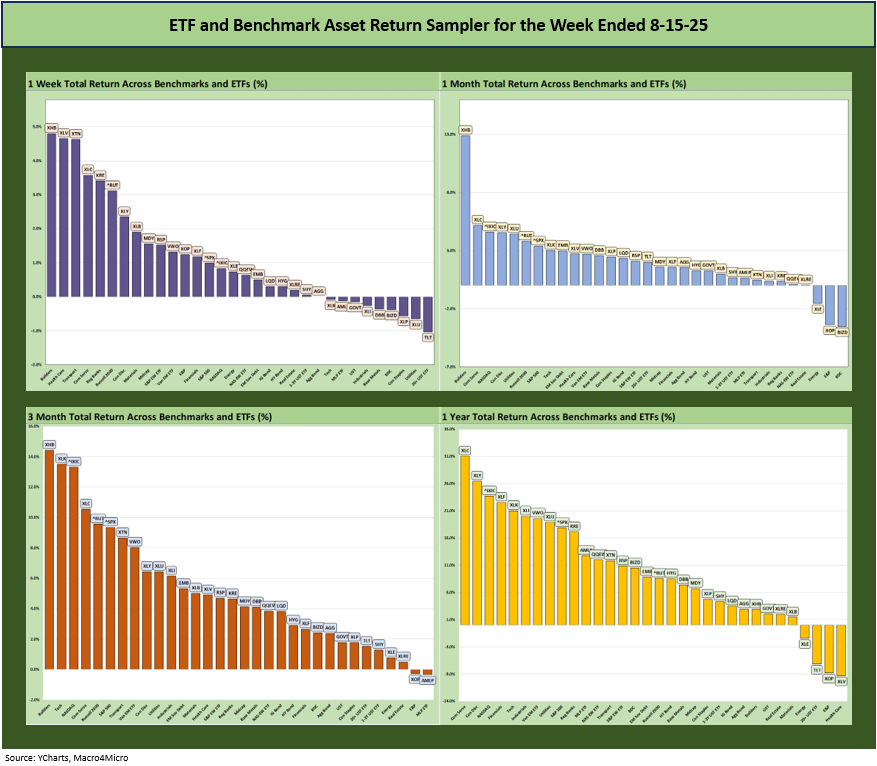
The symmetry of returns across the recent timelines has been overwhelmingly positive, and that includes the YTD (not shown above) which we detail below. The policy uncertainty and turmoil of tariffs has been more muted in the absence of escalating trade wars.
The quick China truce and pause avoided what could have been a catastrophic outcome of “empty shelves” and stalled assembly lines. That China risk has not been erased with another pause in place for now, but confidence is higher for avoiding the worst case in that trade relationship. Mexico got an extension of sorts with Canada essentially unresolved (no “deal”) and dealing with a bevy of new tariffs. The USMCA is up for review in mid-2026 and could (in theory) be terminated before then, but that drama awaits the new year.
All in, the 3 largest national trading partners (ex-EU as a bloc) are still works in progress but escalating trade clashes were dodged with vague “deals” and a lack of legally binding documentation.
The Magnificent 7 heavy ETFs…
Some of the benchmarks and industry ETFs we include have issuer concentration elements that leave them wagged by a few names. When looking across some of the bellwether industry and subsector ETFs in the rankings, it is good to keep in mind which narrow ETFs (vs. broad market benchmarks) get wagged more by the “Magnificent 7” including Consumer Discretionary (XLY) with Amazon and Tesla, Tech (XLK) with Microsoft, Apple, and NVIDIA, and Communications Services (XLC) with Alphabet and Meta.
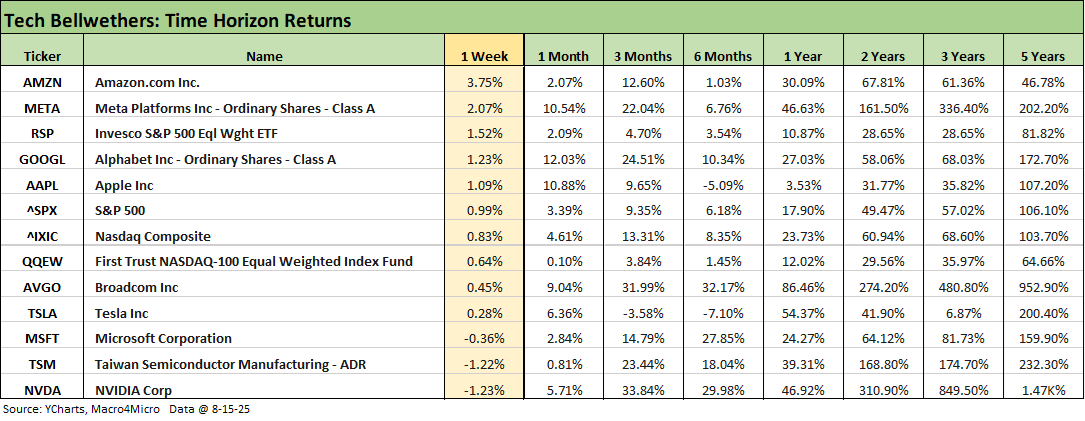
We already addressed the tech bellwethers in our Mini Market Lookback: Rising Inflation, Steady Low Growth? (8-16-25). The divergence of the Mag 7 across the timelines is self-evident with some less than magnificent performances and some much more volatile than others (notably Tesla).
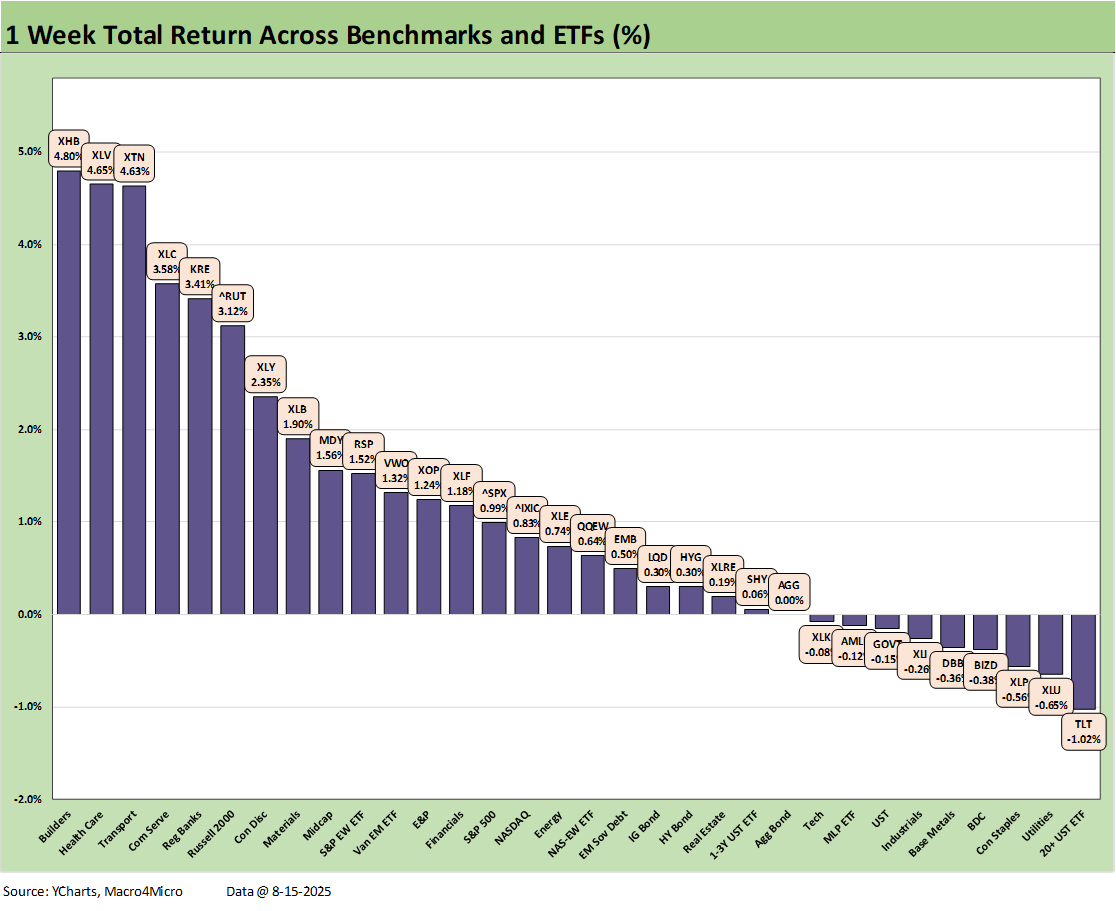
The 1-week returns were already covered in our Mini Market Lookback: Rising Inflation, Steady Low Growth? (8-16-25) with 23 positive, 8 negative and 1 ETF (AGG) at zero.
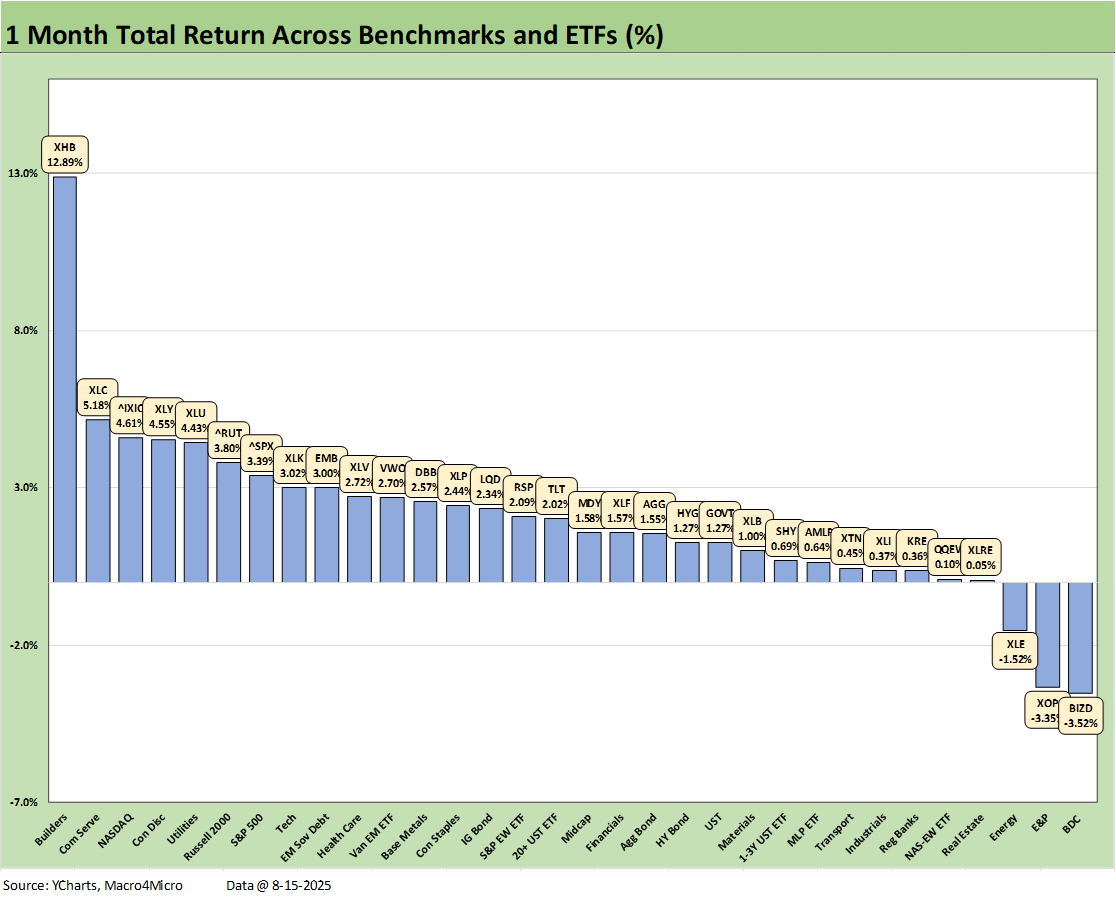
The 1-month timeline weighed in at 29-3. We see an extremely strong rebound evident in the Homebuilding ETF (XHB) at +12.9%. XHB was at the top of the trailing 1-year returns at the end of 3Q24 before it took a multi-month beatdown on slowing sales and higher mortgage rates along with softening margins and anxiety around tariffs (XHB includes suppliers). That trend has been turning of late with XHB now climbing back up into the upper end of the YTD second quartile for returns after it had been in the bottom for a while.
The top quartile sees a healthy tech-centric mix and some Mag 7 heavy ETFs along with a promising rally from the Russell 2000 after a period of weak performance for small caps YTD. The bottom of the rankings includes only 3 negative ETFs with two in Energy (XOP, XLE) and BDCs (BIZD) on the bottom.
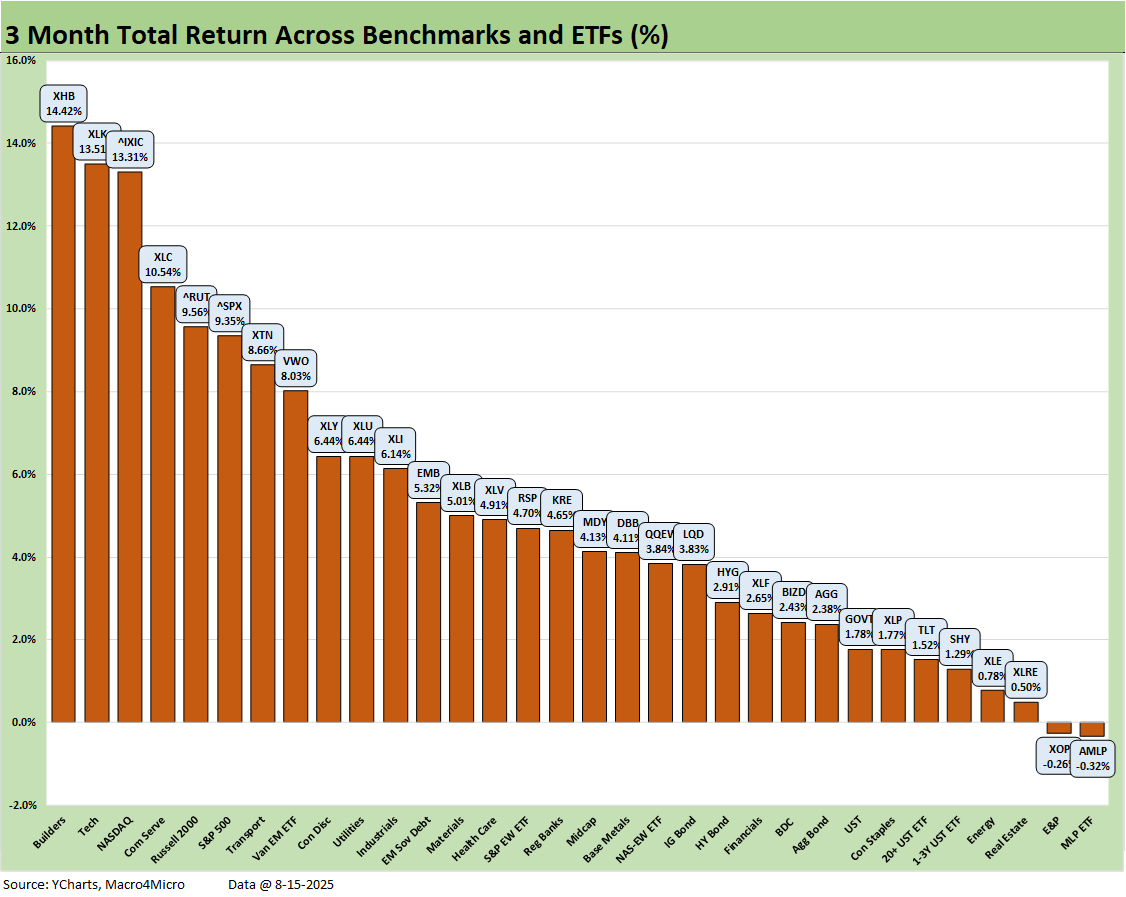
The 3-month at a score of 30-2 includes only 2 ETFs that were minimally negative with the Midstream Energy ETF (AMLP) and the E&P ETF (XOP). The top tier reflects the big move of Homebuilders (XHB) at #1 followed by the Tech ETF (XLK) at #2, NASDAQ at #3, and Communication Services at #4 with the small cap Russell 2000 rounding out the Top 5.
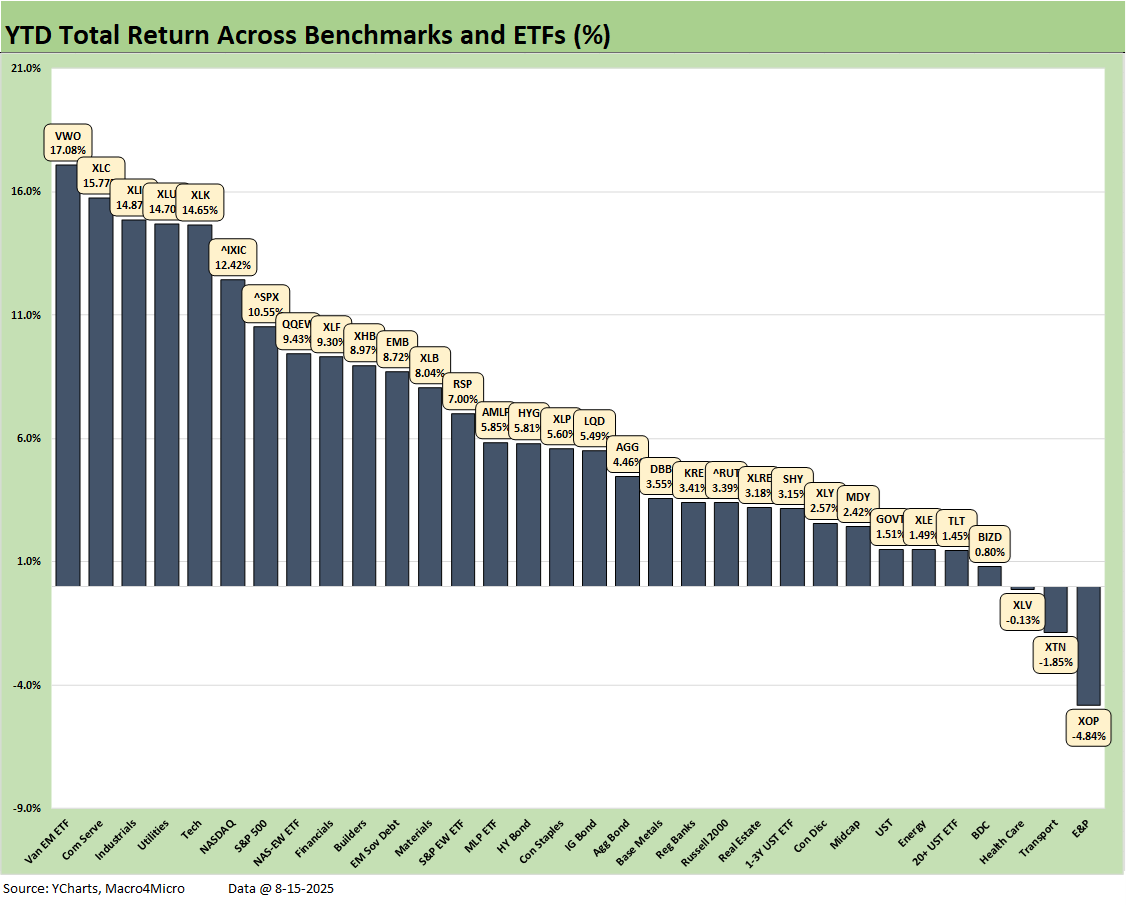
The favorable balance of equities and rates across the YTD period are evident in the 29-3 score with 3 chronic laggards from the year on the bottom with E&P (XOP) in last place behind Transports (XTN) and Health Care (XLV) who were both also in the negative zone. All the bond ETFs are at least in positive range, but the long duration UST ETF (TLT) is the lowest of the bond group and in the bottom quartile with GOVT.
The leaders showed healthy breadth with Industrials (XLI) and Utilities (XLU) in the Top 5 and both the NASDAQ and S&P 500 in the top quartile with the Equal Weight NASDAQ 100 ETF (QQEW) in the mix.
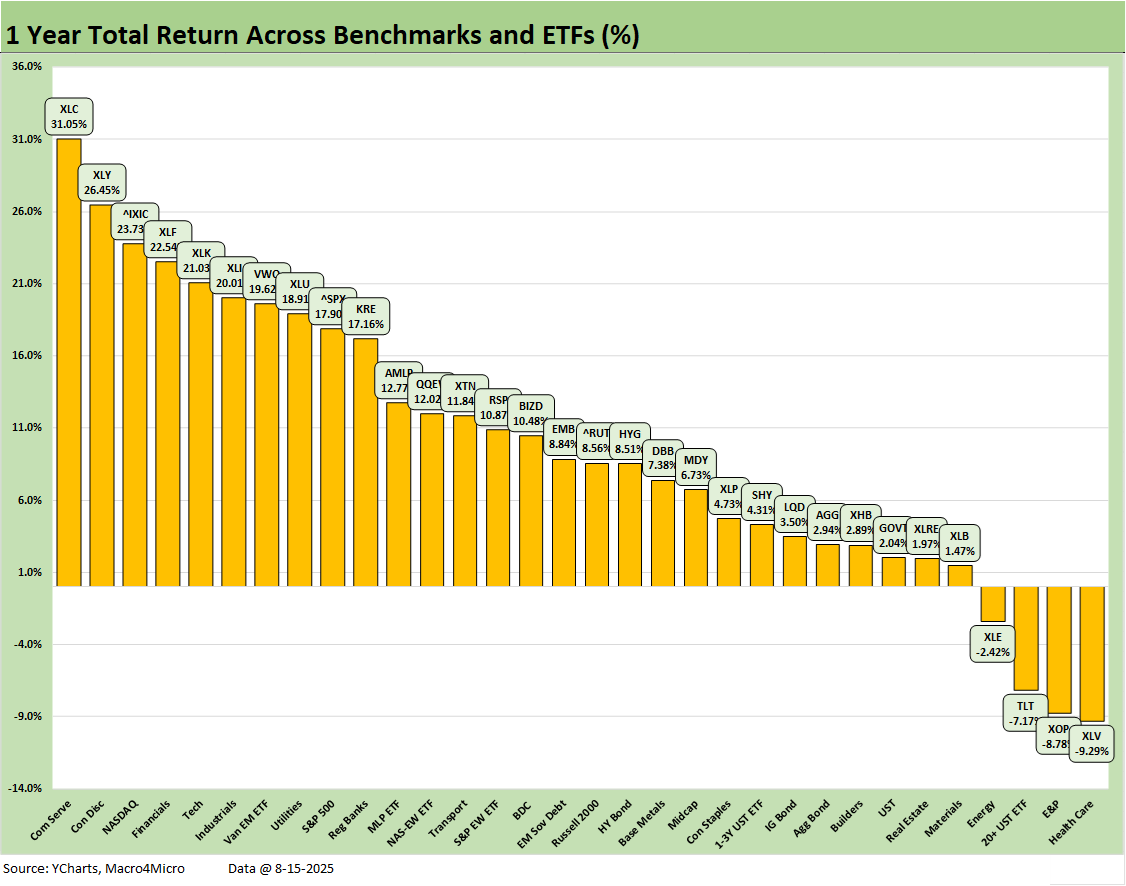
The LTM period posted a score of 28-4. We see a healthy mix in the top quartile with a heavy mix of tech buckets along with Financials (XLF), Industrials (XLI), and Utilities (XLU). We see 6 of 7 bond ETFs in positive range with only the long-duration UST 20+Y ETF (TLT) in negative range alongside two energy ETFs (XOP, XLE) and the Health Care ETF (XLV) at a weak -9.3%.
The run rates above include just under 5 months of the 2024 banner year in equities. The year 2024 was Part 2 of the best 2-year run in the S&P 500 since the late 1990s, so that sets a high bar (see Footnotes & Flashbacks: Asset Returns for 2024 1-2-25). The S&P 500 return of +25% for 2024 (26% 2023) and more than double those for the cumulative 2 years (2023 through 2024) will be very hard to match in 2025-2026.
As of now, the YTD S&P 500 is +10.5% while the LTM is +17.9%. The S&P 500 needs to finish strong in the home stretch of 2025 to match either 2024 or 2023. That is certainly doable if the Fed offers some support and tariff policies do not translate into more clashes with trade partners.
The broad market benchmark performance in 2023-2024 on the way to the LTM 2025 above undermines the weak premise of the Trump rhetoric that the country was “dead” or “dying” until Trump came along. You can also look at annual GDP or payrolls (even after the revisions). Trump’s GDP growth numbers to end 2025 and equity market performance will struggle to beat those periods, and 2025 faces a high probability of ending the year with higher inflation and a higher unemployment rate than 2024.
See also:
Mini Market Lookback: Rising Inflation, Steady Low Growth? 8-16-25
Industrial Production July 2025: Capacity Utilization 8-15-25
Retail Sales Jul25: Cautious Optimism in the Aisles 8-15-25
PPI: A Snapshot of the Moving Parts 8-14-25
CPI July 2025: Slow Erosion of Purchasing Power 8-12-25
Iron Mountain Update: Records ‘R’ Us 8-11-25
Footnotes & Flashbacks: Credit Markets 8-11-25
Footnotes & Flashbacks: State of Yields 8-10-25
Footnotes & Flashbacks: Asset Returns 8-10-25
Mini Market Lookback: Ghosts of Economics Past 8-9-25
Macro Menu: There is More Than “Recession” to Consider 8-5-25
Mini Market Lookback: Welcome To the New World of Data 8-2-25
Happiness is Doing Your Own Report Card 8-1-25
Payrolls July 2025: Into the Occupation Weeds 8-1-25
Employment July 2025: Negative Revisions Make a Statement 8-1-25
Employment Cost Index 2Q25: Labor in Quiet Mode 7-31-25
PCE June 2025: Prices, Income, and Outlays 7-31-25
2Q25 GDP: Into the Investment Weeds 7-30-25
2Q25 GDP: First Cut of Another Distorted Quarter 7-30-25
United Rentals: Cyclical Bellwether Votes for a Steady Cycle 7-29-25
JOLTS June 2025: Lower Openings and Hires, Higher Layoffs YoY and Flat MoM 7-29
25
Mini Market Lookback: Mixed Week Behind, Big Week Coming 7-26-25
Durable Goods Jun25: Air Pocket N+1 7-25-25
Taylor Morrison 2Q25: Resilient but Feeling the Same Macro Pressure 7-25-25
New Home Sales June 2025: Mixed Bag 7-24-25
Existing Home Sales June 2025: The Math Still Doesn’t Work 7-23-25
PulteGroup 2Q25: Still-Lofty Margins see a Mild Fade 7-23-25
D.R. Horton 3Q25: Material Slowdown Still Good Enough 7-22-25
Mini Market Lookback: Macro Muddle, Political Spin 7-19-25
Housing Starts June 2025: Single Family Slips, Multifamily Bounces 7-18-25