
2Q25 GDP: Into the Investment Weeds
We detail the contributions of the mixed results in the Fixed Investment lines as part of a weak 2Q25 for GPDI.

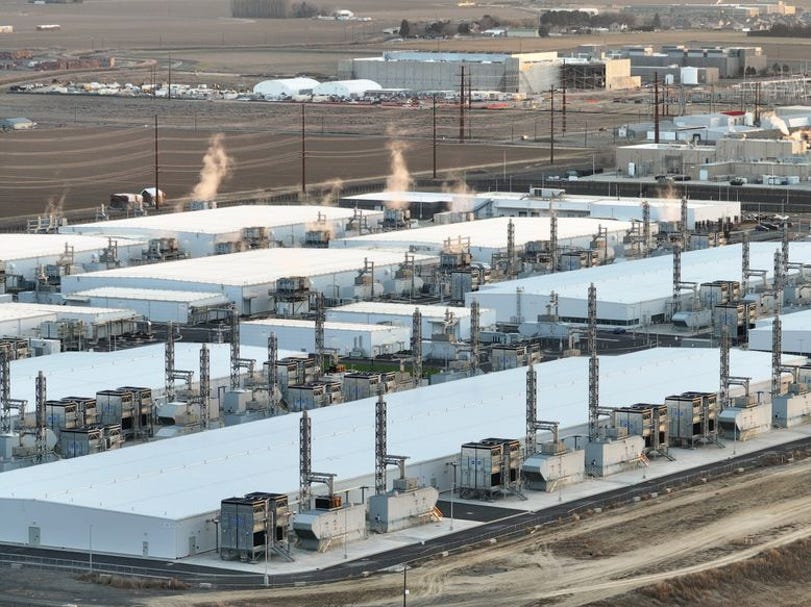
Data and power makes the world go’round…
The overall GPDI contribution to GDP of -3.09% saw another quarter of inventory related distortions with only a +0.08%contribution to GDP from the fixed investment lines that serve as core indicators of business cycle health.
A relatively weak fixed investment print in this morning’s GDP under a poor GPDI headline number gives a new set of data that rolls into varied levels of confidence from capital goods and consumer durables manufacturing to the secular lift seen in technology (AI, data centers power, etc.). The tariff backdrop and material cost challenges leave more than a few outstanding questions on what influence policy changes this year will have on longer-term strategic and capital planning decisions. These things take time.
The debate on how to decouple the tariff distortions, tax bill tailwinds for equipment, and AI and data investment effects will play out in the quarters to come. There is some clear divergence in these early innings with EV projects under siege, LNG and public sector infrastructure rolling, and data centers and power needs soaring.
The massive inventory distortions in GDP may be the most prominent short-term effect, but the marked decline of -10.3% QoQ in Structures investment raises some doubts on the early efficacy of tariffs for bringing domestic manufacturing capabilities back. Technology and IP investments are unshakeable at this point at least.
Equipment investment increased 4.8% after a very strong 1Q25 performance of 23.7%, but the growth was clustered in aircraft, computers, and tech supporting industries. These areas continue to prop up the overall equipment investment where other areas experience stagnation and some declines.
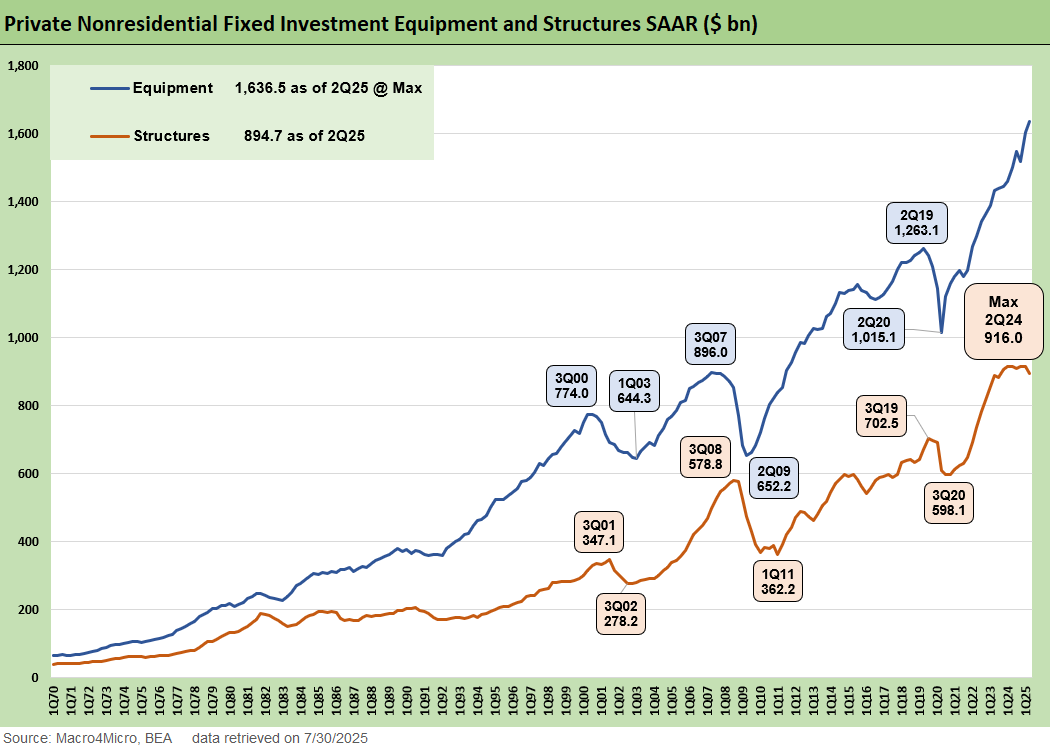
The above chart breaks out the long-term history of private investment in Structures and Equipment under the GPDI lines in the GDP release. For context, GDPI overall is about 18% of total GDP and these two above are representative of the capex trends. They total just about 8.4% of GDP.
This quarter’s release sees a notable divergence between Equipment investment up $33.7 bn set against a -$19.1 bn decline in Structures. The main drivers for Equipment investment this quarter narrowed in scope, driven by $26.1 bn of computer and $19.0 bn of aircraft equipment investments. The scale of those investment needs to keep up with demand masks weakness in the broader manufacturing picture that sees tepid investment growth even with policy incentives this year.
As the endgame on tariff levels starts to become clearer, the use of Section 232 actions especially on semiconductors or chips is still a major concern for the levels above and still leaves risk to volumes, even if the nominal amounts might keep up. We cannot avoid the issue of lingering legal challenges to tariffs, but the SCOTUS deck is pretty stacked once everything proceeds to the legal finish line.
Structures investments pulled back significantly this quarter after such a major runup in the post-COVID period. How much of the slowing activity here is tied to uncertainty in policy and costs and how much is tied to confidence in cyclical outlook is difficult to disaggregate in this point, but so far this year we naturally see at least some short-term hesitation without the tariffs and legal challenges set. For many industries, project economics remain unclear. The theory remains that the policy incentives laid out this year stand to bolster these investments. Though there have been some major “commitments” to investments, most are yet to materialize as contractual commitments and capex flows.
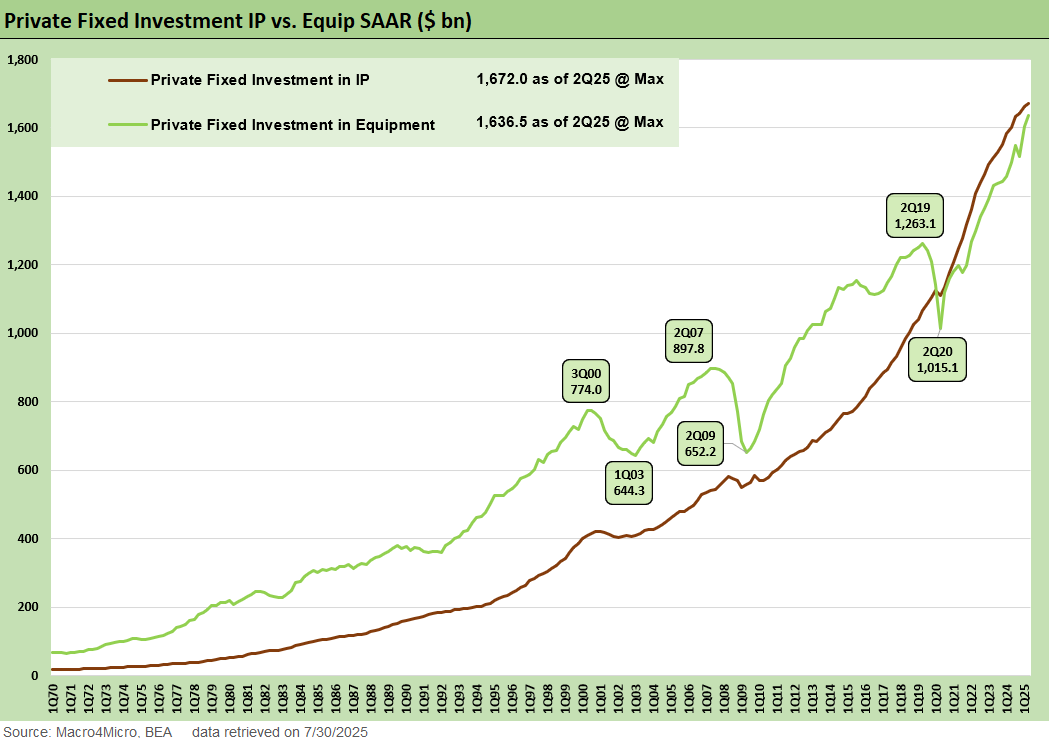
This chart frames the Fixed Investment in Equipment line vs. the Intellectual Property investments. The lead taken by IP investment run rate since 2Q20 underscores the importance of digital infrastructure and highlights how intangible assets now dominate capital planning for firms navigating supply chain and labor cost volatility. However, the rapid growth for both reflects a convergence of drivers as AI and data infrastructure have become key growth drivers.
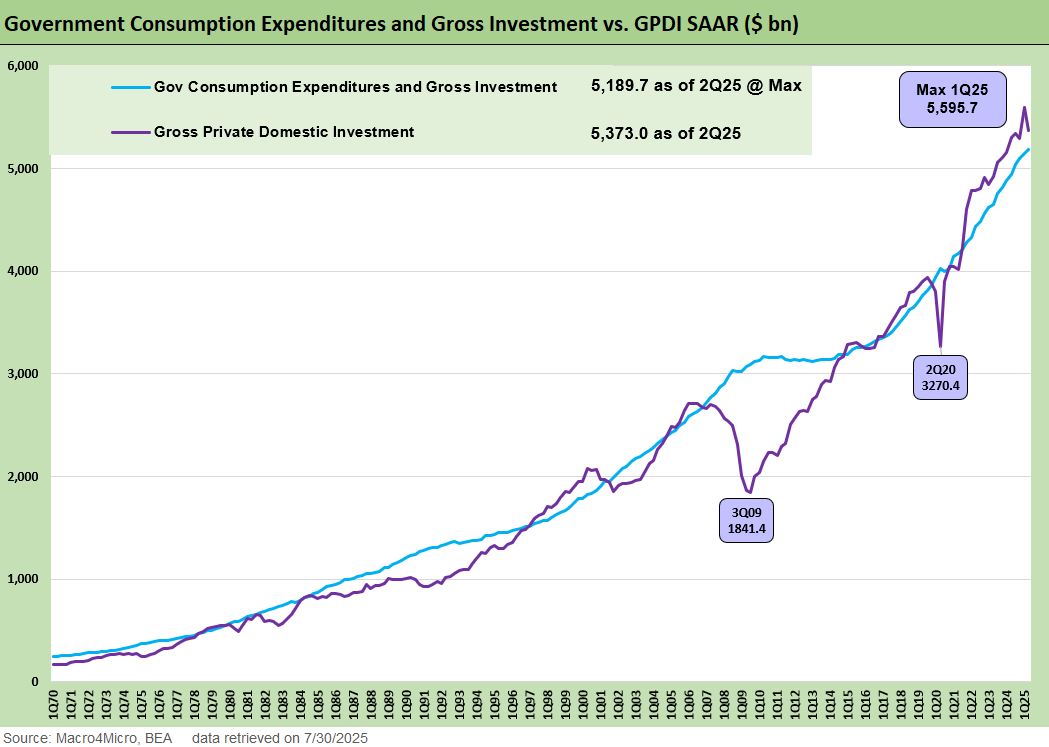
The above chart compares the scale of Public and Private investments. Government spending continued to grow to a new nominal all-time high as the notable reduction in nondefense spending were more than offset by increases at State and Local levels.
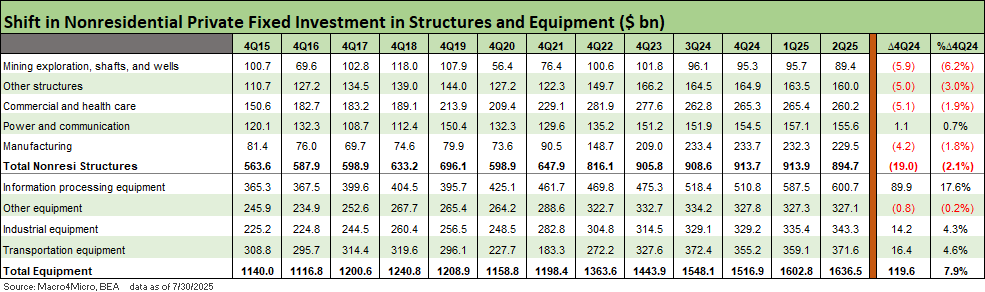
In the above chart and the following charts, we detail the private investment line items and their history to demystify the Equipment and Structures spending. We’ve previously looked at this from a Biden centric, Post-COVID investment shift but now change the comparison at 4Q24 to start framing the immediate impacts of Trump policy and business response. We leave in the medium-term history for those who want to see the path up to today. As a reminder, these tables use nominal dollar amounts, and the derived percentages are thus different than those in Table 1 of the GDP release.
The scale of growth for the Information Processing equipment line continues to dwarf the investment in other areas this year and even drives the areas of industrial equipment investment seeing growth this year. The outlook for construction and other equipment at least remain stable at this point and the upcoming periods will provide insight on whether we see a similar short-lived investment impulse due to the tax bill like 2017 or a more sustained expansion. The sugar high theory of 2018 cannot be ruled out into 2026, but there is a lot more on the mega project table already across a wide range of industries and markets.
On the Structures side, we still see a marked slowdown after a period of rapid growth in all areas except Power and Communication contracted this year. Another quarter of weakness in the Structures numbers reflects further hesitation in longer cycle bets, and even though trade policy uncertainty still loomed over the quarter, these levels could reflect a period of slower growth for longer.
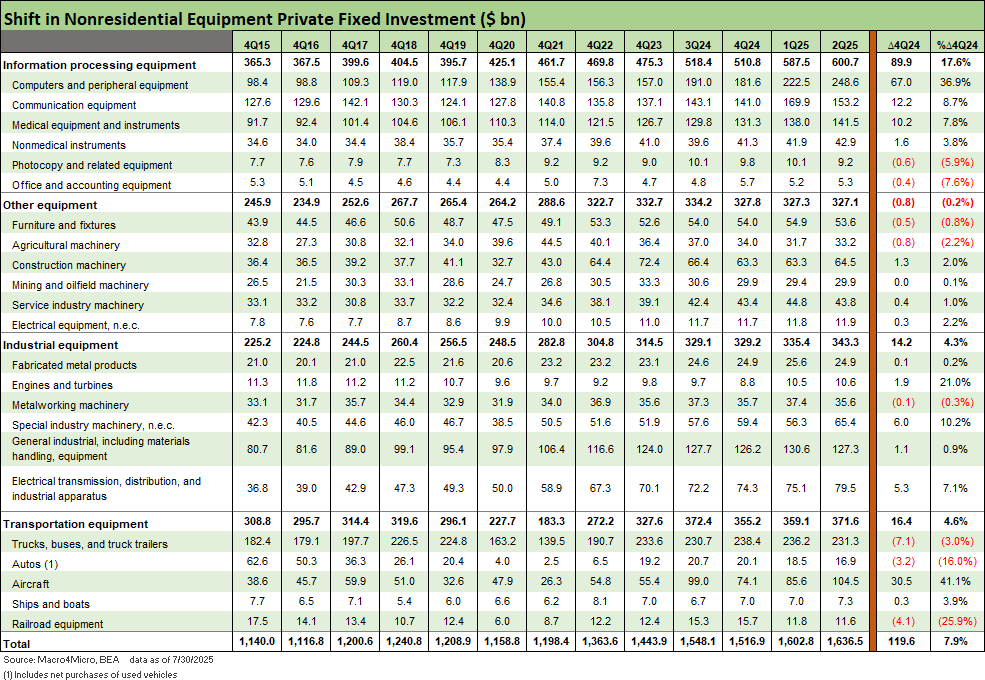
The above chart narrows the focus to the Equipment categories for granular details. Computers and aircraft are standouts this year with minor contributions from Communications and Medical Equipment. In the Industrial equipment lines, we see some growth in sectors adjacent to the IP boom with semiconductors accounted for in the Special Industry line.
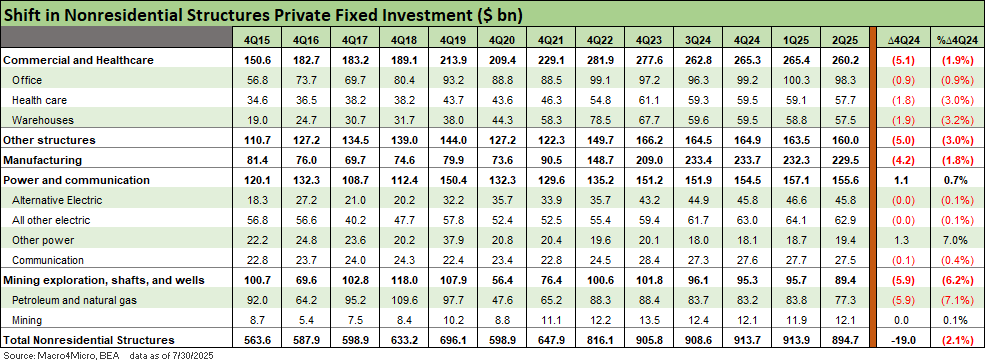
The last chart runs a similar exercise for the Structures subcategories. The lackluster growth this year spans all the lines with an exception for Other power.
GDP comments:
2Q25 GDP: First Cut of Another Distorted Quarter 7-30-25
1Q25 GDP: Final Estimate, Consumer Fade 6-26-25
1Q25 GDP 2nd Estimate: Tariff and Courthouse Waiting Game 5-29-25
1Q25 GDP Advance Estimate: Roll Your Own Distortions 4-30-25
1Q25 GDP: Into the Investment Weeds 4-30-25
Trump's “Greatest Economy in History”: Not Even Close 3-5-25
Gut Checking Trump GDP Record 3-5-25
Presidential GDP Dance Off: Clinton vs. Trump 7-27-24
Presidential GDP Dance Off: Reagan vs. Trump 7-27-24
2024:
4Q24 GDP: The Final Cut 3-27-25
4Q24 GDP: Inventory Liquidation Rules 1-30-25
GDP 3Q24: Final Number at +3.1% 12-19-24
2Q24 GDP: Final Estimate and Revision Deltas 9-26-24
State Unemployment: A Sum-of-the-Parts BS Detector 6-30-24
1Q24 GDP: Final Cut Moving Parts 6-27-24