
Employment July 2025: Negative Revisions Make a Statement
Low tally for July was joined by sharp May and June revisions to take the two months lower by a combined -258K jobs.


About those spring job adds…
The theory that we went through the greatest 6 months in Presidential history had a rough week of gut-checking capped off with the worst rolling 3 months of payroll additions in years as May and June were hit with material downward revisions.
Team Trump will be hoping to blame the Fed, but they must walk the line of not admitting to any weakness in the core economy or soft sentiment tied to tariffs after so many victory laps, the complaints about worrisome health care moves in the signature big bill, and generally erratic policy signals sent to the consumer and corporate sectors. At the very least, the payroll number triggers the dual mandate alert for the Fed.
The downward revisions of -125K in May and another -133K in June added to the headline angst of only +73K in July. The Goods-producing category saw a loss of -13K with -11K in Manufacturing and a meager +2K in Construction as the reshoring theme has not yet sent goods producers scrambling to break ground. Major uncertainty on the transition mechanism from tariffs to demand and capex will linger even with the bonus depreciation a tailwind supporting investment in equipment. You need economic confidence in your project.
The service-providing sector is the usual anchor in payroll run rates, but they only added +96K jobs, held up by Health care and social assistance with the usually reliable Leisure and hospitality only at +5K. Professional and business services lost -14K jobs as more investors ponder the flip side of the AI boom, and how many support and admin roles might get erased in the months ahead.
At sea level, the uptick to a 4.2% unemployment rate in July (from 4.1% in June) from the Household Survey comes after a +221K increase in the total unemployed to 7.24 million, up from the 7.01million unemployed in June. The civilian labor force declined by -38K to 170.34 million (participation rate declined by -0.1% to 62.2%). The 4.2% unemployment rate (7,236K/170,342K = 4.2%) is still strong in historical context and in a narrow range. The total employed in the labor force declined by -260K to 163.1 million. As a bad sign, the U-6 notably saw 2 ticks higher in July to 7.9%.
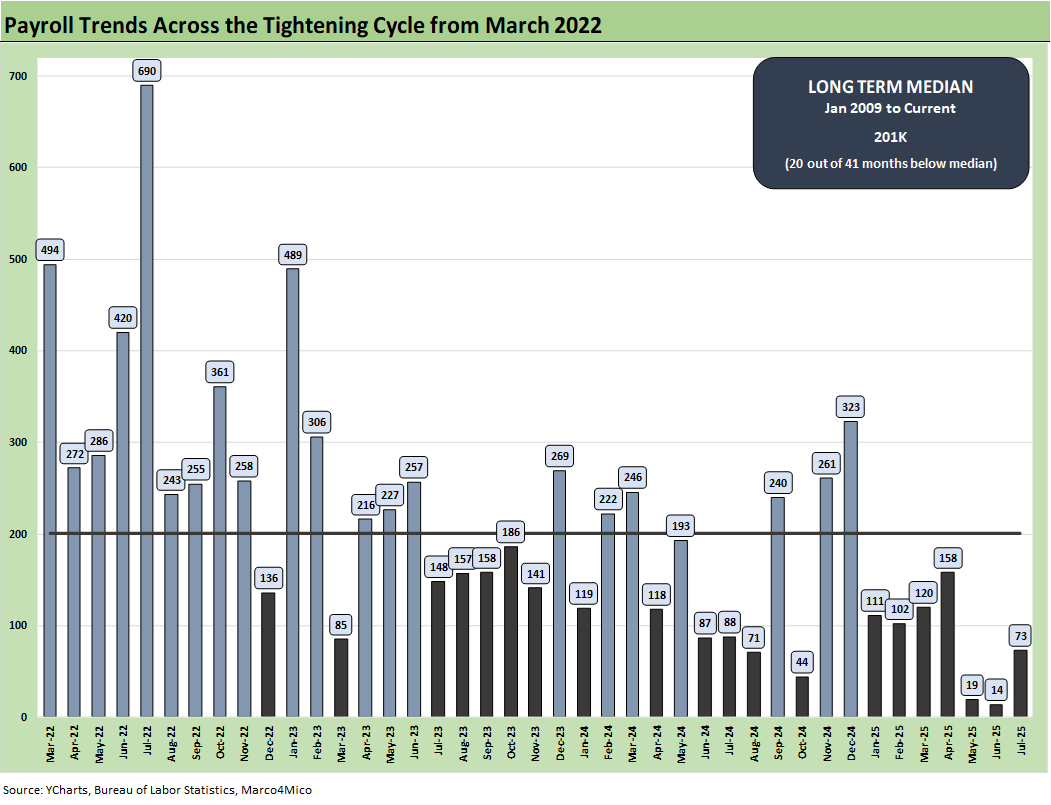
The above chart plots the payroll additions since the tightening cycle began in March 2022. May and June 2025 just set new lows. We look at some more line item history in our review of occupational deltas (to be posted later), but this is the worst rolling 3-month average since COVID.
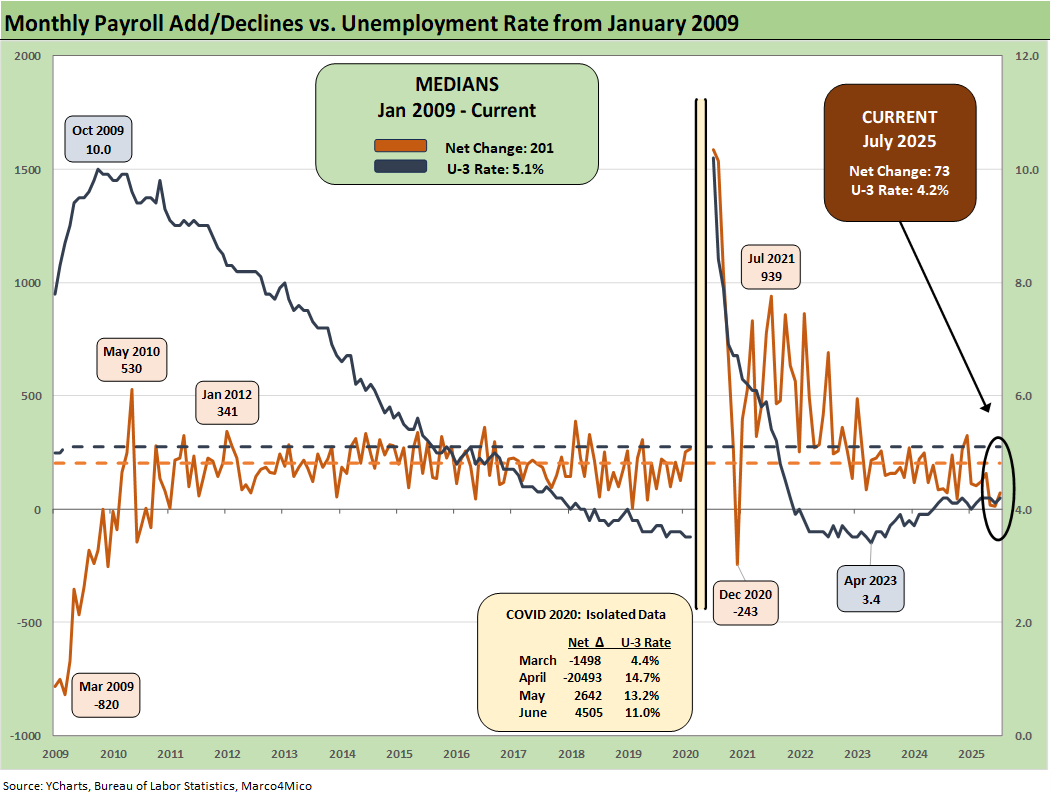
The above chart plots the running job adds/decline since Jan 2009 against the unemployment rate, which ticked higher to 4.2% from 4.1% MoM. We isolate the worst months of the COVID dislocations in the above box for better visuals to capture the other periods.
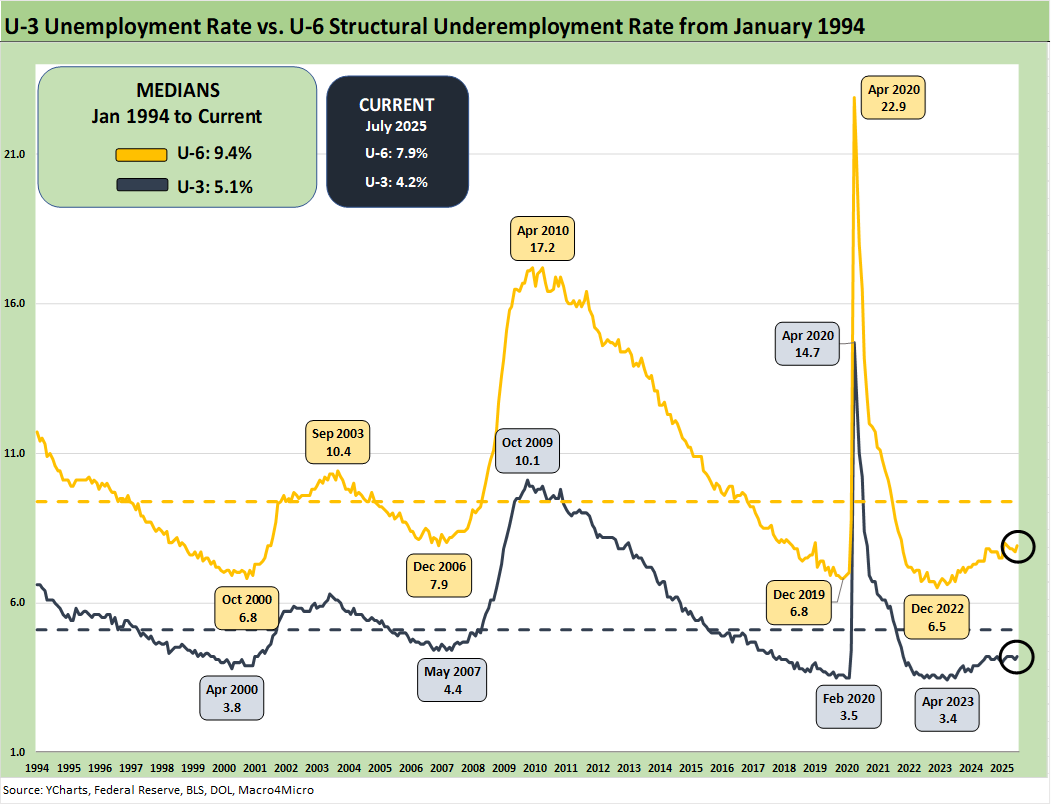
The above chart updates the time series for the U-3 unemployment rate and U-6 structural underemployment rate across the years from 1994. The current U-3 rate ticked higher to +4.2%. As a reminder, the U-6 metric is defined with the numerator as “total unemployed + persons marginally attached to the labor force + total employed part time for economic reasons.” The denominator is “civilian labor force + workers marginally attached to the labor force.”
The U-6 rose to 7.9% from 7.7%. The U-6 rose sharply in Feb 2025 to 8.0% from 7.5% in Jan 2025. The current 7.9% is well above the 6% handles seen in spring of 2023. The U-6 is also up from the 7.8% level of last year during July 2024. The 7.9% U-6 is below the median from 1994 of +9.4%. That 9.4% includes the post-crisis shock and the longest recession since the Great Depression.
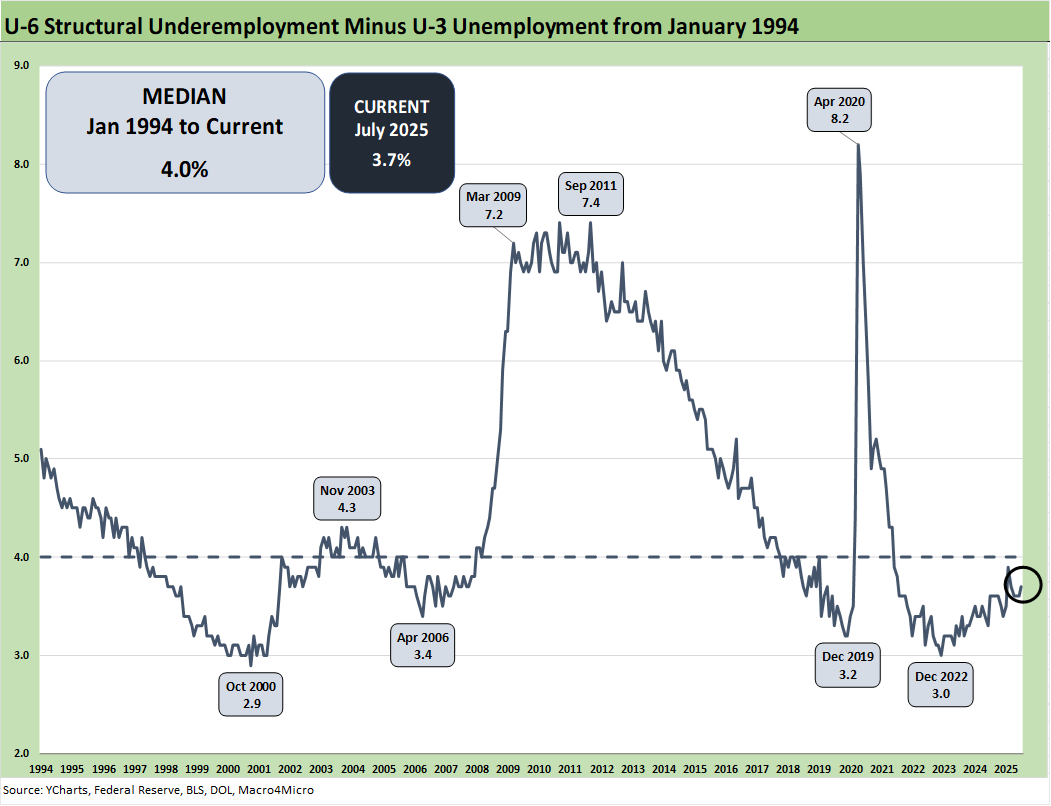
The time series above updates the U-6 minus U-3 differential as a measure of relative employment quality and to flag risks of major dislocations in large swaths of the economy (think oil patch in the late 1980s, tech bubble imploding 2001-2003, financial services and automotive in 2009).
The current 3.7% differential is modestly below the long-term median of 4.0%. The job ranks are steady now but in an eerie stretch of time as the tariffs get worked out, flow into working capital cycles, and impact capacity planning. Some of the issues get swept up in immigration and deportation numbers, but the analysis always comes back to the number of workers with paychecks. Employers will be making decisions to mitigate the tariff damage if they are not passing along the cost in prices or want to limit the scale of the price increases to customers.
Trade partners will need to make plans on how to address the tariff burdens and building in the US. They also have the option of waiting for fewer “like-minded” (a recurring Project 2025 phase) policy makers in Washinton. That could be a new White House resident who can also operate unilaterally and dial back some of these policies. The lack of legislated action in trade policy cuts both ways, and it is apparently easer to declare emergencies and make law from the White House than to legislate across the branches. That is not how the Democracy playbook works. The Brazil tariffs are among the most egregious with a trade partner where the US has a surplus (see US-Trade: The 50% Solution? 7-10-25).
The irony of the Trump action and reliable backup from SCOTUS is that Presidents might get a green light to “go rogue” at will on tariffs and keep changing the economic rules of the road. That is not conducive to sound planning with so many critical unknowns.
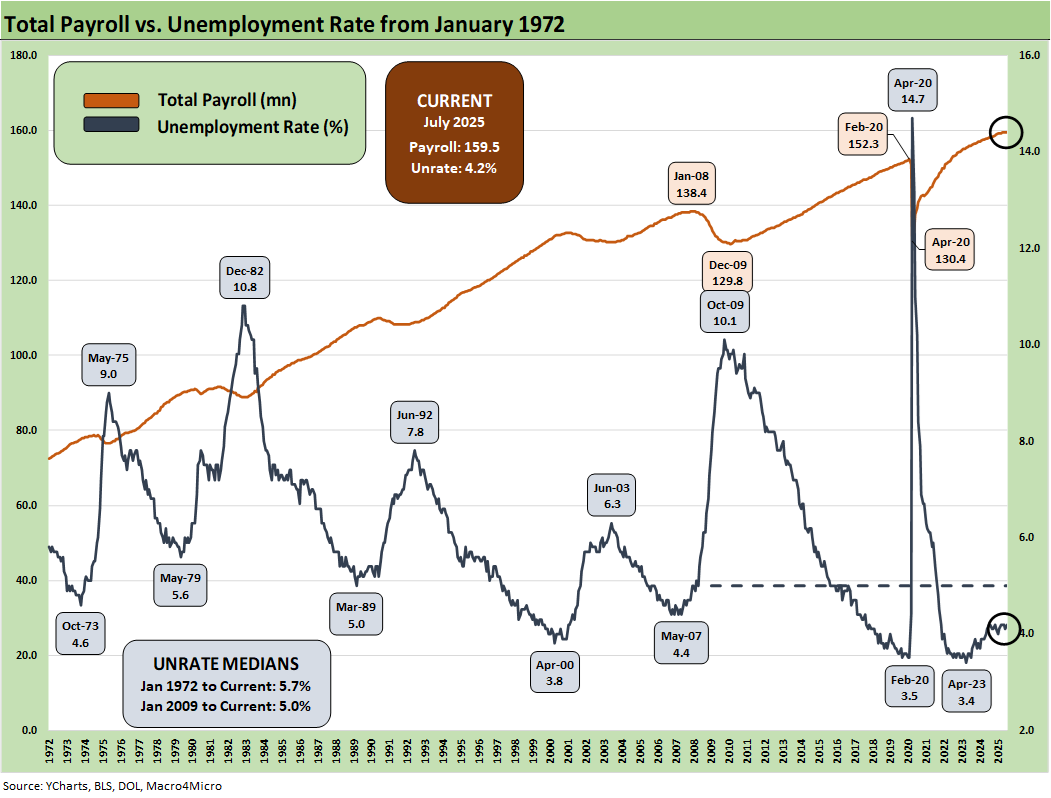
The above chart updates total payroll vs. the unemployment rate. More bodies with more paychecks is always by definition a good thing. The trick from here is how the consumer deploys that paycheck. We saw weaker trends in consumer income and consumption in the latest few releases (see PCE June 2025: Prices, Income, and Outlays 7-31-25). The 2Q25 GDP growth numbers also failed to inspire in the consumer numbers (see 2Q25 GDP: First Cut of Another Distorted Quarter 7-30-25). That followed similar weakness in 1Q25 GDP (see 1Q25 GDP: Final Estimate, Consumer Fade 6-26-25).
Soft survey numbers for consumers remain an area of focus even if they have climbed off the bottom and eased after the worst of the post-Liberation Day nerves and China trade worries. The consumer still has ample reason to get defensive and push saving rates much higher than what we saw in the monthly PCE numbers.
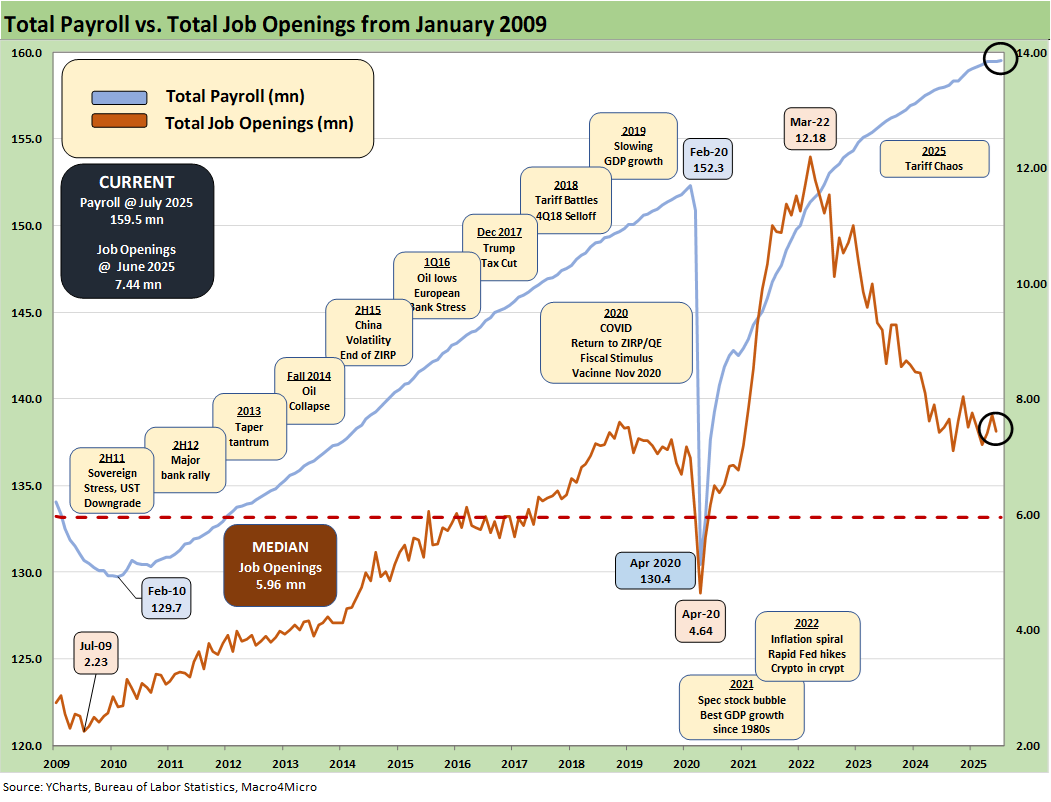
The above chart updates the total payroll number vs. job openings. The most recent JOLTS number (June 2025) was weaker in openings and mixed in the “hires vs. fires” balance (see JOLTS June 2025: Lower Openings and Hires, Higher Layoffs YoY and Flat MoM 7-29-25).
The June 2Q25 earnings season is still weighing in right now ahead of the later retail reporting periods (July quarter ends), and we will keep getting fresh rounds of information from more vulnerable sectors to the tariff threat such as retail and numerous auto-related companies. So far, the expense demands from tariffs have been very evident and notably in sectors such as automotive. The idea that the “seller pays” was false in fact (buyers write the check to customs) and beaten up empirically as steep price cutting by sellers has not been evident for the economic analysis.
The management teams have a lot of moving parts to factor into guidance whether quantitative or qualitative. The color in the trade literature and in economic releases such as the Beige Book that drill down into the weeds are clearly signaling the tariffs are a major problem. For some (notably retail and many small businesses), the threat can be existential. The cash drain in “writing the tariff check” and the hit to earnings from the expense line can impair trade credit and fuel bank credit problems for small businesses that are the backbone of payroll counts in the US. The payroll impact is already showing up.
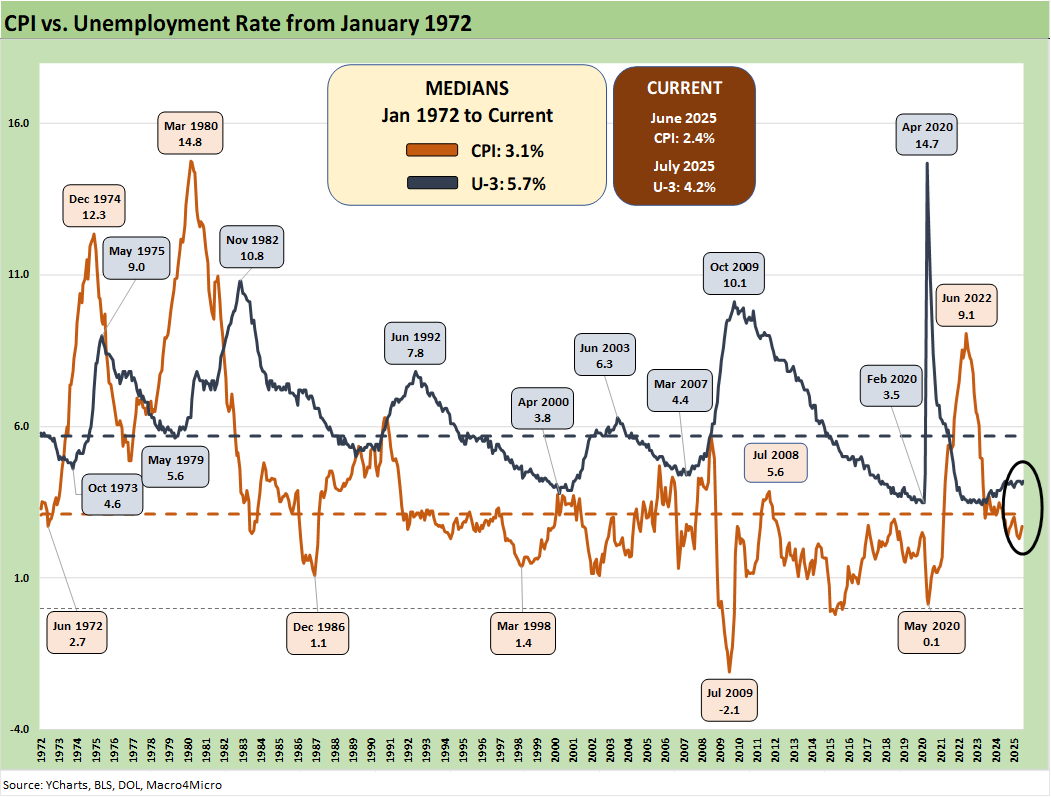
The CPI vs. Unemployment Rate time series will start getting more focus as stagflation debates get louder and the focus on upward pricing pressure from tariffs gets more reliably framed against potential layoffs and downsizings. At 4.2% on the U-3 in July 2025, that frames up favorably vs. the long-term median of 5.7% while the July 2025 headline CPI of 2.7% (2.9% Core CPI) remains under the long-term median of 3.1% (see CPI June 2025: Slow Flowthrough but Starting 7-15-25).
Inflation reports generally brought good news relative to expectations given the scale of the forward threat and lagging effects to be seen across working capital cycles. That said, the inflation creep by product groups is starting to show up in the data. The process moves slower than the demands for immediate gratification and instant resolution of the debate. Working capital turns, order rates, delivery, movement along the supplier chain contracts, and even the phase-in of tariffs itself all take time. That said, there are a lot more tariffs coming.
If there was no tariff threat, the FOMC would be easing more rapidly. The most recent FOMC meeting saw the Gang of 19 again raise median PCE inflation forecasts for 2025. Trump complains, but he does not even admit that the buyer writes the tariff check. Even with this recent news, he still paints the picture of “seller pays.” He occasionally implies the buyer bears more of the cost (which is separate from “who writes the check”), but then he defaults to the theme of collecting “hundreds of billions” from selling countries in Trump 1.0.
The buyer writes the check to customs, and that is a fact. The routine falsehoods from the White House around that topic is just one more sign that disinformation becomes a religion and captive partisan policy makers cannot deviate from the “message.”
In the end, unemployment is still low in multicycle context.
The 4.2% U-3 is in line with metrics that in the 1990s would have been called full employment. Being competitive in U-3 levels with the 1990s is a good thing, but we expect unemployment to keep rising across 2H25 as tariffs elicit reactions and small businesses continue to suffer.
The 1990s decade was actually the greatest economy in postwar US history and crushed the numbers of the post-2000 Presidents. That gets into the broader discussion of how high sovereign systemic debt can undermine growth and how the post-2000 years have been a case study in rising US sovereign leverage.
See also:
Employment Cost Index 2Q25: Labor in Quiet Mode 7-31-25
PCE June 2025: Prices, Income, and Outlays 7-31-25
2Q25 GDP: Into the Investment Weeds 7-30-25
2Q25 GDP: First Cut of Another Distorted Quarter 7-30-25
JOLTS June 2025: Lower Openings and Hires, Higher Layoffs YoY and Flat MoM 7-29-25
Footnotes & Flashbacks: Credit Markets 7-28-2025
Footnotes & Flashbacks: State of Yields 7-27-25
Footnotes & Flashbacks: Asset Returns 7-27-25
Mini Market Lookback: Mixed Week Behind, Big Week Coming 7-26-25