
JOLTS June 2025: Lower Openings and Hires, Higher Layoffs YoY and Flat MoM
The net takeaway from JOLTS is modest negative for payroll but no alarms in layoffs/discharges.


Will AI and tariff fallout roil the numbers in opening and hires?
There was little to celebrate in JOLTS with some negative signals from openings, hires, and YoY comps in layoffs. The June deltas were modest but still mark a setback from May.
Among the biggest declines in job openings, we see the usual services suspects in Health Care and Social Assistance along with Accommodation and Food Services. Durable Goods openings were down by -35K or around 12% MoM but Total Manufacturing was only -10K or just over -2%.
The more timely July payroll numbers will be out on Friday, and the search for inflation signals will be on the front burner with PCE to be released this week and what it could mean for the market tone on long rates and steepening risk.
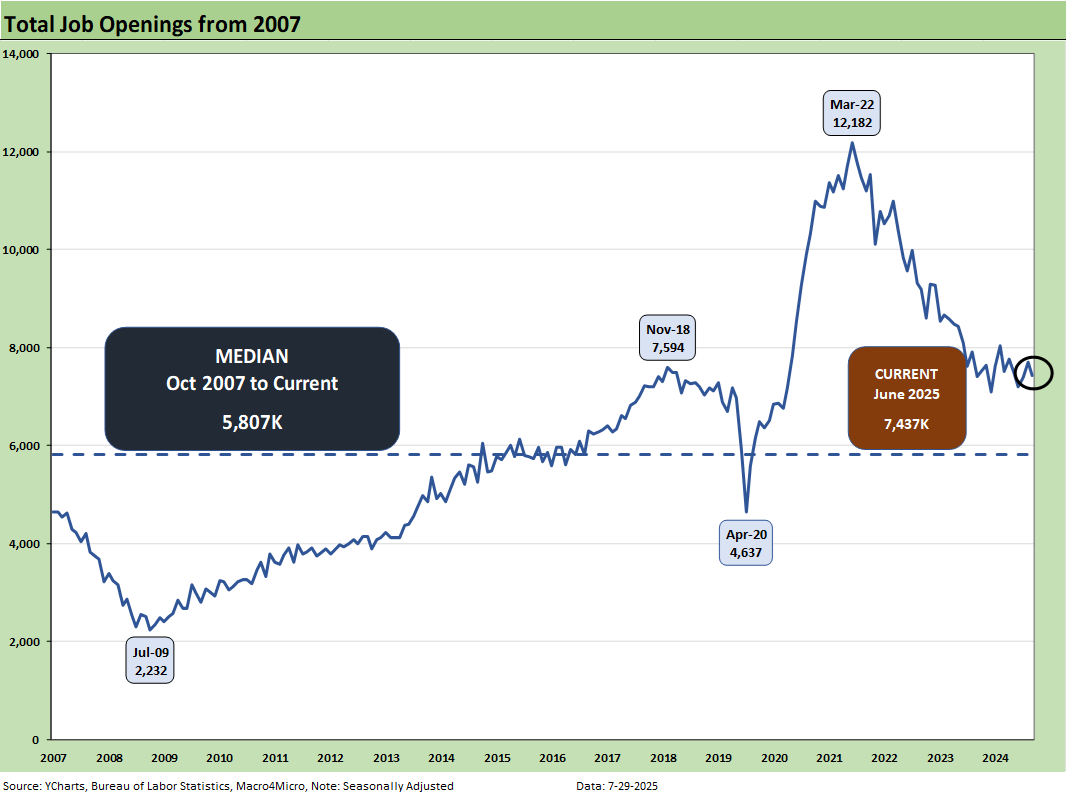
JOLTS is at a 1-month lag, so we still look to this Friday’s payroll release for a more timely read on how the job market has played out. Job Openings for June was down by -3.6% MoM to 7.44 million, which marks a downtick of -275K. That contrasts with May’s increase of +317K. That 7.44 million in openings is essentially flat YoY to 7.41 million in June 2024. The 7.4 mn is lower than the peak number of 7.6 mn during Trump 1.0 in Nov 2018 but well off the 12.2 million peak openings of March 2022 under Biden. Many of those peak openings in 2022 have been filled along the way as we detail in the monthly payroll commentaries.
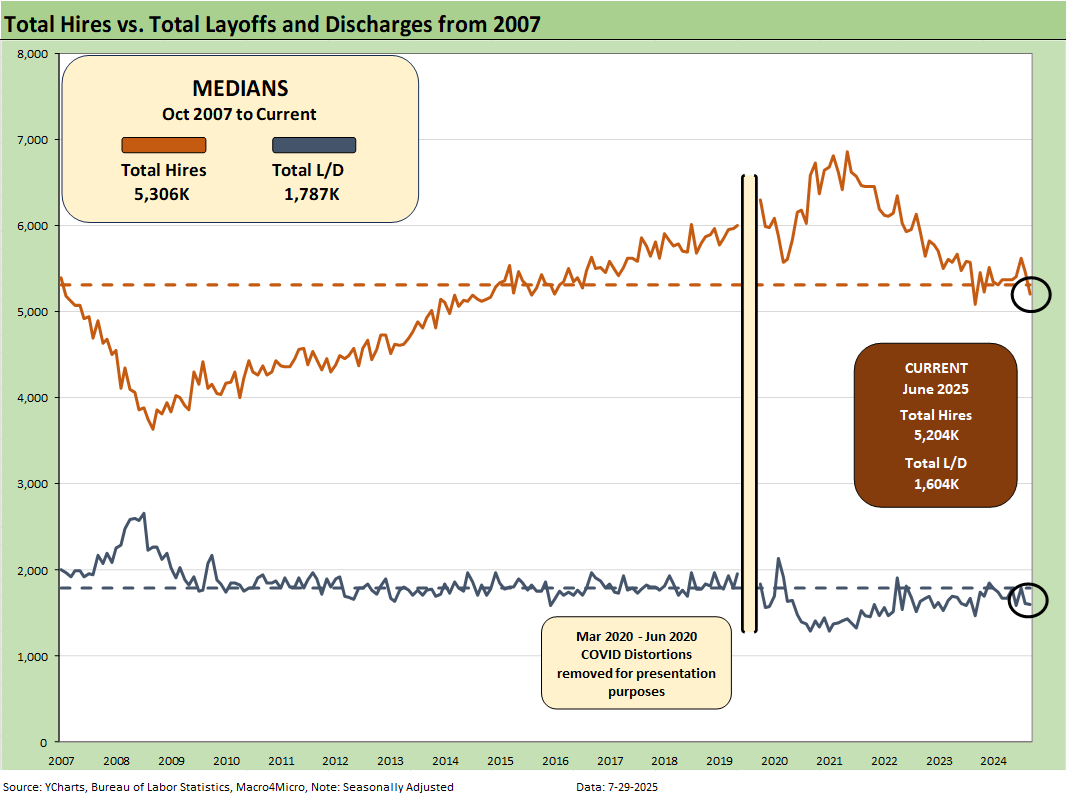
The above chart plots Hires vs. Layoff/Discharges on a SAAR basis. We remove the COVID numbers from this chart to support the visual value for “normal” periods. Those COVID impacts are detailed further below. Hires were down sequentially by -261K and down by -116 YoY. Layoffs/Discharges were essentially flat at -7K MoM but increased by 137K YoY, so that is a mixed result overall for “hires vs. fires.”
With the tariff headlines and mixed consumer spending metrics, a decline in MoM openings and lower hires MoM and rising YoY layoffs/discharges (flat MoM) present a mixed picture on the broader economy but also could trigger more “AI vs. labor” chatter.
Entry level and lower-level job threats seem to be coming up in the commentary more frequently of late, but more than a few are axed to highlight that for AI valuations. That process will take time. Some tariff apologists cite AI productivity and AI as a substitute for labor as a restraint on inflation risk.
The mix of payroll moves is still not a signal to the FOMC to rush out and ease rates until the tariff inflation risks have some supportive data points. Perhaps that takes the 2 more inflation readings ahead of the Sept meeting. By then, presumably China, Canada, and Mexico tariffs will have some clarity. They are 3 of the 4 largest trade partners.
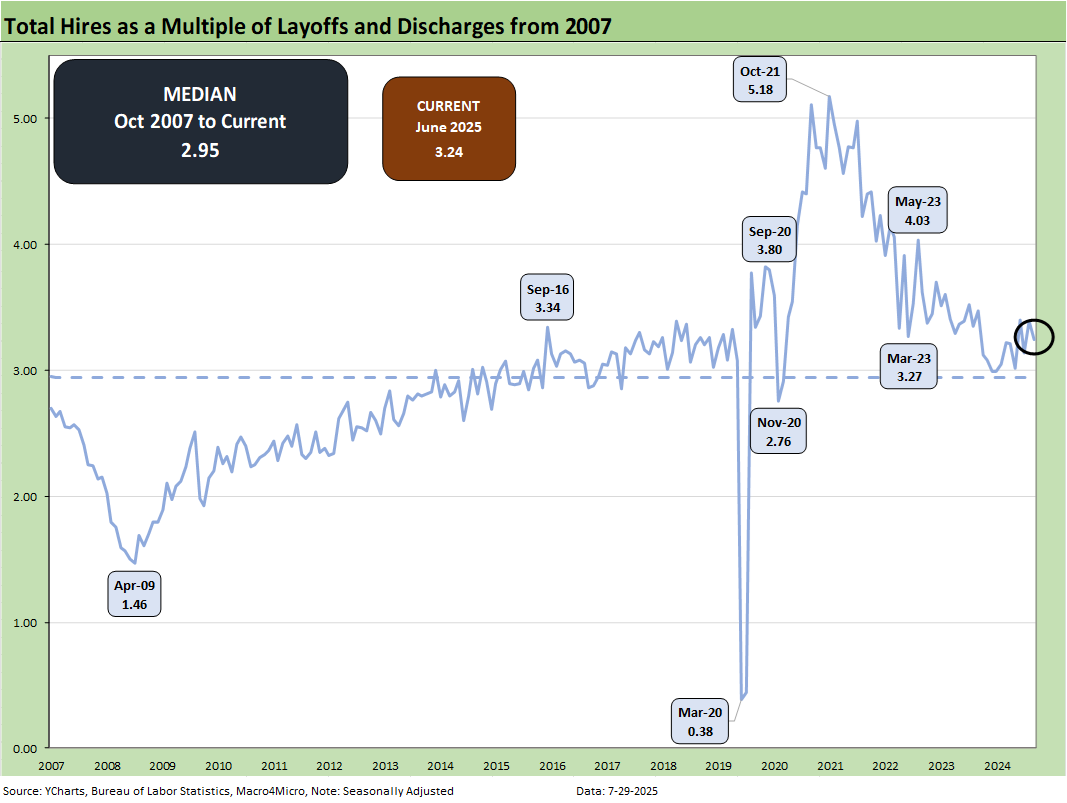
The above chart updates the ratio of Hires to Layoffs/Discharges. The relationship moved lower this month from 3.44 to 3.24 and is above the long-term median of 2.95 presented from 2007. That post-2007 period includes the longest recession since the Great Depression.
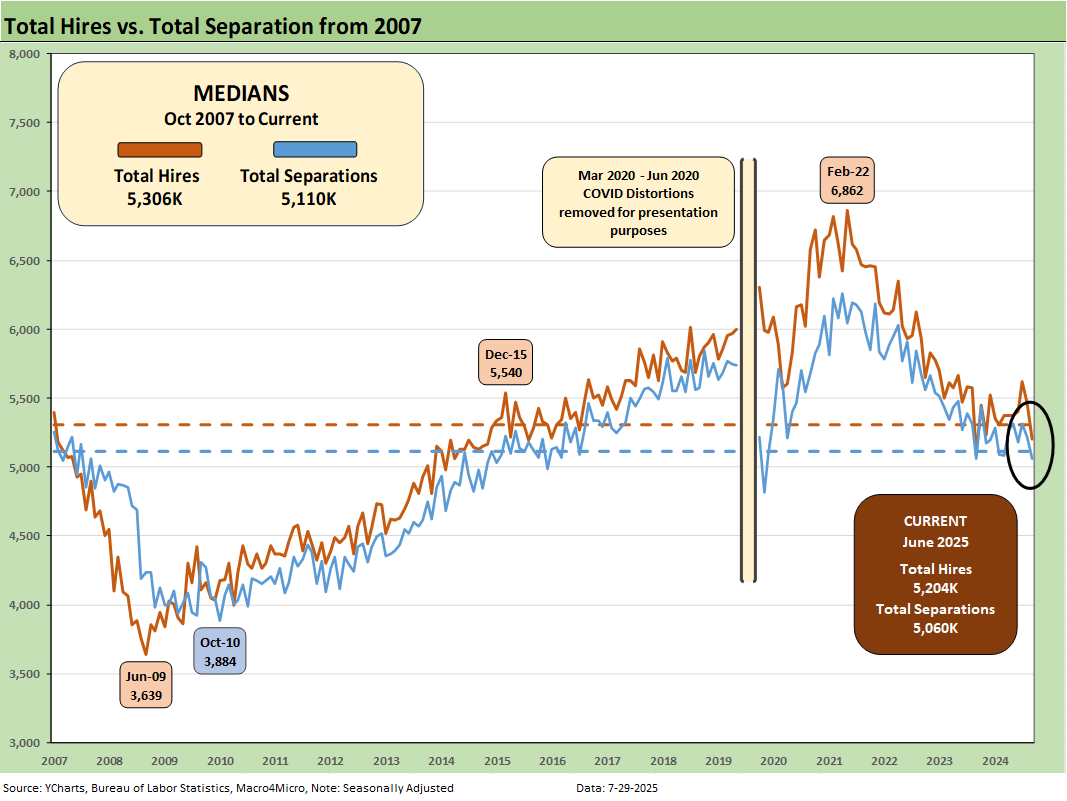
The above chart plots Hires vs. Total Separations on a SAAR basis. Separations include Quits, Layoffs/Discharges, and “Other Separations.” We remove the COVID numbers from this chart to support the visual value for “normal” periods. Those COVID impacts are detailed further below. Separations in total were lower by -153K sequentially. Separations were essentially flat YoY.
We typically do not find “Total Separations” very interesting as a multi-line net number. The most important moving parts are Hires and Layoffs/Discharges. “Other Separations” could get more interesting in a world of mass deportation when people get “disappeared.” Did they “quit” by not showing up for work or did they get “othered?” For June, “Other Separations” are not telling much of a story and moved lower by -18K to 314K MoM.
There is also the uncertainty of how the de facto labor force gets measured and how many are “off the books.” As the year goes on, those questions could be more important. Overall, the ICE numbers have been very low versus the election rhetoric but the visuals of armed masked men with no IDs along with the violent removal process has been a toxic political flashpoint. Beating on the father of 3 Marines and raiding a kid’s birthday party are low points among many low points. It is not exactly “Sons of Liberty” and “Minutemen” hero material. The footage making the rounds indicates a need for some budget allocation to anger management classes and “roid rage” testing. A policeman (without a mask) would get cited and suspended for less.
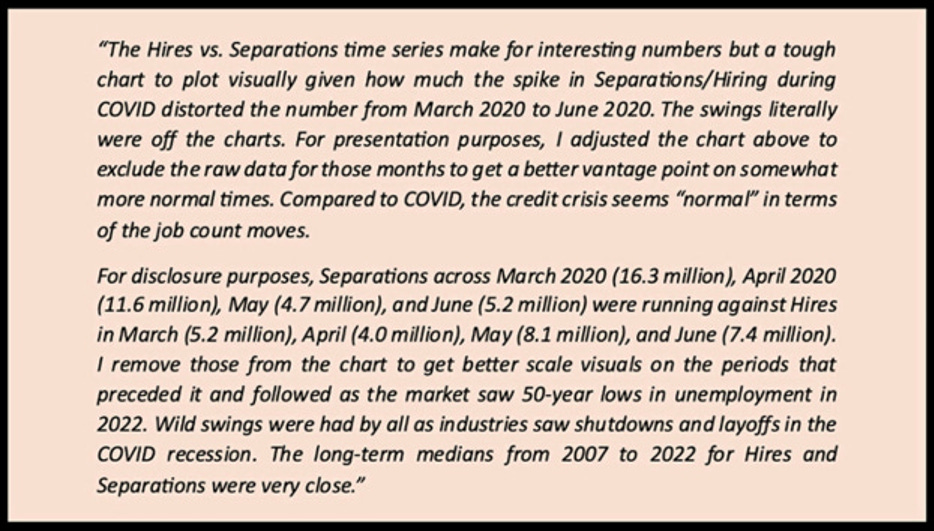
The above text box is our recurring recap of the COVID period. Almost 28 million Separations combined in March-April 2020 was a brutal reminder of that period. That hopefully will be the last time we ever see that. With RFK at the helm, you can never say never.
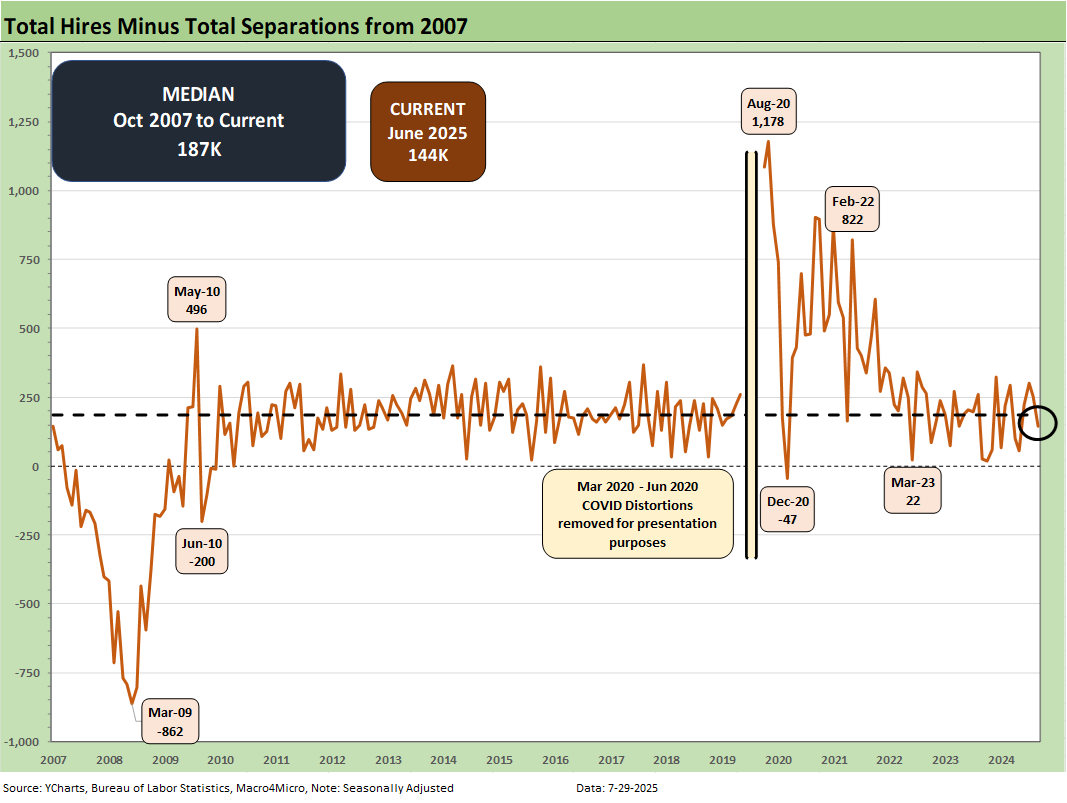
The Hires Minus Total Separations differential is plotted above. Hires moved lower and total Separations moved lower by -153K. The net number above moved notably lower MoM to +144K and is now below the long-term median of +187K.
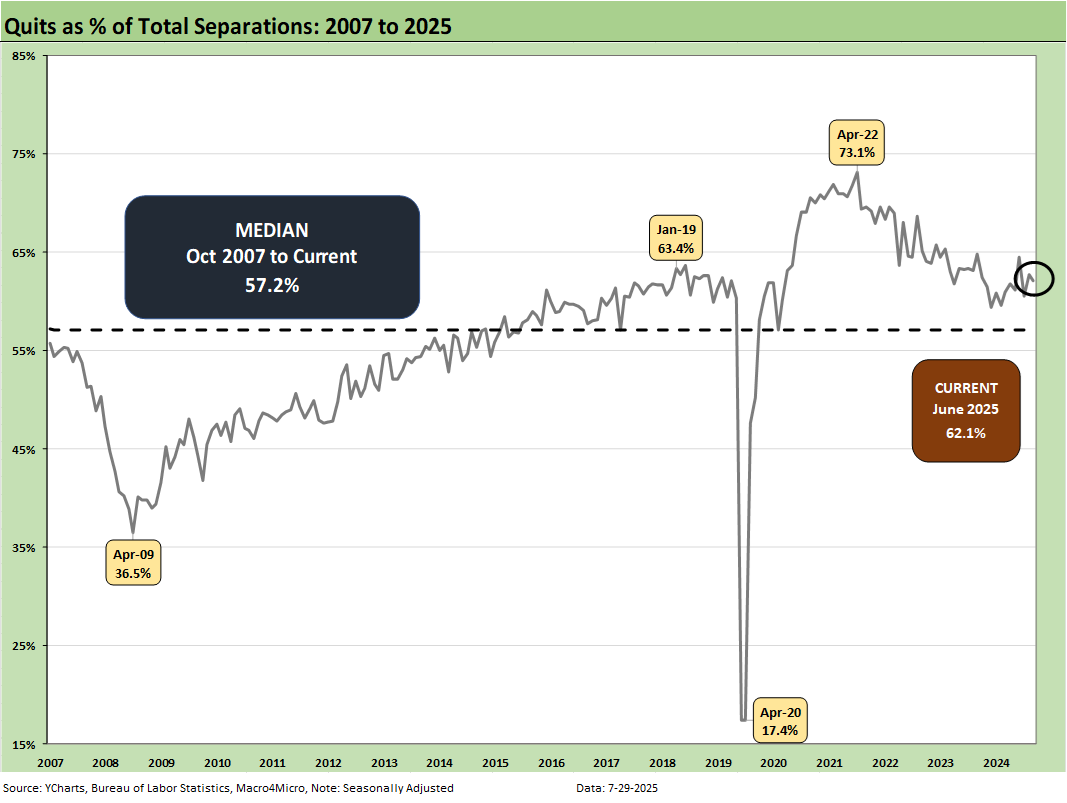
The time series for Total Quits as a % of Separations (SAAR basis) moved lower MoM to 62.1% from 62.8% and is above the long-term median of 57.2%. The classic “Quits Rate” is measured by Total Quits as a % Total Employment, and that metric was flat on the month at 2.0% (revised). The Quits rate is down slightly from 2.1% to 2.0% YoY.
Markets:
Footnotes & Flashbacks: Credit Markets 7-28-2025
Footnotes & Flashbacks: State of Yields 7-27-25
Footnotes & Flashbacks: Asset Returns 7-27-25
Mini Market Lookback: Mixed Week Behind, Big Week Coming 7-26-25
Durable Goods Jun25: Air Pocket N+1 7-25-25
Taylor Morrison 2Q25: Resilient but Feeling the Same Macro Pressure 7-25-25
New Home Sales June 2025: Mixed Bag 7-24-25
Existing Home Sales June 2025: The Math Still Doesn’t Work 7-23-25
PulteGroup 2Q25: Still-Lofty Margins see a Mild Fade 7-23-25
D.R. Horton 3Q25: Material Slowdown Still Good Enough 7-22-25
Housing Starts June 2025: Single Family Slips, Multifamily Bounces 7-18-25
Footnotes & Flashbacks: State of Yields 7-20-25
Footnotes & Flashbacks: Asset Returns 7-20-25
Mini Market Lookback: Macro Muddle, Political Spin 7-19-25
Housing Starts June 2025: Single Family Slips, Multifamily Bounces 7-18-25
Retail Sales Jun25: Staying Afloat 7-17-25
June 2025 Industrial Production: 2Q25 Growth, June Steady 7-16-25
CPI June 2025: Slow Flowthrough but Starting 7-15-25
Footnotes & Flashbacks: Credit Markets 7-14-25
Mini Market Lookback: Tariffs Run Amok, Part Deux 7-12-25
Mini Market Lookback: Bracing for Tariff Impact 7-5-25
Payrolls June 2025: Into the Weeds 7-3-25
Employment June 2025: A State and Local World 7-3-25
Asset Return Quilts for 2H24/1H25 7-1-25
JOLTS May 2025: Job Openings vs. Filling Openings 7-1-25
Midyear Excess Returns: Too little or just not losing? 7-1-25