
Employment Cost Index 2Q25: Labor in Quiet Mode
Employment Cost Index for 2Q25 was flat to 1Q25 and remains constructive for workers when framed vs. inflation.


The index might need a bump, Sir. The tariff on gruel goes into effect at midnight.
The Employment Cost Index for 2025 does not rattle the inflation cage yet with compensation costs for civilian workers at +3.6%, or ahead of inflation (see PCE June 2025: Prices, Income, and Outlays 7-31-25, CPI June 2025: Slow Flowthrough but Starting 7-15-25). That is down from the peaks of 2022 at 5.1%.
Questions will remain around how wage expectations will evolve across industries with tariffs shaping household expectations and a declining low-cost labor pool heading even lower on deportation. Health care costs and benefit packages could get more important after the health care cuts in the recent Big Beautiful Bill.
Employers could face a test soon on worker expectations with tariffs and affordability challenges and potential sticker shock for some tariff-exposed household goods as the working capital cycles and new pricing frameworks play out over the coming months.
Theories around AI-driven substitutes that would reduce manpower needs in total even with higher wage structures (fewer heads) are in the dialogue these days.
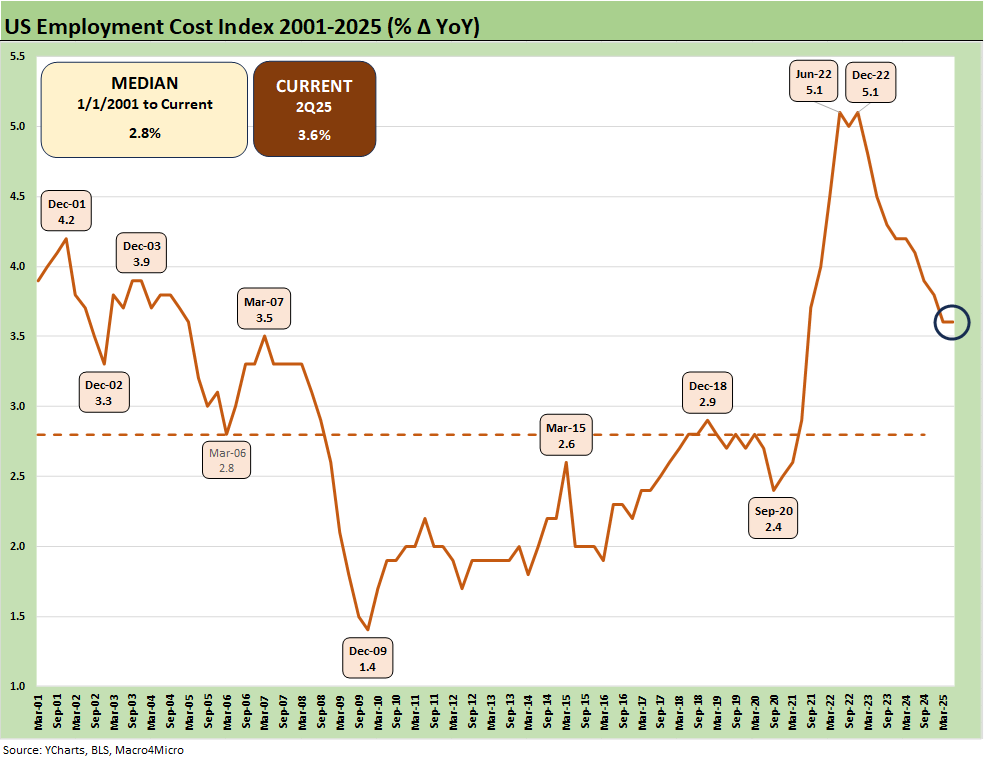
The above chart updates the running ECI history across time from the recent lows of 2.4% in 2020 to some 5.1% handle highs of 2022 and now down to a recent low in 2025 of 3.6%. The 3.6% marked a decrease from 4.1% in June 2024. The 12-month data is not seasonally adjusted.
For the rolling 3-months ended June 2025, the increase was +0.9% for total civilian workers, so there is not much of a trend. Both total compensation and wages for all civilian workers were up +3.6% for 12 months. Private industry workers were at +3.5%, so the signs of labor pricing pressure are lacking even as compensation runs ahead of PCE and CPI. For private industry workers, health benefits alone stood at 5.8%, up from 5.4% in 1Q25 and 3.6% in 2Q24.
The lowest ECI in the timeline from the March 2001 TMT cycle meltdown was hit in Dec 2009 at +1.4% after the payroll ranks had been decimated by the systemic crisis and housing bubble collapse and carnage in financial services. The period of 2001 saw major services dislocations from the TMT bubble popping as well as sustained pressure on manufacturing industries.
The ECI quarterly report offers a broad range of data across many industries and numerous subsector categories. With “All Workers” at 3.6%, the mid 3% at least beats inflation and constitutes “real wage and benefits increases” even if from a starting point of “real low.”
Private sector workers were at 3.5%, State and Local government workers compensation was at 4.0% (down from 4.3% at 1Q25). Unionized workers ECI was at +4.3% (down from +4.6% at 1Q25) with Nonunion at +3.4%.
Within the private Goods-producing sectors, we see 3.5% (up from 3.2% at 1Q25) or flat to the “all private industry workers” number. Services-providing industries show an ECI at the headline level at +3.5% (up from 3.4% at 1Q25). As you scan all the private sector lines, the number of lines above 4% is low (e.g., Aircraft Manufacturing, Hospitals, Finance and Insurance). There are almost no lines over 5% across the mix with the exception of Real Estate, Rental and Leasing).
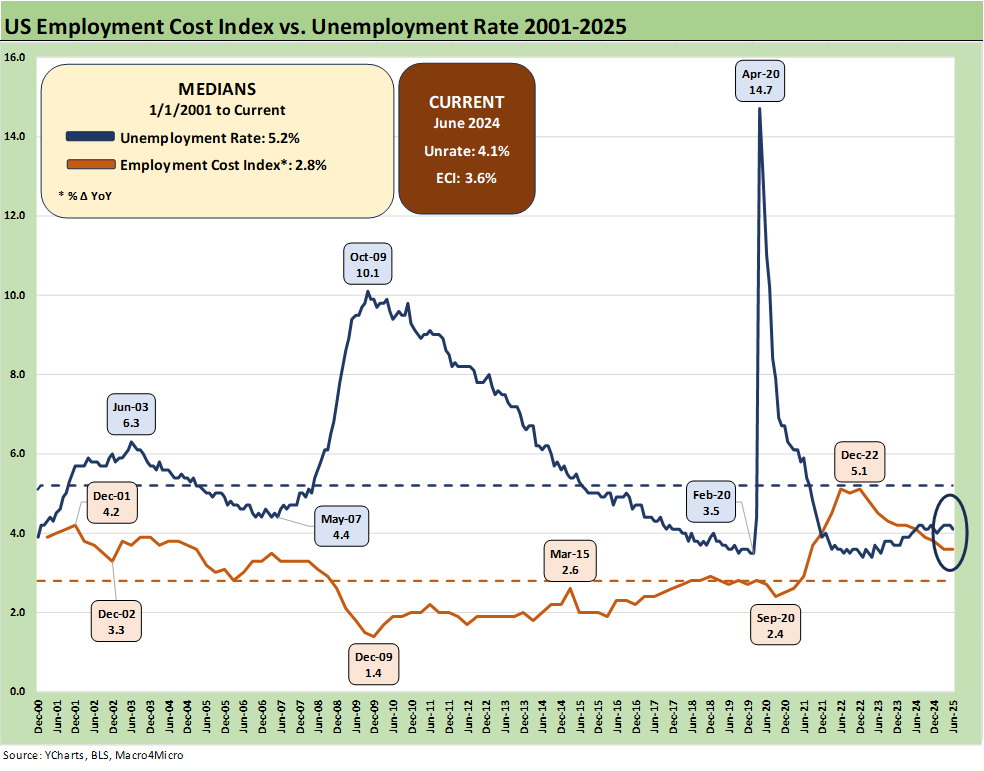
The above chart plots a logical relationship between ECI levels and the unemployment rate. Most remember how ugly the post-crisis period was for payrolls, but some may forget that we did crack double digits at 10.1% in Oct 2009.
That crisis-era unemployment number peaked after the economic cycle was back in expansion mode after the June 2009 trough, which ended the longest recession since the Great Depression (Dec 2007 to June 2009).
We get fresh payroll numbers on Friday.
See also:
PCE June 2025: Prices, Income, and Outlays 7-31-25
2Q25 GDP: Into the Investment Weeds 7-30-25
2Q25 GDP: First Cut of Another Distorted Quarter 7-30-25
JOLTS June 2025: Lower Openings and Hires, Higher Layoffs YoY and Flat MoM 7-29-25
Footnotes & Flashbacks: Credit Markets 7-28-2025
Footnotes & Flashbacks: State of Yields 7-27-25
Footnotes & Flashbacks: Asset Returns 7-27-25
Mini Market Lookback: Mixed Week Behind, Big Week Coming 7-26-25
CPI June 2025: Slow Flowthrough but Starting 7-15-25
Past ECI commentaries:
Employment Cost Index 1Q25: Labor is Not the Main Worry 5-1-25
Employment Cost Index 4Q24: Labor Crossroad Dead Ahead 1-31-25
Employment Cost Index Sept 2024: Positive Trend 10-31-24
The Employment Cost Index June 2024 8-1-24
Employment Cost Index March 2024: Sticky is as Sticky Does 4-30-24
Employment Cost Index Dec 2023: Compensation Mixed Picture 1-31-24
Employment Cost Index Sept 2023: Expect the Expected 10-31-23
Employment Cost Index: Rings of the Redwood 7-28-23
Employment Cost Index: Slow Motion 4-28-23
Employment Cost Index: Labor vs. Capital …Tide Turning or Swirling? 2-1-23