
Industrial Production July 2025: Capacity Utilization
A flat month for manufacturing with weakness in mining and utilities is flashing yellow but at least not red.


Industrial production and capacity utilization were relatively stable and remain within a narrow band in 2025.
The downticks in capacity utilization do not signal trouble but do not show signs of improvement out of the holding patterns for numerous categories.
Among major durables, Aerospace was a source of strength with slight weakness in Motor Vehicles, Machinery, and Computers/Electronics.
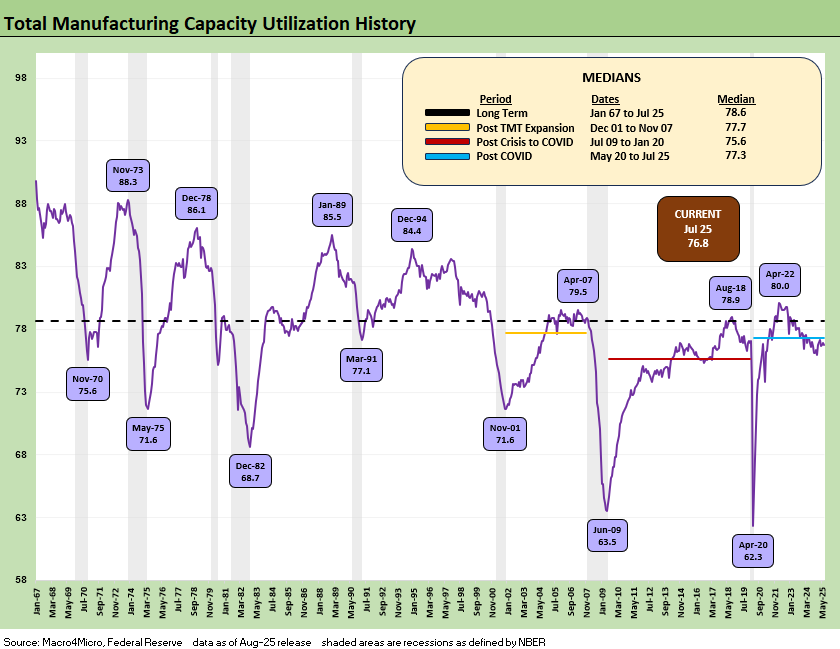
The above chart updates the time series for total manufacturing capacity utilization. We see total manufacturing tick slightly lower sequentially from 76.9% to 76.8%. That level is flat to the 2Q25 average but still below the long-term average of 78.2%. The 76.8% rate is slightly above the 1Q25 run rate (76.6%) and above the 4Q24 numbers (76.2%). The peak utilization after COVID was seen in April 2022 at 80.0% ahead of the tightening cycle impact.
The takeaway from the vantage point of “trend” during 2025 is that capacity utilization has hung in well into the start of the 3Q25 period. A manufacturing fade is not evident yet in these numbers. As we cover below, the Durables line has held in with July above the 2Q25 and 1Q25 average.
As we discuss in the multicycle chart further below, important questions from here tie into margin impacts from tariffs and how breakeven volume levels in the manufacturing sector could suffer. As the quarterly earnings tick off in the new age of tariffs, there will be a lot of focus on changes in corporate cost structures vs. volume and pricing. One focus will be on how margins will stand up in the face of rising supplier chain costs once the buyer/importer “writes the check” for the tariff.
There are a lot of theories but one fact. That is, the buyer “writes the check.” Even Bessent finally admitted it after much prodding in a live interview. Trump still will not admit that fact, and media types are afraid to ask him (they fear they will get disinvited from the desk-side chats).
The negative unit cost impact runs from raw materials (steel, aluminum, copper, lumber) and components to higher labor costs. Section 232 tariffs are still rolling out with pharma and semis slated to be especially draconian. Trump was talking about 300% on semis as recently as last night and 200% was loosely thrown around on pharma in recent periods.
At the very least, the need to pay high tariff costs up front to customs will create a challenge for unit costs and the ability to generate solid margins at lower utilization. That means less profit and decisions on pricing actions (higher?), strategies on product mix shifts, or more cost mitigation steps (layoffs?).
Execution risk also rises with tariffs phasing in slowly and steadily into working capital after the latest Aug 1 date with more Section 232 tariffs coming. The difference across the variable cost of sales via inventory vs. the impact on capex and fixed costs (machinery plant & equipment, construction, etc.) makes for tricky breakeven math with so many moving targets.
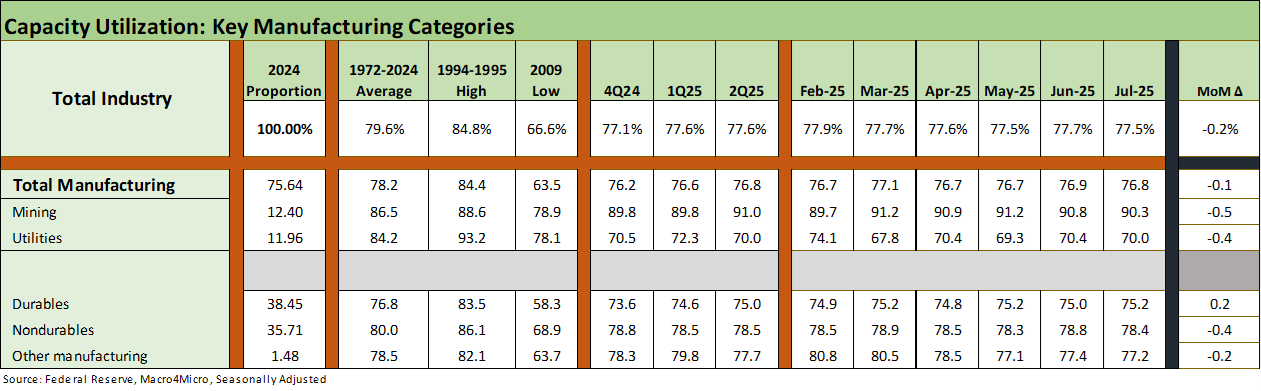
The above table breaks out the high-level buckets with the deltas in the right column. We see a slight downtick across for almost all of the lines from June, but Manufacturing remains in a tight band across 2025 at the rolled-up level. Durables ticked slightly higher, which is a good signal, while Mining and Utilities weakened.
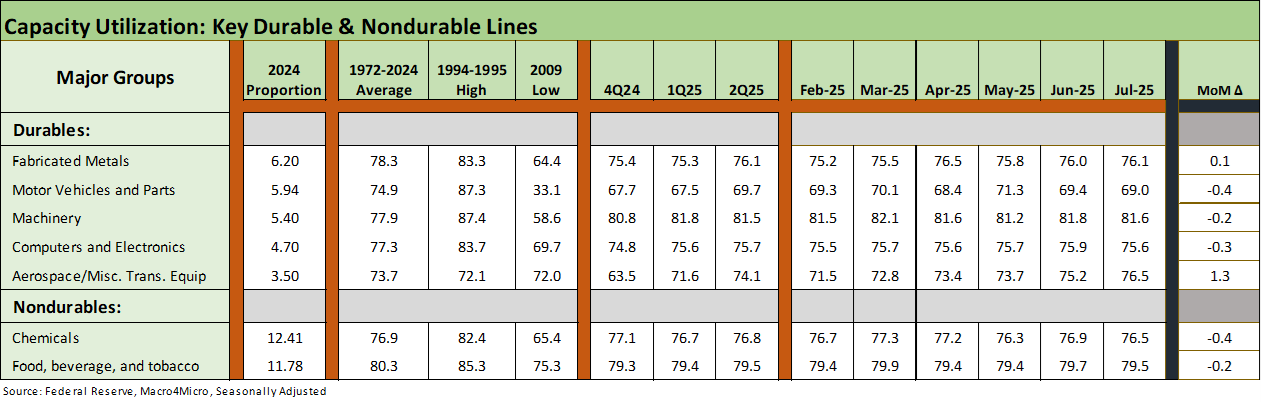
The above table details the top 5 durable and top 2 nondurable industry groups with 2 up and 3 down in durables and both down in nondurables. The deltas are in the column on the right. Aerospace had a strong showing, but we see slight weakness in Motor Vehicles, Machinery and Computers/Electronics.
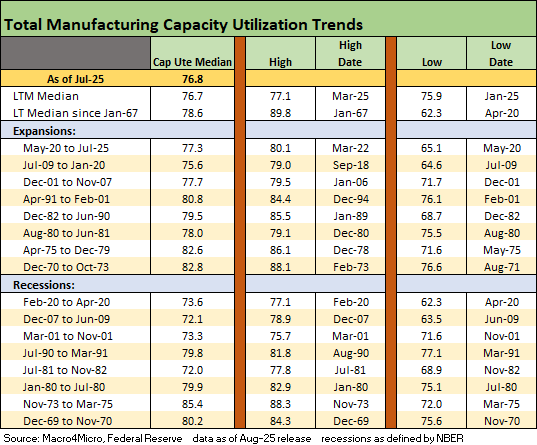
The above table updates the capacity utilization history for expansions and recessions. As noted earlier, the ability of more companies to generate solid profits at lower capacity utilization in today’s markets is tied in part to automation and in part to the development of low-cost supplier chains. Low-cost supplier chains are now fatally threatened by tariffs.
The current utilization level of 76.8% is below the long-term median from 1967 of 78.6%. That is below half the recession averages from earlier recession periods as noted in the chart. The pressure will be high on manufacturers as we move into 4Q25 and then into 2026.
Those low-cost supply chains were risk-mitigating structural advantages of global sourcing that are going to eventually unravel under Trump tariffs. The new tariff policies are based on a highly speculative concept of how tariffs will translate into mass investment in the US to reshore and expand as producers and suppliers scrap their offshore asset base.
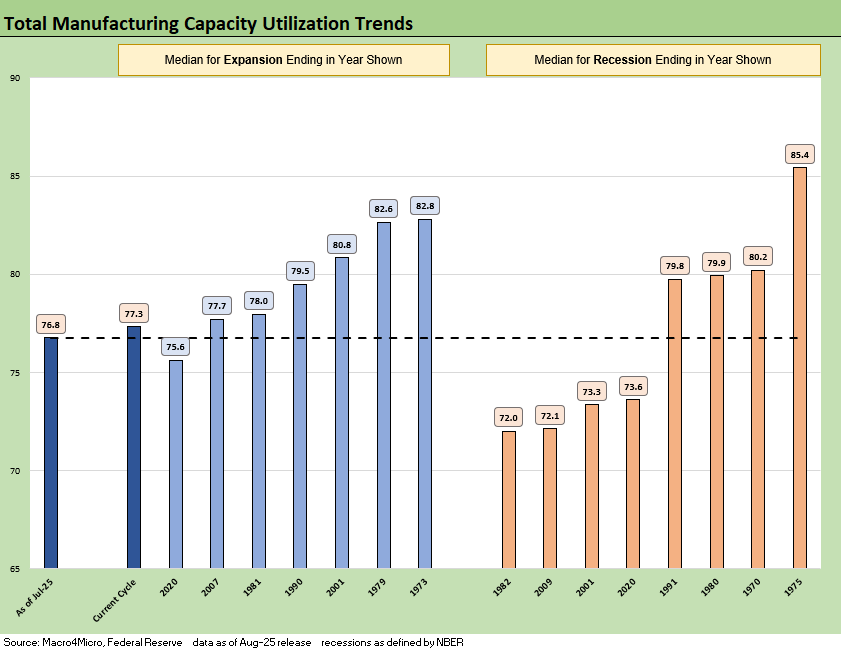
The above chart details expansion and recession averages and lines them up by height as a frame of reference. We see the current level on the left. What has been striking after the credit crisis and protracted recession that followed was that US manufacturing could be so profitable at capacity utilization rates that were below numerous prior recessions.
Low-cost global sourcing was the rage in some industries (notably autos) in the US as well as in Europe. That process had been ongoing for years (component and finished goods assembly in tech from laptops to semis and integrated tech systems in the pan-Asia chain). That “lower breakeven” plan is now “toast” with the tariffs. The oft-stated theory is that supplier chains will rapidly return to the US or come to the US for the first time.
The theories on reshoring or onshoring combine a level of optimism with a disdain for the concept of “time lags” and willingness of companies to make substantial multiyear capital outlays when the tariffs could be one election away from material revisions. The problem with emergency declarations to bring so many tariffs is that the “next guy” can simply say – in whole or in part – that “the emergency is over.” Legislation would be a bigger barrier, but these tariffs are all about one decision-maker.
See also:
Producer Price Index: A Snapshot of the Moving Parts 8-14-25
CPI July 2025: Slow Erosion of Purchasing Power 8-12-25
Iron Mountain Update: Records ‘R’ Us 8-11-25
Footnotes & Flashbacks: Credit Markets 8-11-25
Footnotes & Flashbacks: State of Yields 8-10-25
Footnotes & Flashbacks: Asset Returns 8-10-25
Mini Market Lookback: Ghosts of Economics Past 8-9-25
Macro Menu: There is More Than “Recession” to Consider 8-5-25
Mini Market Lookback: Welcome To the New World of Data 8-2-25
Happiness is Doing Your Own Report Card 8-1-25
Payrolls July 2025: Into the Occupation Weeds 8-1-25
Employment July 2025: Negative Revisions Make a Statement 8-1-25
Employment Cost Index 2Q25: Labor in Quiet Mode 7-31-25
PCE June 2025: Prices, Income, and Outlays 7-31-25
2Q25 GDP: Into the Investment Weeds 7-30-25
2Q25 GDP: First Cut of Another Distorted Quarter 7-30-25
United Rentals: Cyclical Bellwether Votes for a Steady Cycle 7-29-25
JOLTS June 2025: Lower Openings and Hires, Higher Layoffs YoY and Flat MoM 7-29
25
Mini Market Lookback: Mixed Week Behind, Big Week Coming 7-26-25
Durable Goods Jun25: Air Pocket N+1 7-25-25
Taylor Morrison 2Q25: Resilient but Feeling the Same Macro Pressure 7-25-25
New Home Sales June 2025: Mixed Bag 7-24-25
Existing Home Sales June 2025: The Math Still Doesn’t Work 7-23-25
PulteGroup 2Q25: Still-Lofty Margins see a Mild Fade 7-23-25
D.R. Horton 3Q25: Material Slowdown Still Good Enough 7-22-25
Mini Market Lookback: Macro Muddle, Political Spin 7-19-25
Housing Starts June 2025: Single Family Slips, Multifamily Bounces 7-18-25