
Footnotes & Flashback: Credit Markets 10-14-24
The CPI kept the FOMC themes murky, equities kept rolling, and a minor credit widening still saw HY index below the +300 bps line.


Is that the old movie or a pollical statement?
The UST market saw more setbacks for duration the past week and another bear steepening after a muted CPI number getting categorized as “hotter than expected” even if it was more lukewarm in substance with energy deflating (for now) and holding its breath ahead of expected Israeli retaliation against Iran (see CPI Sept 2024: Warm Blooded, Not Hot 10-10-24).
The suspension of policy disbelief saw a Trump “economic adviser” (small hedge fund manager from South Carolina) making the statement in an FT interview this week that, “Trump won’t weaken the dollar” and “tariffs are just a negotiating position.” Trading off the idea of Trump not doing exactly what he said he will do on those policies is an acquired taste and ignores the history of 2018-2019 and the rainmakers in his cabinet that could not deter him. The countdown to the next round of election chaos is now measured in days. Oddly, the market remains unfazed.
With a few headlines around the two-year anniversary of the bull market in stocks, the week saw another round of record highs on the S&P 500 even if credit markets are not getting much help from the UST curve in supporting the solid excess returns from spread contraction (see Footnotes & Flashbacks: State of Yields 10-13-24, Footnotes & Flashbacks: Asset Returns 10-12-24).
Credit spreads take a lot of cues from equities, good earnings, decent balance sheet trends, and the fact that the most aggressively leveraged deals are outside HY bonds and over in the more controlled and opaque world of private credit (see HY OAS Lows Memory Lane: 2024, 2007, and 1997 10-8-24).
We picked the image at the top of this piece from an early 1970s film, “Last House on the Left.” The “it’s only a movie” promotion campaign resembles the 2024 election year theme: sometimes you ask, “Is it real?”
The Director was Wes Craven, and the word “Craven” and horror seemed to apply every time you turn on the Washington news. The movie was released in 1972 just before Nixon won 49 states and troops were still at war in Vietnam. And yes, I saw the movie when it came out.
Of course, the “Last House on the Left” phrase continues the debate around what some right wing extremists and theocrats would like to see with a de facto political purge of all progressive left elements that would preclude any from returning to the White House (ever) without contesting the election or voting it down in the House and Senate. These horror movies always get “remakes” (as did Last House on the Left in 2009). We could see a Jan 6 remake also. Soon.

Back to 2024…
Earnings season is kicking into high gear this week with the rest of the major banks. The market will now face a wave of regional banks and consumer lender results to digest.
We expect the market will be more likely reassured on one of the cornerstones of a good credit market – namely, the banks and lenders not seeing troubling trends in their target markets. Regionals are a one-off (or two-off) wildcard on commercial real estate, but the trend line on credit card asset quality will have a hard time surprising the market.
JPM and WFC got the ball rolling Friday with good news, and the next stage of the deluge is here this week before the long tail of other industries pick up pace through the end of the month and into early Nov.
As noted in the chart above, credit asset returns have been supported by fundamental strength (excess returns) even if the 2024 duration support has been less common than duration setbacks after the monster “rally of everything” in Nov-Dec 2023 (see Footnotes & Flashbacks: Asset Returns 1-1-24 , Footnotes & Flashbacks: State of Yields 1-1-24). The Nov 2023 part of the rally included an especially strong performance by the Russell 2000 that has a lot of overlap with the US HY markets (see Footnotes & Flashbacks: Asset Returns 12-3-23). Small caps have been more sustained in their performance the last few months, and that is a favorable indicator for the HY overlap (see Footnotes & Flashbacks: Asset Returns 10-12-24).
History shows the HY pricing backdrop has a high level of correlation with the equity markets, so the pricing of risk will be tenuous as the bigger macro events unfold in post-election policy plans. More immediately, that is also tied to Middle East developments that could change radically at any time. The deployment of missile defense and US personnel to Israel is not without precedent (the US did that for the Saudis also), and any overt, excessive aggression by Iran could change the inflation debate and political handicapping overnight.
The bull market in stocks has been holding…
As we look back at the two-year bull market off the Oct 12, 2022 lows in the S&P 500, the broad market index is up around 62%. That 2022 low was a time when so many were screaming “the recession is here!” We did not see it that way (see Unemployment, Recessions, and the Potter Stewart Rule10-7-22). There was no question that the situation was tenuous at the time with real fed funds still negative (meaning more tightening to come) and worries around how the rate backdrop could shift (see Expansion Checklist: Recoveries Lined Up by Height 10-10-22).
It was hard to rule out a recession arriving if the consumer sector faded, but the numbers clearly were not there yet in the fall of 2022 and notably in the consumer sector and employment. The peak inflation was behind the market at that point, and the fundamentals held in well enough to the disappointment of half of Congress.
The bond side has been a rougher ride in 2024 after a strong move shortly after the S&P 500 low. In contrast with the 62% from the S&P 500 since the low, the IG Corporate Index ETF (LQD) was at +19% cumulative for the two years since the start of the bull market. The HY ETF (HYG) is at +25.4% since then. Credit spreads have been the friend of returns, but the long duration 20+ Year UST ETF (TLT) posted a minimal +0.7% return since that date.
Fundamentals firm in 2024…
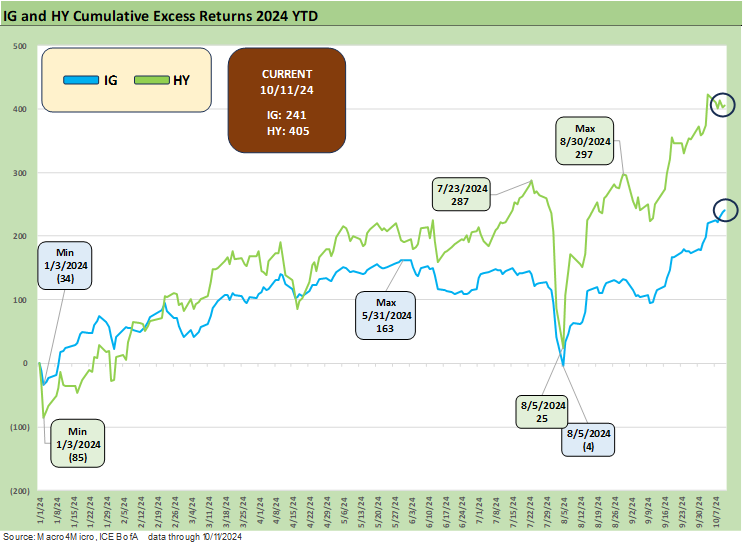
The excess returns for the year are detailed above for IG and HY, and credit spreads have been favorable for the year with the IG index -20 bps YTD and HY -41 bps YTD even after the big rally of Nov-Dec 2023.

The BB vs. BBB tier relationship is an important one we detail further below in the spread section, and the above chart plots the relative running excess returns for the two tiers. We have seen bouts of excess return compression between BBB and BB tiers this cycle, but the above shows the BBB YTD excess return trumping BB YTD. We see the longer duration BBB tier -23 bps tighter YTD and BBs -21 bps tighter.
With the recent rally in credit and still a level of optimism on UST rates held by many investors, the idea of holding tighter to long duration BBB credits is not surprising with the cycle steady and credit quality sound. Duration extension in medium grade credits (BBB) is still a prudent diversification strategy for those who like credit risk but do not want to take on too much lower tier risk with an economic expansion and credit cycle that can turn very quickly in 2025 if some of the bear policy scenarios play out in inflation effects that flow into demand (e.g., tariffs and mass deportation).

The CCC tier has been on a roll this year. The constituent distortions are something we often address in a tier that does not lend itself to much generalization as a “name picking” tier by definition (see The B vs. CCC Battle: Tough Neighborhood, Rough Players 7-7-24). The CCC tier numbers continue to run up the score in excess returns.
A look at spreads…
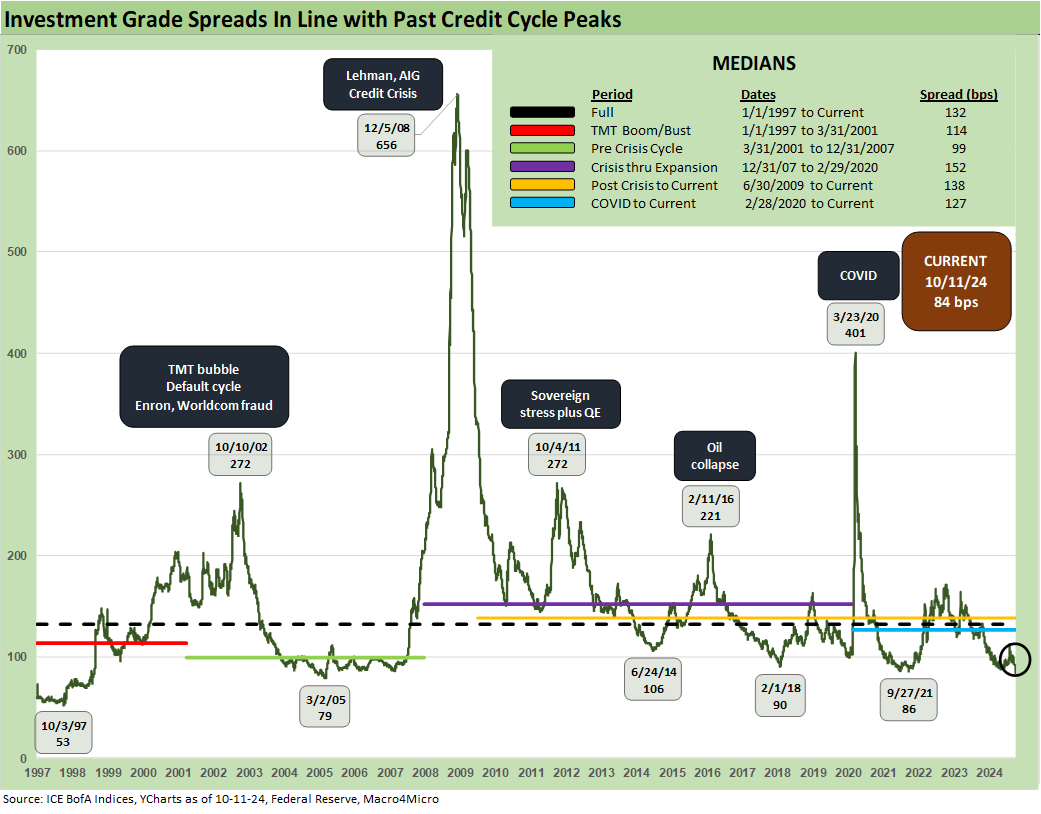
IG OAS ticked lower last week and are now down to +84 bps. Such levels are lower than the 2021 lows of +86 bps. They are the lowest since the +79 bps of 2005. As we have covered in past commentaries, the protracted periods in the low to mid 90s for IG OAS are not unusual. We saw that in 1997-1998 and in 2006 with a stretch of mid 80s. From 1H04 through 1H07, IG OAS averaged in double digits at around +93 bps. The low average in 1H07 of +86 bps was like the lows in 2H06 at +90 bps and 1H06 at +87. The +84 close this past week are now in rare territory but with many months that were not far off.

HY spreads widened by +9 bps over the past week but are still inside the +300 bps line. We looked at the 1997 and 2007 histories in a separate commentary last week (see HY OAS Lows Memory Lane: 2024, 2007, and 1997 10-8-24). In that note, we highlighted the material difference in the UST backdrop and relative systemic risk and market health. The current market has a laundry list of differences as well.
The OAS levels do have a lot in common, and that is where the compare and contrast exercises begin. Industry mix, ratings weightings, issuer outliers in the low B and CCC tier, and correlations across issuers (e.g., upstream oil and gas, TMT) all come into play. We have done those comparisons more than a few times (see HY Spreads: Celebrating Tumultuous Times at a Credit Peak 6-13-24, Credit Markets Across the Decades 4-8-24, Credit Cycles: Historical Lightning Round 4-8-24, Wild Transition Year: The Chaos of 2007 11-1-22, UST Curve History: Credit Cycle Peaks 10-12-22).
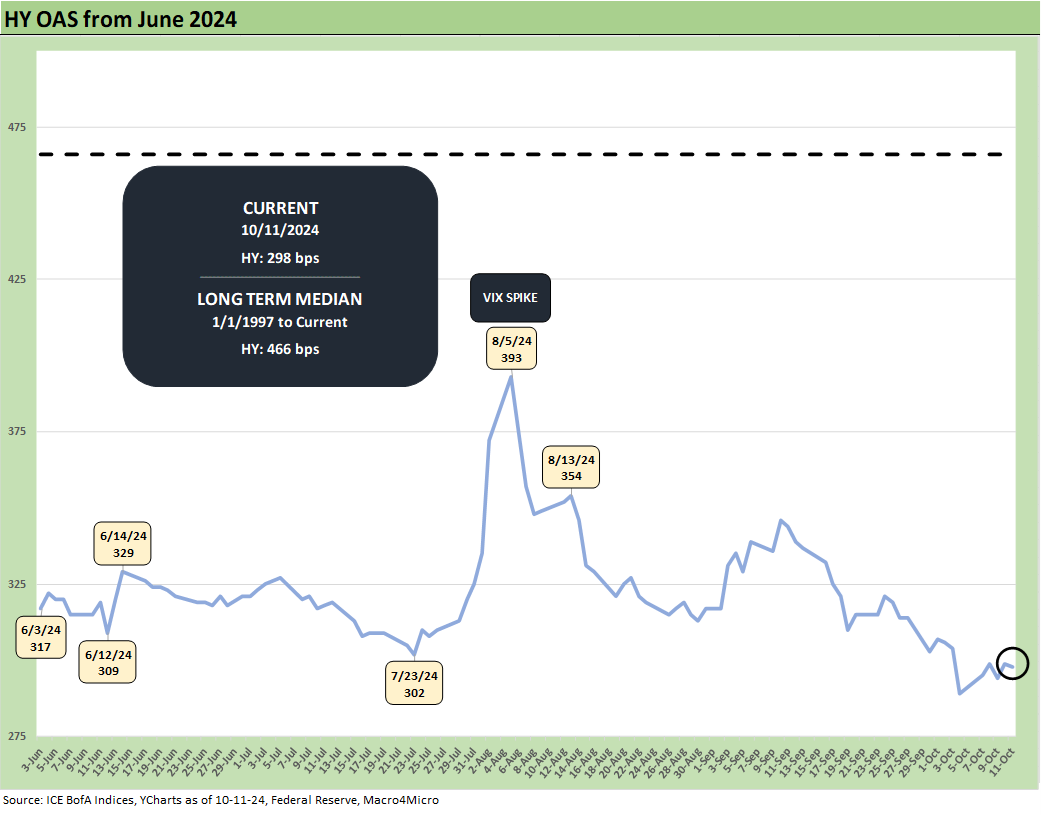
The above chart shortens up the timeline to capture the recent moves including the early Aug VIX spike. The long-term median line at the top of the chart tells a stark story of how compressed the market is today.

The above chart updates the quality spread differential for IG vs. HY. The +214 bps to end last week is above some of the recent lows but inside June 2014. The long-term median of +328 bps is a long way off.

The above chart shortens the differential timelines to start in June 2024. The post-VIX spike and credit spread widening in early Aug took the differential back to +281 bps in a reminder that the IG OAS levels are more resilient in the face of severe equity volatility than HY OAS. In such markets, quality spreads widen from the bottom up.
For IG, there would in theory also be some duration benefits in total return to mitigate the damage from an event-driven spread wave. That is, unless for some reason we get into a stagflation backdrop on excess tariffs, export declines, diminished consumer confidence, scaled back PCE, unemployment setbacks, more dramatically rising consumer defaults, and labor inflation turmoil tied to mass deportations.
Those outcomes have visible transmission mechanisms in a trade war backdrop and Mideast escalation along with the worst of policy ideas we routinely discuss.

The BB tier OAS has rallied to well inside the +200 bps line to +184 bps, which is inside the Jan 2020 lows but above the mid-2007 lows of +171 bps. The 1997 lows of +136 bps is in a very different world in a period that was a few months before the all-time IG lows of +53 bps.

The “BB OAS minus BBB OAS” quality spread differential at +78 bps is around where the tightening cycle started back in March 2022 at +74 bps but comfortably above the July 2024 lows of +55 bps and Dec 2019 levels of +57 bps.

The above chart shortens up the timeline for a more granular view of the recent BB vs. BBB quality spreads. The benefits of the BBB spread compression this year in the longer duration BBB layer of the credit tiers shows up in the solid excess return numbers for BBB vs. BB addressed earlier.

The B tier dropping below the +300 bps line has been one of the big stories of the HY bond market since the B tier has been the ancestral sweet spot of HY investing across the cycles.
Looking at the B tier alone in a B tier weighted HY index removes some of the effects of the overall HY index mix with such a high BB tier mix but well inside Jan 2021, Jan 2020, Oct 2018, and June 2014. The B tier is still well above the lows of June 2007 at +236 bps when the quality mix of the B tier was arguably a “worse B mix” than what we see today vs. the more LBO leveraged bonds of 2007.
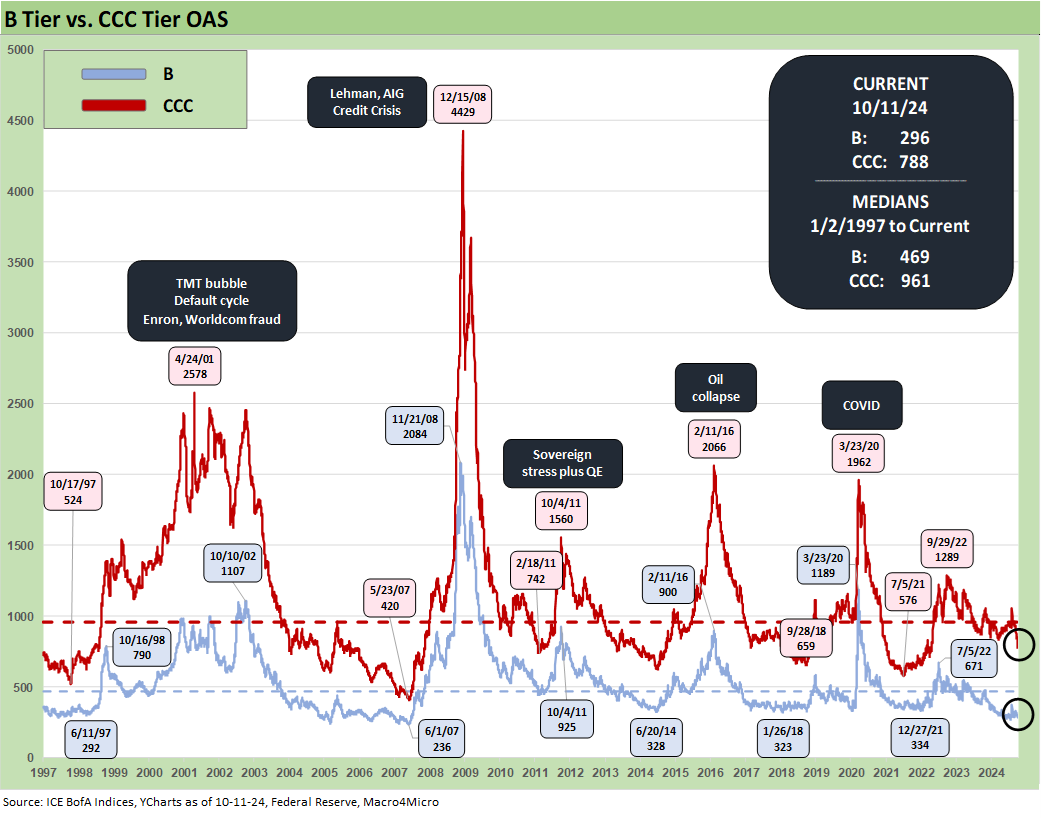
The above chart updates the multicycle pattern of the B vs. CCC tier points that highlight the occasional sharp divergences across the credit cycle and shifting risk pricing that comes ahead of the lagging default cycles.
We see the credit crisis distortions in 2008, the sovereign stress period and renewed bank system fears in Oct 2011, the oil crash and relatively uniform energy sector panic and redemption anxiety of early 2016, and the last whipsaw of the March 2020 COVID panic. That was before ZIRP and prudent Fed actions broadly in a range of programs (and jawboning effort to build market confidence) drove a monster refi-and-extension wave for fortunate corporate treasurers locking in low coupons.
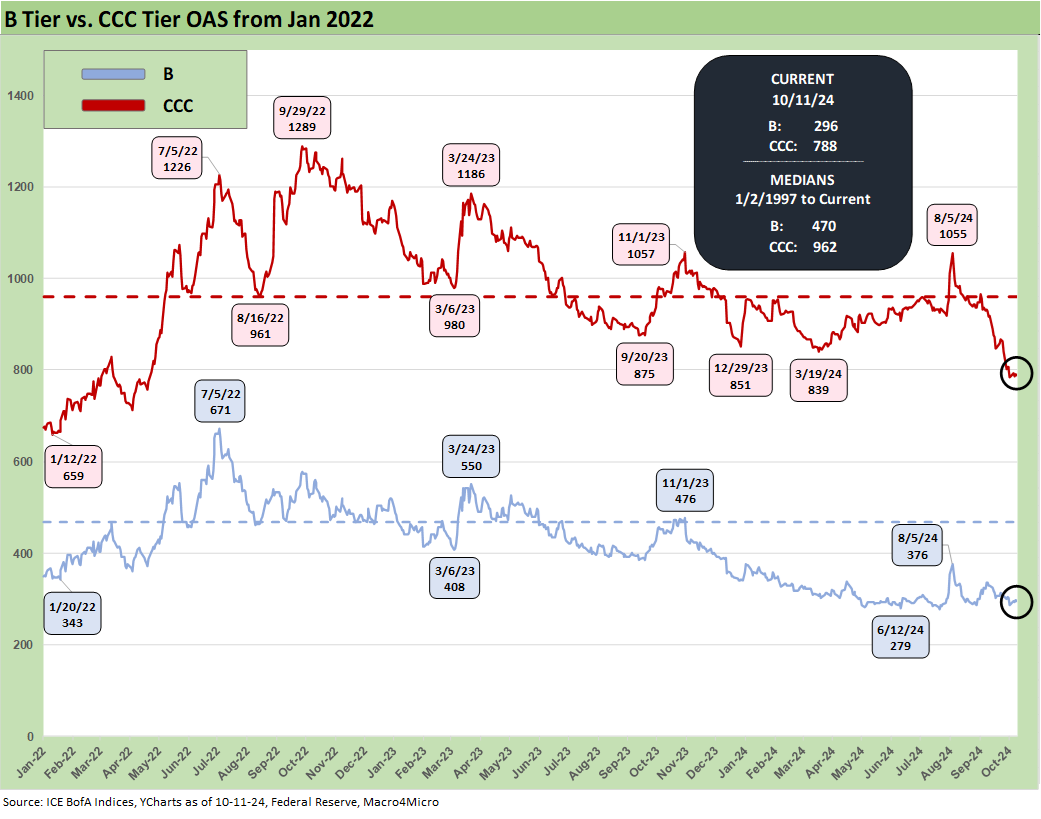
The above chart does the same timeline shortening exercise from Jan 2022 just ahead of the tightening cycle and shows the wide swings in the B vs. CCC tiers. The second half of 2022 had markets on edge and the effects of the oil spike and Fed tightening were getting framed by the risky asset markets. Then inflation moderated, hiring continued at a healthy pace, and consumers kept on doing what they usually do (spending more than they should). The rally was on in 2023 and picked up tempo later in 4Q23.

The above chart frames the CCC OAS minus B OAS differentials across the cycles. The current +492 bps is materially wide to the low differential seen in pact credit cycle peaks, so that is reassuring. As we have covered in past commentaries, the CCC tier is dominated by major issuer and industry concentration stories over time (see The B vs. CCC Battle: Tough Neighborhood, Rough Players 7-7-24).
What has been favorable in this cycle is that the more extreme, aggressive, highly leveraged deals seen in past cycles have migrated over to “private credit land” and outside the HY bond index mix. We also have seen less debt-funded growth stories of the sort that made the shale boom and TMT issuers such a problem when credit contraction and redemption risks flared up.
The record LBOs of the 2007 peak in credit did not get a chance to “blow up on their own” as the bank system crisis and structured credit excess accelerated the process. The absence of such themes in the current cycle has been a blessing for the relative exposure to dramatic spread gaps from the bottom up.

The above chart offers a short-term timeline for the more recent moves. There is always a number of constituent migration stories such as drop-ins (downgrades), drop-outs (default) and distressed exchanges that shift the mix around across various timelines.
A look at yields…

The above chart updates the timeline for IG yields and HY index yields. With the ZIRP and normalization years behind us (we hope) and now phasing slowly towards the end of a tightening cycle, the pre-crisis cycle medians in the chart above are the most relevant since they isolate the FOMC policy asterisks.
Very low UST levels today in non-ZIRP timeline context and very tight spreads in any context underscore the compressed yield backdrop of 4.96% for IG and 7.19% for HY. That contrasts with the pre-crisis median of 6.1% for IG and 9.3% for HY. The post-credit crisis levels of 3.3% for IG and 6.4% for HY were very much tied to crisis management and the stimulus policies of the Fed.

The above chart updates our comparison of the current IG index yields vs. the June 2007 and late 1997 credit cycle peaks of bygone years. Those are the horizontal lines. We also include a UST for each of the same dates. The shape (front end inversion) and level of the current UST curve stand out in stark contrast to 2007 and 1997.
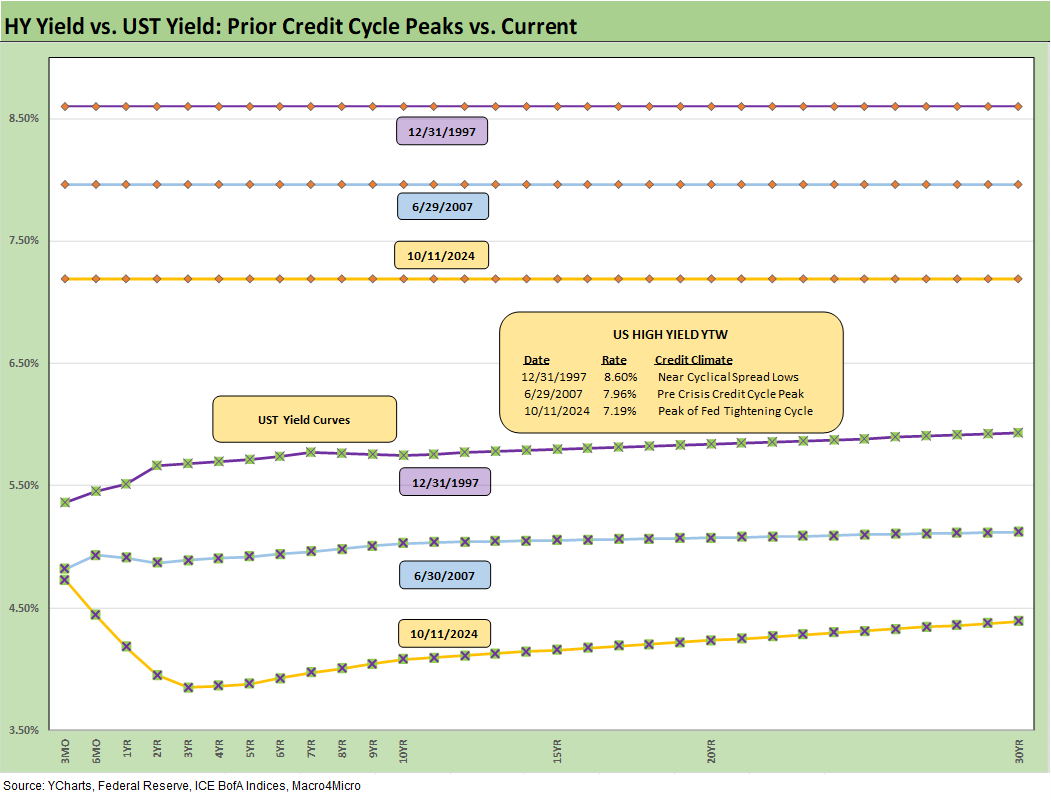
The above chart does the same exercise for the HY index that we just did in the prior chart for the IG index. A low UST curve and tight spreads bring the expected result.

The above chart updates the HY index YTW with the 5Y UST for another simple visual highlighting the relatively low incremental yield an investor receives vs. the risk-free comp. The current 1.85x ratio is well inside the long-term median of 2.91x.
We should add that political dysfunction in Washington on the debt ceiling is a qualifier on the term “risk free” these days at debt ceiling time. That debate awaits January 2025 when “who knows what” will be going on in Washington (think potential for Jan 6 replay only with more guns and more emboldened fanatics).
See also:
Footnotes & Flashbacks: State of Yields 10-13-24
Footnotes & Flashbacks: Asset Returns 10-12-24
CPI Sept 2024: Warm Blooded, Not Hot 10-10-24
HY OAS Lows Memory Lane: 2024, 2007, and 1997 10-8-24
Footnotes & Flashbacks: Credit Markets 10-7-24
Footnotes & Flashbacks: State of Yields 10-6-24
Footnotes & Flashbacks: Asset Returns 10-6-24
Mini Market Lookback: Cracking the 300 Line in HY 10-5-24
Payroll Sept 2024: Rushing the Gate 10-4-24
CarMax: Why Do We Watch KMX as a Bellwether? 10-3-24
Credit Returns: Sept YTD and Rolling Months 10-1-24
JOLTS Aug 2024: Openings Up, Hires Down, Layoffs Down, Quits Rate Down 10-1-24
Footnotes & Flashbacks: Credit Markets 9-30-24
Footnotes & Flashbacks: Asset Returns 9-29-24
Footnotes & Flashbacks: State of Yields 9-29-24
Mini Market Lookback: PCE Tailwinds, GDP Holds Serve 9-28-24
State Level Economic Reality Check: Employment, GDP, Personal Income 9-28-24
PCE Prices Aug 2024: Personal Income & Outlays 9-27-24
KB Home: Steady Growth, Slower Motion 9-26-24
Durable Goods Aug 2024: Waiting Game 9-26-24
2Q24 GDP: Final Estimate and Revision Deltas 9-26-24
New Home Sales Aug 2024: Waiting Game on Mortgages or Supply? 9-25-24
Lennar: Bulletproof Credit Despite Margin Squeeze 9-23-24
Mini Market Lookback: FOMC Week 9-21-24
Credit Crib Note: Service Corp International (SCI) 9-19-24
Existing Homes Sales Aug 2024: Mortgages Still Rule 9-19-24
FOMC Action: Preemptive Strike for Payroll? 9-18-24
Home Starts Aug 2024: Mortgage Rates to Kickstart Hopes Ahead? 9-18-24
Retail Sales: Down to the Wire? 9-17-24
Credit Crib Note: United Rentals (URI) 9-16-24
Industrial Production: Aug 2024 Capacity Utilization 9-17-24