
Payroll Sept 2024: Rushing the Gate
Payroll numbers soar and nuke estimates as the UST curve goes into backpedal mode and FOMC easing arguments turn up the volume.


Where do I find the new hires department?
Sept payroll saw the headcount tally climb with total employed in Sept at +430K from Aug in the Household data and unemployed down by -281K, the unemployment rate tick down to 4.1% and the structural underemployment U-6 metric move lower to 7.7% in Sept from 7.9% in Aug but still up from 7.0% in Sept 2023.
The wage growth of +4.0% outpaced inflation again. With so many headlines on collective bargaining numbers such as the Long Shoremen, UAW, etc., it is worth highlighting that the private sector is only 6% unionized and the lowest unemployment rates have been in right-to-work states.
We look at the payroll trends and occupational deltas for Sept below as the UST curve sees a bear upward shift from 2Y to 10Y biased towards bear flattening as we go to print with the 2Y UST up +19 bps and 10Y up +11 bps.
With a 1-month countdown to election day, the “bad economy” theme is a very tough sell unless you limit the discussion to past inflation experience or negative real wage growth from 2021 (while real wage growth from Feb 2020 pre-COVID is positive).
The rebuilding effort post-Helene was a topic for the talking heads and how the setback nets out with the rebuilding demands.
The economy gets some breathing room on a material contingent threat to inflation as well as jobs with the Long Shoremen’s temporary deal rolled in with the automation negotiations continuing in the collective bargaining process.

The above chart updates the running payroll adds with July revised higher by +55K and Aug revised higher by +17K. The +254K in Sept was the highest since March 2024 at +310K and Jan 2024 at +256K. The median adds since Jan 2009 was +210K.

The above chart updates the add/declines since Jan 2009 as the credit crisis was peaking. We adjust the visuals for the COVID distortions and detail those months in the box within the chart.
If you want to know what a bad economy looks like in employment (obviously, factual frames of reference are not used in politics), look back to 2009 to 2011. COVID was clearly an anomaly even if the mismanaged response is a separate topic. One could argue that the credit crisis was also a 6-standard-deviation event, but banks and underwriters and oblivious policymakers need to own it. Stupidity in policy and in Washington generally is never an anomaly (think of high across-the-board tariffs).
The median unemployment rate from Jan 2009 is 5.2% while we also could easily post 5.3% unemployment rate medians from the tightening 1994 or 5.8% from 1972. Those medians are well above almost all the recent state unemployment rates in Aug 2024 (see State Level Economic Reality Check: Employment, GDP, Personal Income 9-28-24).

The above chart updates the standard unemployment rate (U-3) at 4.1% vs. the structural underemployment rate of the U-6. Both the U-3 and U-6 are well below medians.

The above chart plots the “U-6 minus U-3” differential, and that is also below the median. The Fed has pivoted to the employment mandate and wants to see that stay below median by limiting the risks of material problems in employment. We would expect they were surprised by this month.

The above chart updates the payroll headcount vs. unemployment rates. This gets into the issue of “more paychecks matter” (Mo paychecks, Mo money, Mo spending). The 4.1% is comfortably below median and the total paycheck and consumer count keeps on growing with demographics. There is an ongoing discussion around what minimum job adds is needed to keep pace with demographic needs given the X factor of undocumented workers and immigrants.
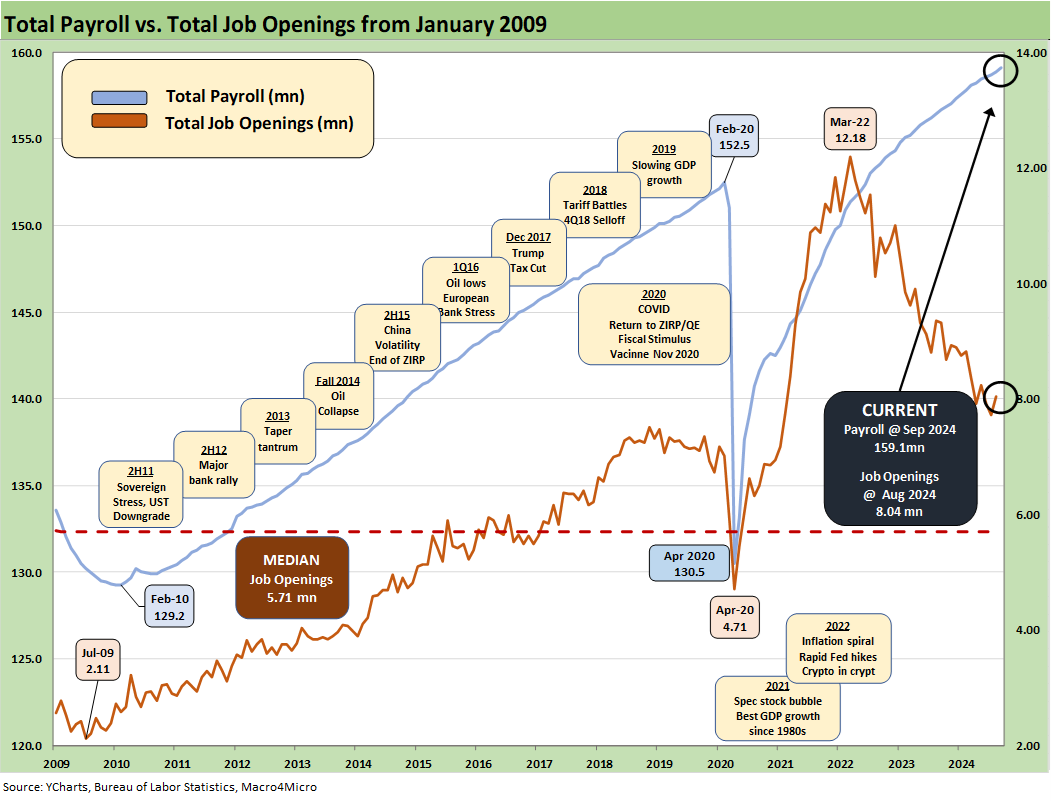
The above chart plots Total Payroll vs. Job Openings. The Aug 2024 JOLTS numbers signal strength at 8.0 million. The August Job Openings level is well above the highest number of the Trump years (7.5 million) reached in Nov 2018 but was well down from the peak in the Biden years of 12.2 million in March 2022 (see JOLTS Aug 2024: Openings Up, Hires Down, Layoffs Down, Quits Rate Down 10-1-24). Relying on JOLTS is tricky, but the pop in Sept 2024 following the JOLTS rise in August makes a bit more sense now.

The above chart plots the CPI vs. unemployment since the 1970s stagflation years when the “Misery Index” became “a thing” with CPI + Unemployment (see Misery Index: The Tracks of My Fears 10-6-22).
Occupational deltas for Sept payroll…
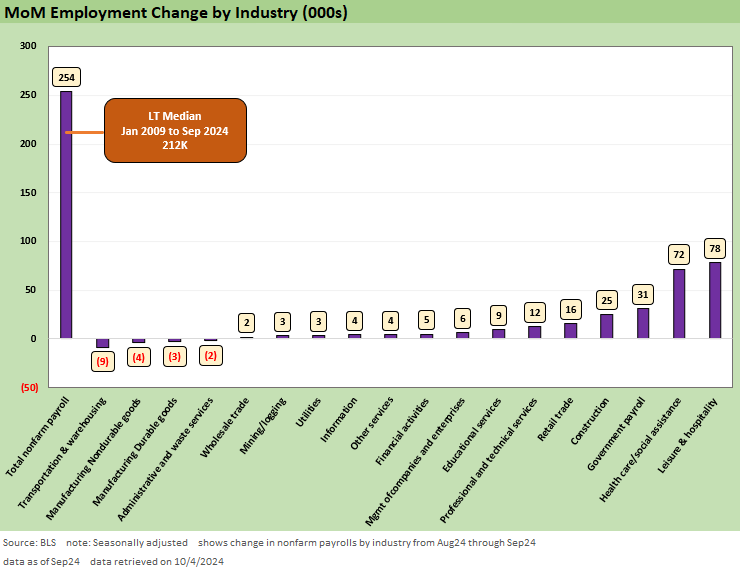
The above chart breaks out the sequential monthly payroll deltas by major industry group. The labor-intensive Leisure and Hospitality category weighed in at #1 with Healthcare and Social Assistance at #2. A striking MoM delta ranking at #3 is again in Government with the State and Local Government hires totally dominating the action. We look at those line items further below.
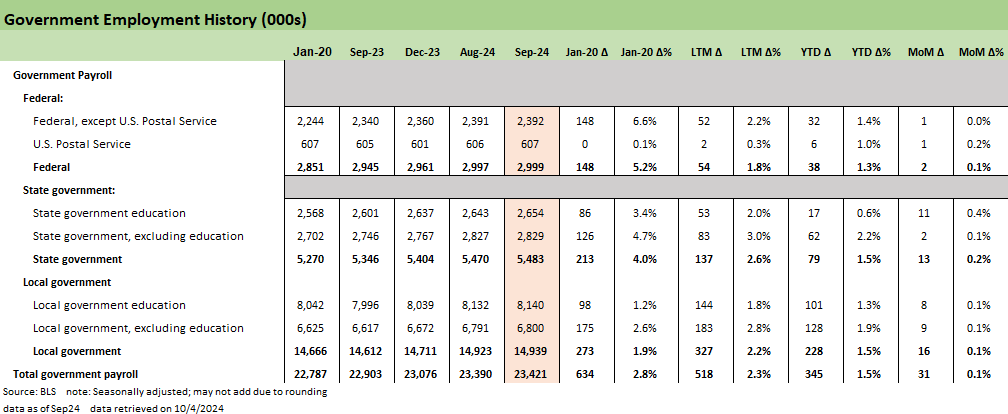
We have been looking at the utter hypocrisy (and dishonesty) of so many states hyping a dystopian view of the national economy while generating banner numbers in their backyard (see State Level Economic Reality Check: Employment, GDP, Personal Income 9-28-24, State Unemployment: A Sum-of-the-Parts BS Detector 6-30-24). The State level and Local level were both strong yet again as Government payrolls added 518K jobs in government over the past year with Local government at +327K and State at +137K. Federal was only 54K.
Construction continues to add jobs and will remain busy into 2025 with current projects, long-term construction projects locked in, rates moving lower, and sadly the need for massive rebuilding after Helene.

The above chart does the same occupational delta drill but for the timeline from Jan 2020 just before COVID. The demographic tailwinds continue to drive Health Care and Social Assistance. The longer timeline shows the secular expansion of Transportation and Warehousing in part to meet the demands and efficiency upgrades of an expanding economy (think Amazon as a new leader in transport services).
Professional and Technical Services are a strong #2 as it took a while for Leisure and Hospitality and Retail to get back in the game after COVID. Construction shows the boom of a strong economy in 2021 on the post-COVID rebound as well as the waves of projects that came with the infrastructure bill, the CHIPS Act, IRA, and private sector activity broadly as covered in other commentaries (see Construction Spending: A Brief Pause? 9-3-24, 2Q24 GDP: Into the Investment Weeds 7-25-24, Construction: Project Economics Drive Nonresidential10-2-23).

The above chart breaks out the bigger picture on the various private sector payroll deltas. We break out the MoM, YTD, LTM, and post-COVID payroll deltas by these private sector groupings. Private sector payroll is up by 223K MoM, 1.46 million YTD, 1.92 mn LTM, and 6.43 million since Jan 2020 ahead of COVID.
That 6.43 million since before COVID calls into question (eviscerates?) the idea that all the jobs added under Biden were just “bounce-back” jobs. The fact that almost all the Government jobs added (see separate chart below) with a State and Local bias in the last 12 months also makes for useful input on the political spin.

The above chart summarizes Manufacturing jobs as the perennial hot topic. The above chart breaks out line items within Durables also and we look at Nondurables in the next chart. The facts around Manufacturing jobs show that the new millennium “Manufacturing Renaissance” has not happened by any stretch under any party.
We look at the Trump vs. Biden contest in other commentaries (see Goods and Manufacturing: Fact Checking Job Rhetoric 9-5-24). Since Jan 2020, we see only +132K net adds to payroll and lost manufacturing jobs in the Trump years. Note this excludes Construction under the “Goods” banner. The downsizing of major industries such as the auto sector did not help back in the first decade of the millennium.

The above chart updates Nondurables as the “secular dog” of manufacturing. Very little good has happened since Jan 2020 (or the year 2000 for that matter), LTM, YTD or MoM as this group subsists on Food Manufacturing and Chemicals.

We routinely update the multi-year good news in Construction separately (see Construction Spending: A Brief Pause? 9-3-24, Construction Spending: Timing is Everything 12-1-23, Construction Spending: Demystifying Nonresidential Mix 5-9-23). We see 238K construction jobs added LTM and 723K since Jan 2020. The additions are spread across a wide range of markets in Nonresidential, Residential and the Public and Private sectors as noted above.

The above chart updates Services, which is the 1,000-pound gorilla of headcount in a services economy even if Manufacturing is always the most contentious. We see 202K MoM, 1.32 million YTD, and 1.7 million jobs added LTM. Bad economy? (HUH?!)
We earlier cited the inconsistency of political rhetoric on the national economy vs. the state level unemployment, GDP and personal income trends at the state level. That dishonesty runs right up through the data reported this past Friday (see State Level Economic Reality Check: Employment, GDP, Personal Income 9-28-24).
An honest politician has always been a percentage game, but in the new fact-free age it is a Martian sighting. That is true even for the most self-anointed paragons of honesty and idol-worshipping, hypocritical holy rollers who see the end as justifying the means. “The economy is good but could be better” is a more realistic assessment. Jobs count, and it was a good month.
See also:
Credit Returns: Sept YTD and Rolling Months 10-1-24
JOLTS Aug 2024: Openings Up, Hires Down, Layoffs Down, Quits Rate Down 10-1-24
Footnotes & Flashbacks: Credit Markets 9-30-24
Footnotes & Flashbacks: Asset Returns 9-29-24
Footnotes & Flashbacks: State of Yields 9-29-24
Mini Market Lookback: PCE Tailwinds, GDP Holds Serve 9-28-24
State Level Economic Reality Check: Employment, GDP, Personal Income 9-28-24
PCE Prices Aug 2024: Personal Income & Outlays 9-27-24
KB Home: Steady Growth, Slower Motion 9-26-24
Durable Goods Aug 2024: Waiting Game 9-26-24
2Q24 GDP: Final Estimate and Revision Deltas 9-26-24
New Home Sales Aug 2024: Waiting Game on Mortgages or Supply? 9-25-24
Lennar: Bulletproof Credit Despite Margin Squeeze 9-23-24
Footnotes & Flashbacks: Credit Markets 9-23-24
Footnotes & Flashbacks: State of Yields 9-22-24
Footnotes & Flashbacks: Asset Returns 9-22-24
Mini Market Lookback: FOMC Week 9-21-24
FOMC Action: Preemptive Strike for Payroll? 9-18-24
Home Starts Aug 2024: Mortgage Rates to Kickstart Hopes Ahead? 9-18-24
Retail Sales: Down to the Wire? 9-17-24
Industrial Production: Aug 2024 Capacity Utilization 9-17-24
Consumer Sentiment: Inflation Optimism? Split Moods 9-13-24