Footnotes & Flashbacks: Credit Markets 9-30-24
We look back at last week’s downright peaceful market for credit spreads as life might heat up with payroll numbers and fresh FOMC handicapping.
Is there a parking meter somewhere?
Negligible price action in US credit markets last week and light spread action across IG and HY set the stage for a busier week ahead with JOLTS, payroll, the ISM collection, and a potential shutdown in East Coast and Gulf ports after midnight Monday.
The potential Longshoremen (ILA) strike is getting major headlines for good reason while the freight and logistics trade press is really locked in on the scale of a protracted strike given the volumes involved at almost half of import flows.
For those who debate what widespread tariffs mean, the freight sector and industry watchers are already drawing parallels to the disruptions of COVID and escalation of tariffs in 2018. That will set the stage for politics here given the tariff inflation debates underway on a much larger scale than 2018-2019.
Biden has already made it clear that his administration will not use the law to demand the ILA stay on the job under Taft-Hartley, so this could get political very quickly in the “friend of the working man” contest.
The strike could start just after midnight, and it could go away quickly if port owners and maritime employers fold. The game theory is not hard to figure out with respect to who holds more cards in the first “full coast” strike by the ILA since 1977.
The above chart updates the YTD total returns and excess returns for IG and HY as well as by credit tier. This week is very similar to last week with another week of coupon and carry and very slight credit spread contraction of -1 bps for IG and HY. We will not do a full replay of last week since we covered it in detail with some historical context (see Footnotes & Flashbacks: Credit Markets 9-23-24).
We also looked at the very muted yield curve action separately. UST moves were very mild but a net negative for bond ETFs (see Footnotes & Flashbacks: State of Yields 9-29-24). We framed the range of asset returns across the 32 benchmarks and ETFs that posted mixed numbers on the week (see Footnotes & Flashbacks: Asset Returns 9-29-24, , Mini Market Lookback: PCE Tailwinds, GDP Holds Serve 9-28-24).
This week will likely turn on payroll numbers and not the debate. ISMs will be valuable inputs for the FOMC handicapping exercise.
The above chart updates the running cumulative YTD excess return comparison for IG vs. HY, and the world is running along a rational pattern of “more credit returns for more credit risk.” The soft-landing school has prevailed so far and inflation is in check, so this is a logical outcome that awaits new variables and inputs and continued “shock avoidance.”
The questions of what risks to discount into pricing expectations to reflect forward looking fiscal actions and trade policy risks (tariffs and inflation, retaliation, etc.) still await another day. The market needs a better sense of who will call the shots on tariffs and trade (White House), who will control the purse strings (the House) with its related debt ceiling risks, and who will decide whether the Senate will go nuclear on some key topics (Roe v. Wade) or declare a full-on majority only and kill the filibuster tradition.
The above BB vs. BBB running excess returns remains compressed and a core focus for BBB buyers that can straddle the line of BBB vs. BB. The BBB tier brings duration plays on more issuers in a 44.2 trillion bond mix while the BB tier brings a longer shopping list in the search for credit value. The lines between BBB and BB are more blurred than ever, but the reality is that derisking moves or major equity market repricing will fall harder on the BB tier.
The CCC tier continues to run away from the pack in excess returns in 2024 and was the one tier with another material tightening move this past week to a running YTD excess return over 10 points (1000 bps). The CCC tier is a story traditionally dominated by the most leveraged deals most at risk in credit cycle downturns (see The B vs. CCC Battle: Tough Neighborhood, Rough Players 7-7-24). The current cycle has seen that history evolve somewhat with the rise of private credit.
The rise of private credit does not change the basic reality of the CCC tier where it can see performance wagged by “dropouts and drop-ins” and by distressed exchanges as those flow into the constituent mix for the CCC tier. The history of material decompression waves reverberating up from the bottom will still be a sign of turns in the cycle or more defensive OTC market making during troubled times.
Another interesting twist on the rise of private credit is the ability of private credit to support restructuring activity, refinancing, and related transactions when a HY bond issuer does head toward default or recapitalization. The PE firm can get organized with some related entities for the purchase and recap of troubled names. That can in substance mitigate downside risks in pricing.
The above chart posts the IG OAS at +92 bps, which is -1 bps tighter on the week. As we covered in last week’s Footnotes and many other commentaries, the IG index has spent long stretches (years) with spreads in the high 80s to low 90s range. Those are noted above with 1H04 to 1H07 the most prolonged period, but the 1997-1998 period saw a stretch from record lows into a mid-90’s average in 1997-1998.
HY also posted a minor -1bps move on the week. Both IG and HY are in line with prior credit cycle tights (or in the general neighborhood) as noted in the timeline.
The “HY minus IG OAS” differential went sideways on the week and is still above the recent lows and close to past cyclical tights such as June 2014. The gap between the current +222 bps and the long-term median of +328 bps is the main story.
The “BB OAS minus BBB OAS” differential widened by +2 bps on the week and remains wide to the multicycle low of +55 bps hit in late July 2024 as noted in the chart. The + 76 bps is a very long way from the +135 bps long-term median.
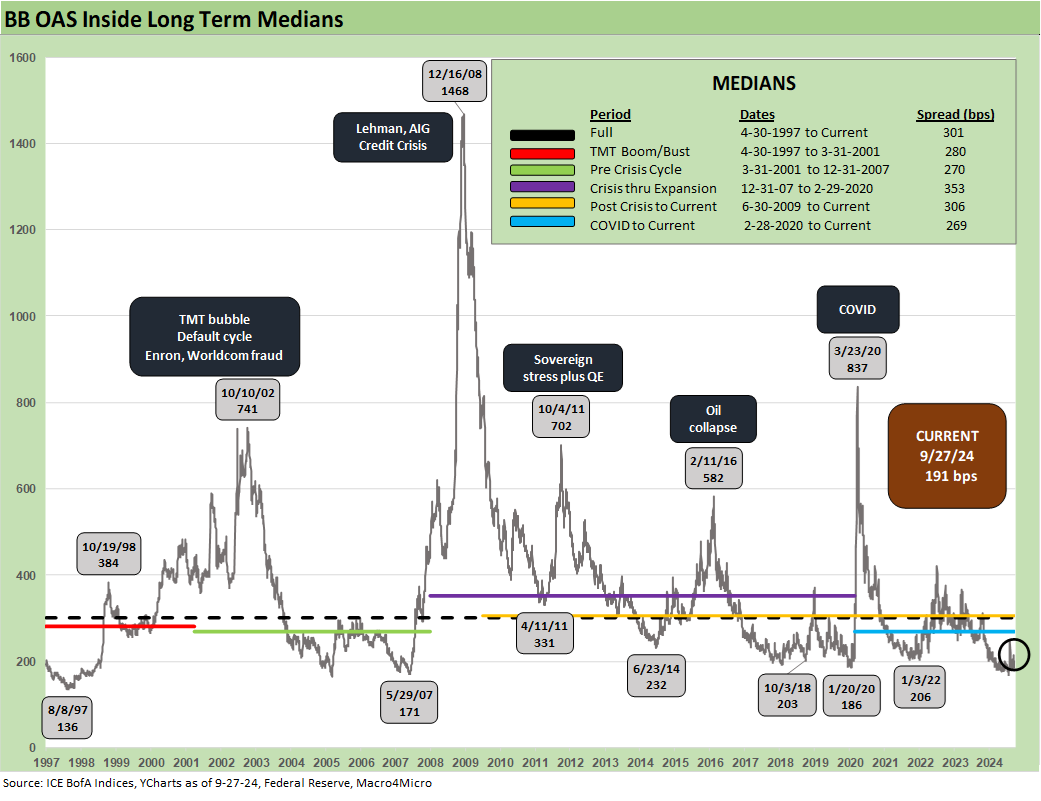
The above chart shows a BB tier that was unchanged on the week and close to the multicycle lows of Jan 2020 and inside the lows of Oct 2018 and June 2014.
The B tier has been the compression story of this cycle after hitting lows in July at +278 bps. The current +307 bps B tier OAS is comfortably inside the Jan 2020 lows, the Oct 2018 lows, and the June 2014 lows. The journey back to early June 2007 bubble of +236 is still a very long way off.
We wrap our credit spreads update with a long-term time series showing the B tier vs. the CCC tier and the periodic, sharp divergences between the two lowest tiers when the credit cycle turns. The rally in CCC tier OAS finally kicked into gear with CCC tier OAS down to +840 bps from the chronic 900+ handles seen until this month.
Exchanges and constituent migration moves are typically the main event in such a CCC move. The long-term median of +961 bps set the bar, and the current CCC mix is less tied to hyper-leveraged LBOs and cash bleeders than past cycles. We occasionally look at the checklist of issuers and there is always a very wide range of dollar prices in this tier. The energy crisis of the pre-COVID years was other worldly in B and CCC tier dollar price collapses.
As we covered earlier and in more detail in a dedicated commentary on the topic, there is a wild history in the CCC tier price action as default fears rear up and secondary liquidity evaporates (see The B vs. CCC Battle: Tough Neighborhood, Rough Players 7-7-24).
Those B vs. CCC tier price disconnects are the times when the distressed investors swoop in and look for value in the price dislocations. While the Volcker Rule may have sucked a lot of liquidity out of the market that used to set dollar price floors (even if very low floors) on CCC falling knives, the private credit wave has the potential to inject a lot more capital back in (and then some).
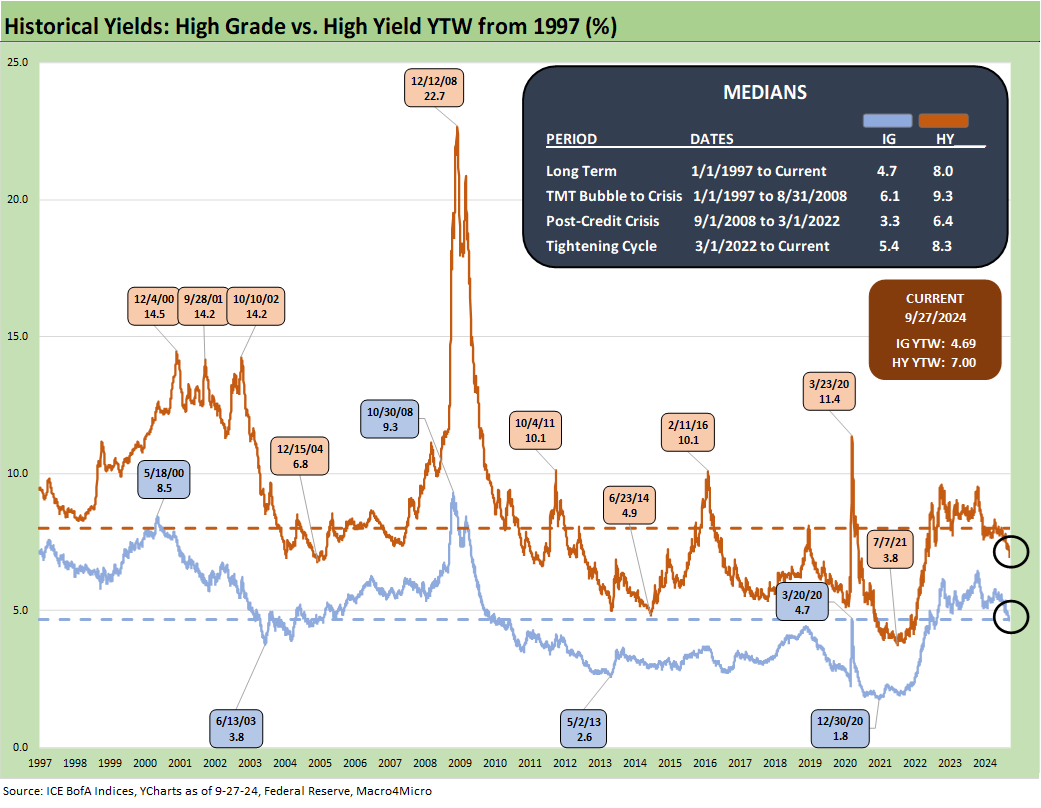
We wrap our spread update with the running yields on IG vs. HY. As we have routinely covered, the pre-crisis yields are the most relevant comparison. Less relevant as a comparison is the ZIRP years and temporary efforts at normalization.
Even in 2019, the FOMC slow tightening was scrapped when the Fed had to bail out the struggling Trump economy just ahead of the COVID return to ZIRP. The 6.1% IG YTW and the 9.3% HY YTW are the long-term medians most relevant to the post-tightening cycle HY universe. The low UST curve together with tight spreads has carried the day with the 4.69% IG and 7.0% HY market.
The above chart updates the current IG index yields vs. two notable credit cycles of late 1997 and mid-2007. We include those index yields on the horizontal lines and include the UST curves for the same dates.
The above chart does the same exercise for the HY index and the UST curves as the yield chart for IG. Once again, spreads are compressed, but the UST curve is radically lower than prior credit cycle peaks.
Memories faded in the post-crisis ZIRP years followed by COVID ZIRP around what a “real” yield curve looked like in current coupons. The market is now in a post-tightening, non-ZIRP world with the lowest UST curve seen in such a market looking back to the 1970s.
See also:
Footnotes & Flashbacks: Asset Returns 9-29-24
Footnotes & Flashbacks: State of Yields 9-29-24
Mini Market Lookback: PCE Tailwinds, GDP Holds Serve 9-28-24
State Level Economic Reality Check: Employment, GDP, Personal Income 9-28-24
PCE Prices Aug 2024: Personal Income & Outlays 9-27-24
KB Home: Steady Growth, Slower Motion 9-26-24
Durable Goods Aug 2024: Waiting Game 9-26-24
2Q24 GDP: Final Estimate and Revision Deltas 9-26-24
New Home Sales Aug 2024: Waiting Game on Mortgages or Supply? 9-25-24
Lennar: Bulletproof Credit Despite Margin Squeeze 9-23-24
Footnotes & Flashbacks: Credit Markets 9-23-24
Footnotes & Flashbacks: State of Yields 9-22-24
Footnotes & Flashbacks: Asset Returns 9-22-24
Mini Market Lookback: FOMC Week 9-21-24
FOMC Action: Preemptive Strike for Payroll? 9-18-24
Home Starts Aug 2024: Mortgage Rates to Kickstart Hopes Ahead? 9-18-24
Retail Sales: Down to the Wire? 9-17-24
Industrial Production: Aug 2024 Capacity Utilization 9-17-24
Consumer Sentiment: Inflation Optimism? Split Moods 9-13-24


