
New Home Sales Aug 2024: Waiting Game on Mortgages or Supply?
New home sales did a sequential fade with solid YoY at run rates that still translate into higher builder revenue.


There is no relief like supply…
New single family home sales for Aug 2024 ticked down sequentially at -4.7% from the revised July sales rate but rose by +9.8% YoY vs. Aug 2023 with the critical South market holding in well from July 2024 and 3 of the 4 other regions lower.
Median prices were down vs. July 2024 and August 2023 at $420.6K for Aug 2024 with completed homes for sale at the end of the period at an LTM high on both a SAAR and not seasonally adjusted basis.
The housing policy discussions seems to have calmed down as a political topic and did not get much focus in the single debate.
The supply side of the challenge in housing is not going away any time soon as policy makers have little they can do near term as mortgage rates will remain the main event on monthly payment affordability (see Harris Housing Plan: The South’s Gonna Do It Again!? 8-28-24).

The above chart updates the timeline of new single family homes since 1963, and the current 716K is well ahead of the long-term median of 632K and the post crisis (June 2009 recession trough) median of 571K. The one timeline median broken out above that was materially higher than current levels was during the housing bubble of 2001-2009 with its median of +989K.
The housing bubble and related new home boom was driven by easy credit and high LTVs. In that cyclical spike, the markets saw the credit quality of the mortgage borrower as a tertiary factor (in many cases a no-doc nonfactor). That is an old story at this point. The main reason it is still relevant is that this current level of demand is demographically driven by high need rather than credit enticement.
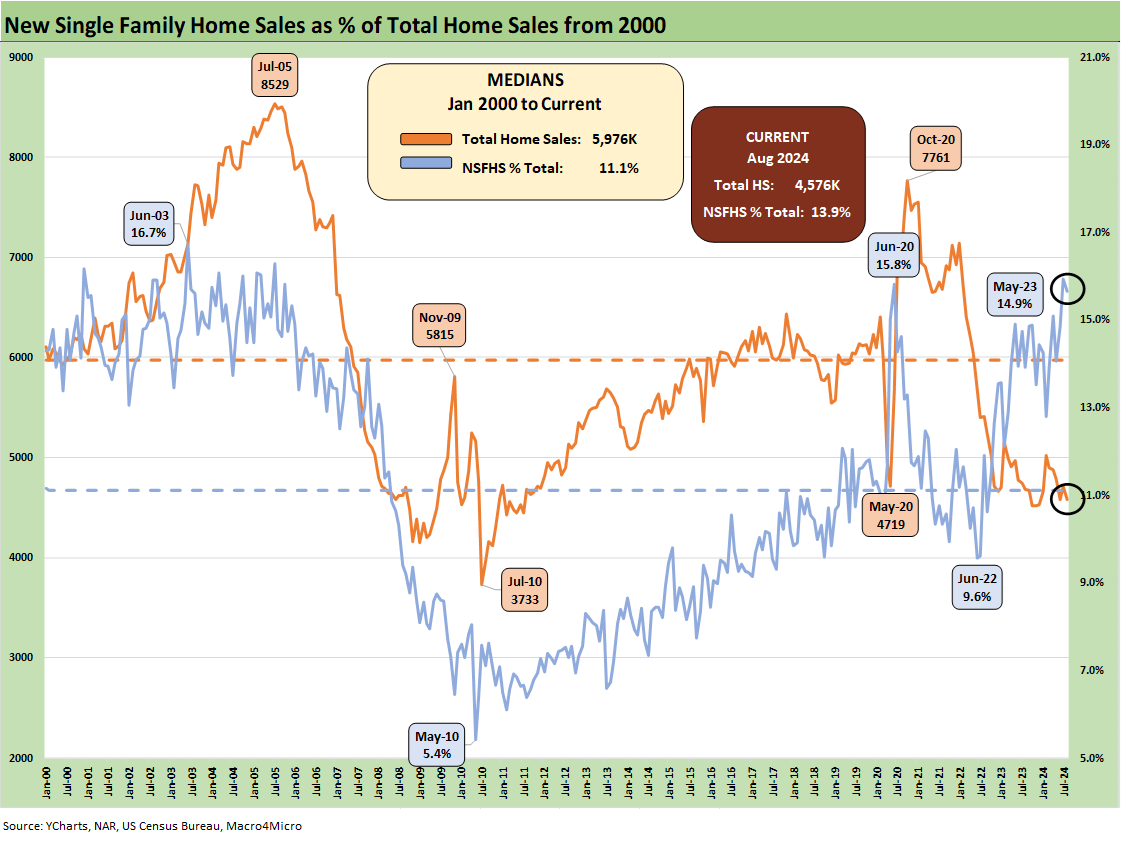
The above chart updates the share of total home sales (existing + new) held by new home sales. This past month saw a 13.9% share or above the long-term median of 11.1% since Jan 2000. The strains on existing home sales tied to barriers to refinancing for the sellers (“locked in effect,” “golden handcuffs,” etc.) have been picked over. The mix of factors has given homebuilders opportunities to use their captive inventory (i.e., they build it) and their range of incentive alternatives (mortgage buydowns, fee waivers, price cuts) to drive volumes.
This week we had looked at Lennar and its volume and land light focus as one example of how a major builder has shifted strategies (see Lennar: Bulletproof Credit Despite Margin Squeeze 9-23-24). Volume and inventory turnover and shorter construction cycles have helped some builders drive more cash flow even with lower average sales prices.
Some builders have branched out into other business lines such as build-to-rent where the builder sells those homes to institutional investors. Among builders, D.R. Horton is front and center in that business (see Credit Crib Note: D.R. Horton (DHI) 8-8-24). The opposition to investment capital in some pockets of Washington (notably Senate progressives who oppose build to rent) is mystifying when newly constructed homes of any kind add to the supply of housing stock. That is a story to revisit on another day. Harris has embraced that bill as part of her plan. That bill will not pass.

The above chart updates the time series for median prices vs. new home sales volumes. The sales volumes are running well ahead of the long-term median but volumes struggled during the worst of the mortgage rate migration as affordability came under so much pressure.

The above chart offers a time series for the median new single family home price from before COVID (Jan 2020). The journey from $310K in April 2020 to the current $420.6K came alongside sharp increases in 30Y mortgage rates that hammered monthly payment burdens.

The above chart posts the monthly median price back to Jan 2022 ahead of the tightening cycle start in March 2022.

The above chart plots the historical time series for new home sales in the two largest markets of the South (64% of Aug sales) and the West (21% of Aug sales). As we covered in our look at the Harris housing plan (such as it is at this point), the imbalance of low cost single family housing is brutal and mortgage rates are undermining the ability of that tier of buyer on monthly payment pain (see Harris Housing Plan: The South’s Gonna Do It Again!? 8-28-24). With the South so large in the single family picture, any plan will be “married to the South” and regional contractors and subcontractors.
So far, the Harris plan has not given a lot of air time to realistically addressing supply other than the usual citation of “3 million more units.” We watched Harris’ economic presentation this afternoon and she gave more focus to the supply side of the topic to counter some of the earlier criticism. She cited the need to work with regional builders and contractors.
Overall, the Harris policy has been dismissed by many sources for only realistically and specifically focusing on demand and government support. The supply side needs more detail. The talking heads on financial cable have generally tagged a demand side stimulus for entry level housing as inflationary unless supply can be grown quickly alongside the fiscal support for demand. To date, there has not been much infill on definitions of “affordable” or how that flows into “first time” or “entry level” by region.
In the other corner, Trump has no plan on housing at all other than to say rates will be lower and all prices lower. We even heard UST rates will be cut in half so that means record lows in mortgage rates that would require a 1% handle on the UST 10-year with the US facing record borrowing needs alongside the booming economy he promises. After a while, you just give up on basic economic logic and any semblance of reality to embrace such views.

The above chart updates the time series for new single family homes in the two smallest new home sales markets of the Midwest (11% of Aug sales) and the Northeast (4% of Aug sales). Both markets are posting sales below the long-term median despite the greater demographic demand of current times.
See also:
Footnotes & Flashbacks: Credit Markets 9-23-24
Footnotes & Flashbacks: State of Yields 9-22-24
Footnotes & Flashbacks: Asset Returns 9-22-24
Mini Market Lookback: FOMC Week 9-21-24
FOMC Action: Preemptive Strike for Payroll? 9-18-24
Consumer Sentiment: Inflation Optimism? Split Moods 9-13-24
Construction Spending: A Brief Pause? 9-3-24
PCE July 2024: Inflation, Income and Outlays 8-30-24
2Q24 GDP 2nd Estimate: The Power of 3 and Cutting 8-29-24
Housing and Homebuilders:
Lennar: Bulletproof Credit Despite Margin Squeeze 9-23-24
Existing Homes Sales Aug 2024: Mortgages Still Rule 9-19-24
Home Starts Aug 2024: Mortgage Rates to Kickstart Hopes Ahead? 9-18-24
Harris Housing Plan: The South’s Gonna Do It Again!? 8-28-24
New Home Sales July 2024: To Get by with a Little Help from My Feds? 8-24-24
Existing Home Sales July 2024: Making a Move? 8-23-24
Housing Starts July 2024: The Working Capital “Prevent Defense” 8-16-24
Credit Crib Note: PulteGroup (PHM) 8-11-24
Credit Crib Note: D.R. Horton (DHI) 8-8-24
New Homes Sales June 2024: Half Time? Waiting for Mortgage Trends 7-24-24
Existing Home Sales June 2024: Supply Up, Prices Up, Volumes Down 7-23-24
Housing Starts June 2024: Still All About the Deliveries 7-17-24
Homebuilder Equities: “Morning After” on Rate Optimism 7-12-24
Homebuilders: Equity Performance and Size Rankings 7-11-24
Credit Crib Note: KB Home 7-9-24
Lennar: Key Metrics Still Tell a Positive Macro Story 6-20-24
Credit Crib Note: NVR, Inc. 5-28-24