
Footnotes & Flashbacks: Asset Returns 10-6-24
Payroll soared, duration was punished, industry groups/benchmarks were mixed, missiles flew, oil spiked, and freight chaos was averted. Busy week.


Let’s try 1997 for the wayback machine.
Unlike these jokers, Clinton had a lot of 4% GDP growth years, a balanced budget, a housebroken Congress, and no recessions in 8 years.
With earnings season kickstarting this week and a few big banks teed up (JPM, WFC), color on consumer and corporate asset quality and loan demand will be useful input after such a banner payroll number on Friday (see Payroll Sept 2024: Rushing the Gate10 10-4-24). We will also get some interesting details from Pepsi and Delta on the consumer.
The CPI and PPI tag team will feed the FOMC handicappers more inputs after a week that saw soaring payroll send the UST into bear flattener mode and leave all bond ETFs in the red for the week with the long duration UST ETF (TLT) in dead last for the week and the month and still in the red YTD.
Credit markets were highlighted by a massive rally in HY spreads to levels not seen since the 2007 credit bubble (see Mini Market Lookback: Cracking the 300 Line in HY 10-5-24).
Equities were mixed with the large cap S&P 500 and NASDAQ positive, Midcaps positive, but small caps negative. We saw 5 of 11 S&P 500 sectors in negative range, so it was not all good news in risk.
The payroll number was good news for the economy, but valuations are still a battle from here even in the face of solid projected earnings into 2025 and a massive gap between Presidential candidates in a dead heat election that still has turned into a disinformation battle around how state level economies are performing (see State Level Economic Reality Check: Employment, GDP, Personal Income 9-28-24).
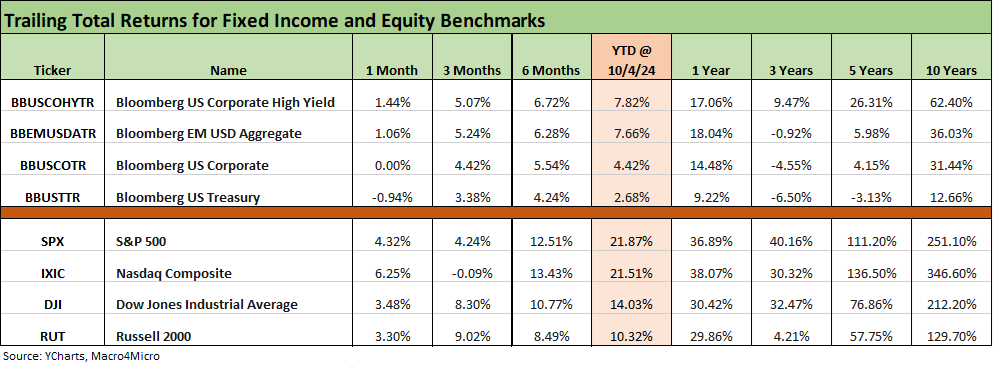
The above chart updates the running returns for the high-level debt and equity benchmarks we monitor, and we see the setbacks in debt performance from the past week undermining trailing 1-month returns. UST returns dropped into negative for the1-month period vs. +1.0% last week as YTD returns for UST hit +2.7%, down from 4.1% last week.
The equity benchmarks are directionally mixed with the NASDAQ checking into negative territory for the past 3 months but still running north of 21% for the YTD period and over 13% for 6 months. The Russell 2000 has posted a solid 3 months ride but is still at the bottom of the major indexes for 6 months and YTD but closer to the group over 1 year with the strong numbers posted in Nov 2023 (see Footnotes & Flashbacks: Asset Returns 12-3-23).
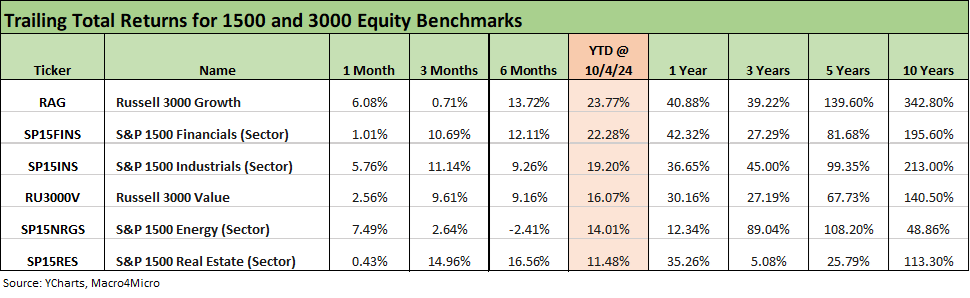
The above chart updates the 1500 and 3000 series with the full lineup in positive range for 1 month and 3 months but Real Estate feeling the effects of the UST swing this past week and being overtaken YTD by Energy as Real Estate dropped into last place YTD. For the week, the sequential move to +0.43% for Real Estate in1-month returns marked a decline from +2.8% last week.
With Iranian missiles and an expected response from Israel, oil is moving higher quickly, and that next move is intuitively unpredictable as most strategic premiums have proven to be over the decades. The elements of missiles flying, Lebanon under siege, Saudis potentially moving more into market share mode, and the “drill, drill, drill” policy handicapping all make for a potentially volatile period ahead in upstream energy. That is a day ending in Y – only more so with this mix.
The rolling return visual
In the next section, we get into the details of the 32 ETFs and benchmarks for a mix of the trailing periods. Below we offer a condensed 4-chart view for an easy visual on how the mix of positive vs. negative returns shape up. This is a useful exercise we do each week looking for signals across industry groups and asset classes. We also have a YTD version that we include in the broader commentary on the time horizons further below.

The above chart flags the visual of a very choppy, mixed and net negative 1-week period that also highlights an all-positive LTM. While not part of the above visual, the return profiles also include a very favorable YTD set of metrics. The 1-month and 3-month positive symmetry is also not signaling trouble as we head into a period looking for more easing and decent quarterly earnings numbers.
The Magnificent 7 heavy ETFs…
Some of the benchmarks and industry ETFs we include have issuer concentration elements that leave them wagged by a few names. When looking across some of the bellwether industry and subsector ETFs in the rankings, it is good to keep in mind which narrow ETFs (vs. broad market benchmarks) get wagged more by the “Magnificent 7” including Consumer Discretionary (XLY) with Amazon and Tesla, Tech (XLK) with Microsoft, Apple, and NVIDIA, and Communications Services (XLC) with Alphabet and Meta.

We looked at the Tech bellwether results in our earlier Mini Market Lookback, and the overall performance on the week was somewhat of a near split-decision. We saw 4 of the Mag 7 in negative range in the bottom 4 line items and 3 positive. The swing vote by Broadcom and Taiwan Semi were both positive.

We looked at the 1-week performance already in our Mini Market Lookback: Cracking the 300 Line in HY (10-5-24). The positive vs. negative split was weaker than most of those seen in recent weeks with the bond ETFs turning all negative. We also see a mixed range of industry equity performances as underscored by weak small cap performance, a negative Equal Weight S&P 500 ETF (RSP), and a negative Equal Weight NASDAQ 100 ETF (QQEW). The interest-rate-sensitive sectors such as Homebuilding (XHB), Real Estate (XLRE) and dividend plays such as Consumer Staples (XLP) were in the bottom quartile.
The best performing bond ETF was HY (HYG) on material spread compression, but that ETF was still negative on the week given the bear flattener along the UST curve that offsets a rare multicycle event for HY spreads with the ICE HY index OAS dipping below the +300 bps line to +289 bps. That is right in the thick of the Dec 1997 credit peak area and like the June 2007 HY bubble period spreads. In June 2007, HY OAS hit that level after widening off the lows to start that month (see HY Spreads: Celebrating Tumultuous Times at a Credit Peak 6-13-24).
For the winners on the week, energy was a strong performer. Iran-Israel escalation (and more to come) carried the week for E&P (XOP) and Energy (XLE) while Midstream (AMLP) also made the Top 5. China stimulus is keeping commodities and base metals (DBB) and the China-heavy EM Equities ETF (VWO) rolling along.

The 1-month returns make a mixed statement with no broad benchmarks in the top quartile for that period. We see NASDAQ, the S&P 500 (SPX), Midcaps (MDY), and Equal Weight NASDAQ 100 (QQEW) in the second quartile. The Equal Weight S&P 500 ETF (RSP) and Russell 2000 small caps (RUT) are down in the third quartile.
Earnings season, CPI, the chance for more rate cuts, and a stabilizing consumer sector could change that math for the next rolling month. The fly in that ointment is the clock is ticking on tariffs, the potential discounting of economic shock risk, and the bigger, more immediate shock risk could be tied to an oil spike in a Middle East escalation with Iran.
The election date is now inside the 1-month countdown and who knows what will happen or whether the results will be rejected again. Washington will be ready this time, and the “wannabe dictator” is at least not set to run the “possession is nine tenths of the law” strategy. That should mitigate some of the chaos flowing into the markets right away if we have another contested election.
The winners for the month show the banner post-China-stimulus reaction for EM Equities (VWO) and in turn Base Metals (DBB). We also see the oil benefits of the past week for E&P (XOP) and Energy (XLE) as they climbed into the top quartile. The Tech comeback works in this 1-month timeline with the Tech ETF (XLK) and the Mag 7 wins are a matter of measurement periods as Communications Services (XLC) also edged into the top tier.
Homebuilders (XHB) are still in the upper tier as they bounce around. For homebuilders, there will be plenty of valuation debates to have for a sector that prospered in a 7% and high 6% range mortgage environment.
The bottom quartile dwellers for the month included 5 of the 7 bond ETFs with the long duration UST ETF (TLT) in last place with only EM Sovereigns (EMB) and HY (HYG) making it into the third quartile. For the month, we see 3 of 7 bond ETFs (TLT, GOVT, AGG) in negative range with 2 others (SHY, LQD) barely positive.
Regional Banks (KRE) have been bouncing around for weeks and months, but KRE is also in the red zone for this trailing 1-month period. Interestingly, KRE is #3 for the trailing 3-months period as we flag in the next chart. For the YTD period, KRE is in the bottom half of the third quartile while the broader Financial ETF (XLF) is in the Top 5 on the list. March 2023 is “gone but not forgotten” and the commercial real estate links run deep.

The 3-month period posted a score of 28-4. The rolling 3 months is interesting as duration was starting to bring some positive asset returns. We see some interest rate sensitive equity ETFs leading the way with Homebuilders (XHB), Utilities (XLU), Real Estate (XLRE) and the bank duo of Regional Banks (KRE) and the broad Financial ETF (XLF) in the top quartile.
Among notable rankings was the small caps ahead of Midcaps (MDY) in the second quartile with the S&P 500 in the third quartile and NASDAQ in the bottom quartile. To underscore the tech setbacks, the Equal Weight S&P 500 ETF (RSP) made the bottom of the top quartile with the Equal Weight NASDAQ 100 also in the bottom quartile with the NASDAQ.
The duration support is evident in the long duration UST ETF (TLT) sitting near the middle of the pack despite still being one of only 2 asset lines in the red YTD (next chart). The EM Sovereign ETF (EMB) is just ahead of TLT while we see the short duration UST 1Y to 3Y ETF (SHY) as the only bond ETF in the bottom quartile with a positive return over 2%.
The 3-month period has no bond ETFs in negative range, and this period had seen some downward shifts on the way to an FOMC -50 bps move (see FOMC Action: Preemptive Strike for Payroll? 9-18-24). We will update the Footnotes publication on State of Yields later today, but we covered the main moves of the UST already in the Mini Market Lookback. The 2Y UST rise significantly outpaced the 10Y UST move, but both were adverse moves for bonds.

The YTD score is 30-2 with the Transport ETF (XTN) in last place and the long duration UST ETF (TLT) just ahead of it with a slight negative return. As the crow flies YTD, we see 5 of the 7 bond ETFs in the bottom quartile with HY (HYG) and EM Sovereigns (EMB) just across the border in the bottom of the third quartile.
The YTD winners in the top quartile include a healthy and diversified mix of benchmarks and sectors with Utilities (XLU) and Homebuilders (XHB) in the top two spots. Other members of the top quartile include the broad Financials ETF (XLF), EM Equities (VWO), and Industrials (XLI). We see large caps with their tech influence in the top tier with the S&P 500 and NASDAQ and one Mag 7 heavy ETF in Communications Services (XLC) at #3. We found it notable that the Tech ETF (XLK) was in the second quartile and the NASDAQ 100 ETF (QQEW) was in the bottom quartile.
In the bottom ranks, the always-volatile E&P ETF (XOP) struggled YTD, but recent events remind us of why energy will always be in the hunt for a role in portfolios whether it be for dividend cash flow in Midstream (AMLP), for a play on the price of oil/gas (XOP), or for a more balanced diverse exposure to the global cycles in Energy (XLE) that can include some dividend heavy names.
The election will weigh on how to approach the sector with the trade-offs of energy infrastructure seeing green lights (or red lights) for more construction or handicapping supply trends and what that could mean. Drill, drill, drill can also mean oil prices could plunge, plunge, plunge. The election outcome could also determine the return of Russia in a wider scale to the global markets if Trump wins.

We wrap with the LTM asset returns, and the shutout score of 32-0, which makes the political theme of economic Armageddon questionable unless you are in the economics dunce cap room (aka Congress). This time period includes the huge risk rally of Nov-Dec 2023 that also saw a strong duration performance (see Footnotes & Flashbacks: Asset Returns 1-1-24 , Footnotes & Flashbacks: State of Yields 1-1-24).
The LTM period shows 29 of 32 lines in double-digit returns and 23 lines at 20% or higher. We see 11 asset lines at 30% or higher. We see 4 at 40% or higher and Homebuilders at +63%. Apparently, the stock market did not crash. The two worst performers were E&P (XOP) at +5.5% just behind the short duration UST ETF (SHY) at +6.1%.
Contributors
Glenn Reynolds, CFA glenn@macro4micro.com
Kevin Chun, CFA kevin@macro4micro.com
See also:
Mini Market Lookback: Cracking the 300 Line in HY 10-5-24
Payroll Sept 2024: Rushing the Gate 10-4-24 10-4-24
CarMax: Why Do We Watch KMX as a Bellwether? 10-3-24
Credit Returns: Sept YTD and Rolling Months 10-1-24
JOLTS Aug 2024: Openings Up, Hires Down, Layoffs Down, Quits Rate Down 10-1-24
Footnotes & Flashbacks: Credit Markets 9-30-24
Footnotes & Flashbacks: Asset Returns 9-29-24
Footnotes & Flashbacks: State of Yields 9-29-24
Mini Market Lookback: PCE Tailwinds, GDP Holds Serve 9-28-24
State Level Economic Reality Check: Employment, GDP, Personal Income 9-28-24
PCE Prices Aug 2024: Personal Income & Outlays 9-27-24
KB Home: Steady Growth, Slower Motion 9-26-24
Durable Goods Aug 2024: Waiting Game 9-26-24
2Q24 GDP: Final Estimate and Revision Deltas 9-26-24
New Home Sales Aug 2024: Waiting Game on Mortgages or Supply? 9-25-24
Lennar: Bulletproof Credit Despite Margin Squeeze 9-23-24
Mini Market Lookback: FOMC Week 9-21-24
Credit Crib Note: Service Corp International (SCI) 9-19-24
FOMC Action: Preemptive Strike for Payroll? 9-18-24
Home Starts Aug 2024: Mortgage Rates to Kickstart Hopes Ahead? 9-18-24
Retail Sales: Down to the Wire? 9-17-24
Credit Crib Note: United Rentals (URI) 9-16-24
Industrial Production: Aug 2024 Capacity Utilization 9-17-24
Consumer Sentiment: Inflation Optimism? Split Moods 9-13-24
CPI Aug 2024: Steady Trend Supports Mandate Shift 9-11-24