
Mini Market Lookback: Cracking the 300 Line in HY
After a dull prior week, the payroll report brought a rebound in fundamental risk but more duration pain.


The wild finish is always the risky part…
After a scare with a port strike running alongside Middle East escalation, the markets ended up with a very strong week as the Longshoremen struck an interim deal on wages (automation battles still ahead), Iran retaliation handicapping brought a mini-spike in oil, and the election countdown continues with its wide gap in policy risk.
Friday payroll won the day across a mix of big moving parts as fundamental risk rallied and credit spreads raced tighter as JOLTS also increased confidence (see Payroll Sept 2024: Rushing the Gate10 10-4-24, JOLTS Aug 2024: Openings Up, Hires Down, Layoffs Down, Quits Rate Down 10-1-24).
We saw HY index spreads dip below the 300 bps line to +289 bps, and that has not been seen since the end of June 2007 and Dec 1997 in markets that overall were higher risk than today in terms of rating tier mix (see HY Spreads: Celebrating Tumultuous Times at a Credit Peak 6-13-24).
We are a long way from the August volatility spike (see HY Industry Mix: Damage Report 8-7-24) and the earnings season is dead ahead and rolling out in full swing ahead of Election Day.
Duration was hurt by a UST curve bear flattener with the front end rising faster than the long end as the market gets locked in on this coming week’s CPI and PPI releases for fresh confirmation of growth running alongside lower inflation that might squeeze out 2 more +25 bps eases from the Fed in Nov-Dec.

The above chart shows the 1-day move from Friday as the 2Y UST delta almost doubled the 10Y UST delta. Rates are likely to stay busy this week ahead with CPI and PPI teed up and markets looking for more signals that the FOMC will see room to lower “real fed funds” (even though they set their sundial by PCE).

The above chart updates the UST deltas for the full week, and it was not pretty for bond performance. All 7 bond ETFs that we track each week ended up in the red as we break out further below. By the end of the week, Friday piled onto the mortgage rate increase after a modest increase in the Freddie 30Y mortgage benchmark (released on Thursdays).

The above chart updates the 30Y Freddie Mac benchmark vs. the 10Y UST that drives the 30Y rate. We saw a modest move higher on the Freddie 30Y of +4 bps to 6.12% (released on Thursdays at noon). The 10Y UST was addressed earlier and came in at +23 bps on the week. By Friday, the mortgage trade rags we watch were talking about 6.5% levels across a separate range of mortgage 30Y samples.
We are not going to wade into the vagaries of mortgage bucket math and the assumptions that roll up into the quotes, but the market clearly was rattled just as the UST market was at a critical time in the inflation debate (wait until they wade into the real world of tariffs depending on what unfolds in the election and into 2025).

The above chart updates the 1-week returns on the 32 benchmarks and ETFs we monitor as we see a positive-negative score of 14-18 this week, which is one of the weaker ones in a while. We see all 7 bond ETFs in negative range with the long duration 20+ Year UST ETF (TLT) coming in dead last. GOVT is also in the bottom quartile while the other 5 bond ETFs are in the third quartile. The HY ETF (HYG) was the best of the pack on spread contraction, but the adverse UST curve move still carried the day.
Notable losers this week included the Homebuilder ETF (XHB) at second to last and the interest sensitive Consumer Staples (XLP) and Real Estate Equities (XLRE) in the bottom quartile. Those steady, reliable dividend rates don’t look as good if rates trend higher.
The big winner on the week was the Energy sector with E&P (XOP) at #1 with +7.4% and the broader Energy ETF (XLE) at #2 with +6.9%. Midstream (AMLP) was at #5 in the top quartile with EM Equities (VWO) at #3 and the Base Metals ETF (DBB) at #4 as the China stimulus wags those two ETFs.
We also saw Financials (XLF) react well given the direct link to corporate asset quality and provisioning risks if the cycle stays as healthy as this week seemed to indicate. The strong economic releases by state we looked at last week tell a story of breadth (see State Level Economic Reality Check: Employment, GDP, Personal Income 9-28-24).

The above chart updates the Tech bellwether names we track each week with the Mag 7 plus Broadcom and Taiwan Semi detailed against some market cap weighed and equal weight benchmarks. We line them up in descending order of 1-week total returns. We see 3 of the Mag 7 names in positive range with 4 negative including Tesla on the bottom this week.

The above chart frames the recent moves in the HY index OAS since June, and we just hit an eye-opening milestone as Friday closed below +300 bps at +289 bps. That came on a -25 bps tightening on the week and -15 bps tightening on Friday. Where current spreads stand vs. the long-term median tells a story of compression with the horizontal line at +466 bps.

The above chart updates the credit quality compensation differential with the “HY OAS minus IG OAS” level back to +202 bps vs. a long-term median +328 bps. The current level just dropped below the July 2024 lows. We will be out with more detailed Footnotes on credit markets on Monday. Past credit cycle peaks and spread lows for this metric include +203 bps in Dec 2021, +205 bps in Oct 2018, and +228 bps in June 2024. The low of +147 bps to start June 2007 remains in another zip code.
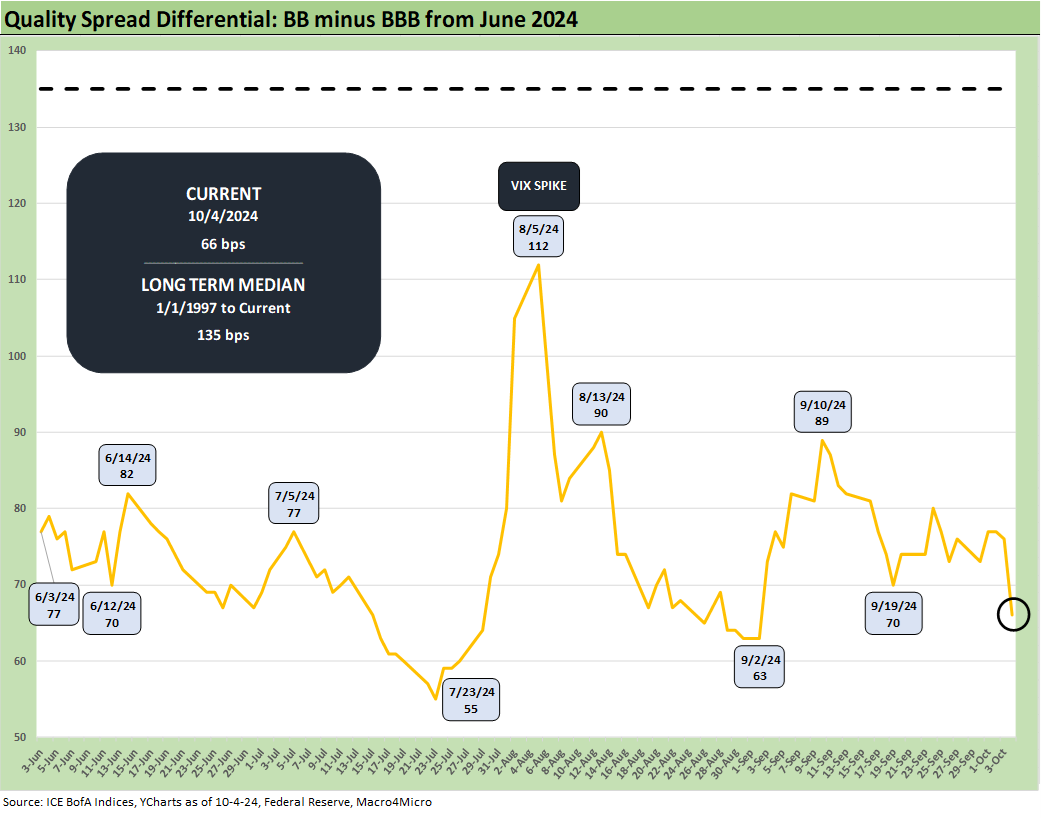
The above chart updates the speculative grade divide differential for “BB OAS minus BBB OAS.” That credit compensation proxy is back to +66 bps vs. the multicycle July low of +55 bps with the long-term median at +135 bps.
Contributors
Glenn Reynolds, CFA glenn@macro4micro.com
Kevin Chun, CFA kevin@macro4micro.com
See also:
Payroll Sept 2024: Rushing the Gate10 10-4-24
Credit Returns: Sept YTD and Rolling Months 10-1-24
JOLTS Aug 2024: Openings Up, Hires Down, Layoffs Down, Quits Rate Down 10-1-24
Footnotes & Flashbacks: Credit Markets 9-30-24
Footnotes & Flashbacks: Asset Returns 9-29-24
Footnotes & Flashbacks: State of Yields 9-29-24
Mini Market Lookback: PCE Tailwinds, GDP Holds Serve 9-28-24
State Level Economic Reality Check: Employment, GDP, Personal Income 9-28-24
PCE Prices Aug 2024: Personal Income & Outlays 9-27-24
KB Home: Steady Growth, Slower Motion 9-26-24
Durable Goods Aug 2024: Waiting Game 9-26-24
2Q24 GDP: Final Estimate and Revision Deltas 9-26-24
New Home Sales Aug 2024: Waiting Game on Mortgages or Supply? 9-25-24
Lennar: Bulletproof Credit Despite Margin Squeeze 9-23-24
Footnotes & Flashbacks: Credit Markets 9-23-24
Footnotes & Flashbacks: State of Yields 9-22-24
Footnotes & Flashbacks: Asset Returns 9-22-24
Mini Market Lookback: FOMC Week 9-21-24
FOMC Action: Preemptive Strike for Payroll? 9-18-24
Home Starts Aug 2024: Mortgage Rates to Kickstart Hopes Ahead? 9-18-24
Retail Sales: Down to the Wire? 9-17-24
Industrial Production: Aug 2024 Capacity Utilization 9-17-24
Consumer Sentiment: Inflation Optimism? Split Moods 9-13-24