
Footnotes & Flashbacks: Credit Markets 10-7-24
The credit markets saw a tumultuous week with the UST curve working against them but credit spreads feeling the joy in HY.


The market has a mixed look… it’s all in the angle…
The compression of HY OAS to levels not seen since June 2007 was notable to end the past week as UST yields rose and optimism on the credit cycle got good news with the payroll headlines.
The ability to duck a major freight crisis at the ports (for now) was a critical reprieve for the macro and micro level risks since the multiplier effects there could be daunting in the new year and especially if such disruptions run alongside a tariff onslaught and debt ceiling battle early in 1Q25.
The bad tasting menu of post-election risk factors also includes the uncertain timing of a retaliatory strike against Iran and increasingly strident and reinvigorated rhetoric around what to do about Iran’s nuclear program.
The risk factor checklist keeps growing in equity and debt broadly with the credit markets narrowly taking the “call me when we get there” approach.
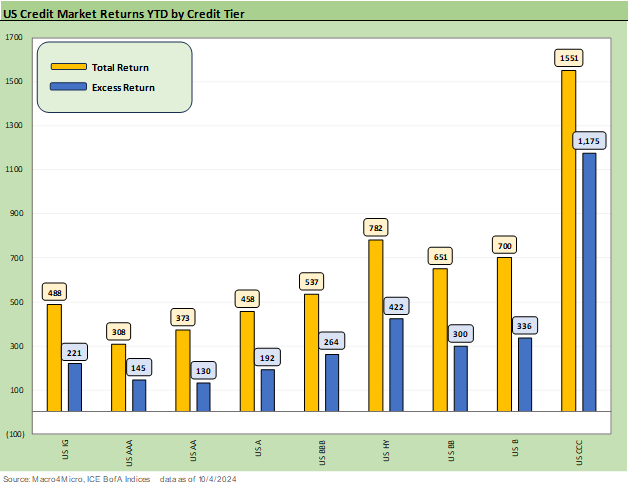
The above chart updates the YTD total return and excess return for IG and HY and the credit tiers. The duration part of the total return equation is now facing some headwinds with the UST pushing back this past week and again today as we go to print.
We looked at the asset return scorecard for the week in a separate Footnotes publication. All the bond ETFs weighed in with negative returns for the week given the UST curve move (see Footnotes & Flashbacks: Asset Returns 10-6-24).
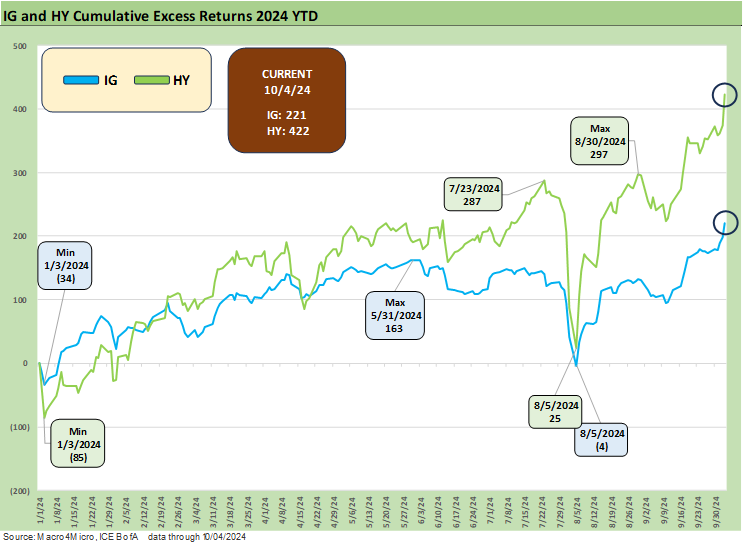
The running excess returns for HY vs. IG has the relationship that it is supposed to have (and often does not) with material incremental credit compensation for moving from the IG basket into the HY basket of credit. As we saw in early August with the VIX spike and sudden sharp move in risk repricing, the relationship can change quickly.

The above chart shows a fairly compressed relationship between the BB and BBB running YTD excess returns, but the relative reward is at least in alignment. The long duration and heavy mix of BBB long bonds can lead to problems in a hurry in the face of a cyclical turn, so the potential volatility is not to be taken lightly in the marginal BBB names with full yield curves.
The market had been getting a taste of BBB spread action with Boeing while the auto cycle is fortunately holding up well despite some narrow issuer challenges in the problems with EV execution. Auto names have had their share of BBB problems in the past. The BBB tier also got a taste in energy back in 2015 and early 2016.

The CCC tier performance has been nothing short of impressive in 2024 as some “mature” (raggedy?) HY issuers worked their way through some distressed exchanges and recaps. The rise of private credit has also reduced the CCC tier’s relative exposure to the historical “late cycle crazy deal flow” risks that have now migrated over into the more controlled, narrower group of private credit investors and deal architects. Whether the term “volatility washing” that some use applies or not, the relative risk profile in CCC tier bonds has been surprisingly resilient.
The CCC tier has comfortably worked through an economic expansion period in a level of the credit tiers that has always been dominated by the “issuer picking” exercises typical of CCCs with that tier’s exponentially higher long-term annual average default risk relative to the B tier. The B and CCC tier have overlapping issuers between the two on capital structure layers.

The above chart updates the IG OAS history for the -5 bps tightening of the past week. We have seen such tight spreads last for protracted periods such as 1997-1998 and 1H04 to 1H07. That said, there is no question that the +87 bps is tight vs. the long-term median of +132 bps. Such high 80s and low 90s levels are not rare.
Outside the asset-class-constrained investors (i.e., “IG only”), the IG play has been for those who are guarded on HY relative value but are happy to take BBB credit risk as “defensive” vs. HY. The medium grade IG tier offers some duration upside in a recession scenario. That has been less than rewarding overall YTD despite the recent duration comeback seen in recent months before Friday’s setbacks.
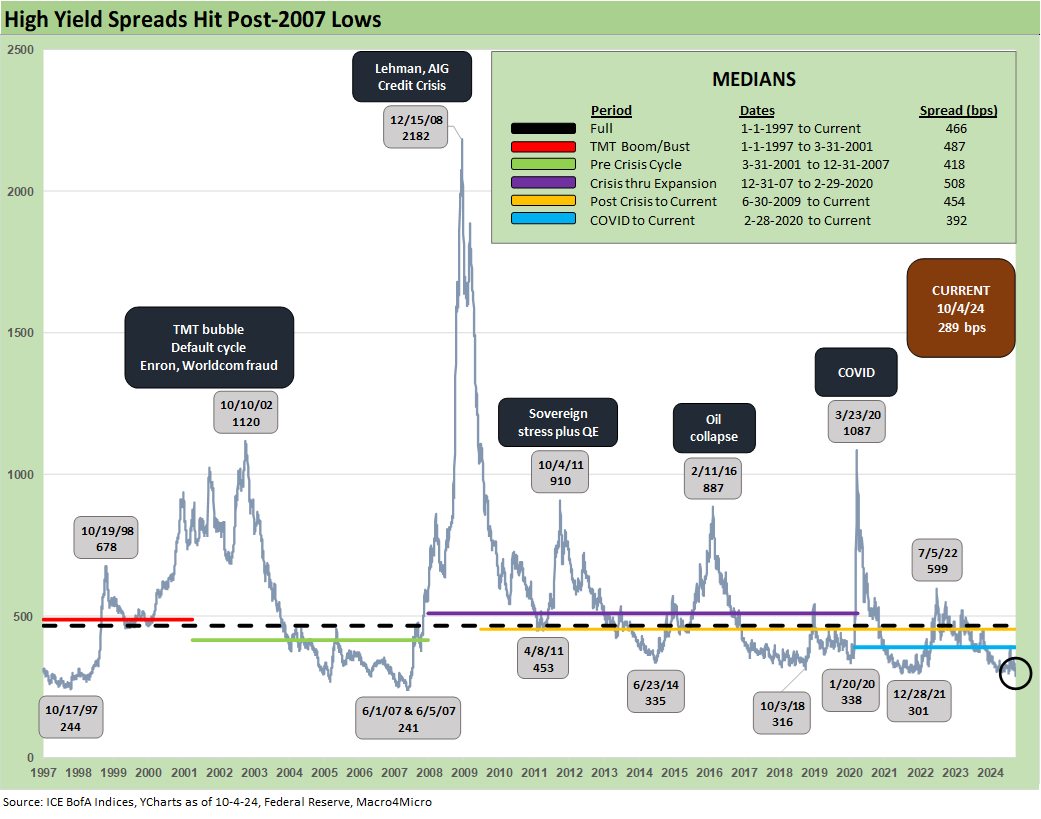
We looked at the HY story in some detail over the weekend in Mini Market Lookback: Cracking the 300 Line in HY (10-5-24), and the +289 bps HY OAS takes us back to June 2007, which saw +289 bps levels later in June 2007 after lows earlier in the month. We also saw +289 bps levels in Dec 1997. The overall deal quality is better now with the heavy BB tier mix in the current index, but a sub-300 bps HY OAS is very rare.

The above chart updates what we use as a “proportionate risk premium” history that frames HY OAS vs. the 5Y UST for a treasury in the general area of HY index duration. It tells the obvious story (tight spreads) but gives some frames of reference across history with a median of 1.96x vs. the current 0.76x. The lows of Oct 2018 hit 1.05x while the early June 2007 lows reached 0.49x and 1997 lows of 0.39x.
The historical lookback helps for perspective, but it will get back to the relative risk and relative value assessment exercise. We have a hard time with the overall risk-reward dynamics given the laundry list the market faces that we regularly cover that are not priced in (tariffs, geopolitics, and domestic turmoil high on the list and very tough to quantify).

The above incremental yield and relative yield ratio is another angle on a theme similar to the HY OAS/5Y UST in the prior chart. We see 1.86x currently, which is well below the 2.91x long-term median from 1997.

The above chart updates the “HY OAS minus IG OAS” quality spread differential as a proxy for relative credit compensation. The +202 bps is well inside the long-term median of +328 bps. Current levels are similar to the Dec 2021 lows and Oct 2018 lows. June 2007 was a classic bubble when held up against the relative quality mix at the time.

The current BB tier OAS charted above at +176 bps has broken through the lows of Jan 2022, Jan 2020, Oct 2018, and June 2014. The BB OAS level is near the late May and early June 2007 lows of +171 bps. That clearly set a bar for what “compressed” means. Aug 1997 was +136 bps, so that is in another pocket of the universe in a much smaller BB tier market at the time.

The “BB OAS minus BBB OAS” quality spread differential is at +66 bps, which is above the July 2024 lows of +55 but in the area of the lows of Dec 2019 and Oct 2018. The early June 2007 lows of +53 bps was a multicycle low.

The B tier compression has been the most impressive since 2007 as the B tier to end last week was +286 bps or just wide to the July 2024 lows. Those 2024 lows are inside the post-crisis HY credit cycle B tier lows detailed along the chart timeline, but June 2007 still carries the crown at +236 bps. The 1997 credit cycle peak for US HY saw +292 bps in June 1997.

The above chart plots the timeline of the B tier OAS and CCC tier OAS with its disconnects and convergences along the timeline. As we have covered in past commentaries, the CCC tier can march to its own beat and goes through many constituent distortions along the way with the drop-ins and dropouts and an array of recaps and distressed exchanges (see The B vs. CCC Battle: Tough Neighborhood, Rough Players 7-7-24).

The above chart shortens up the timeline for better visuals and a more granular look at the recent swings in composite tier OAS for the B and CCC tiers. The CCC tier has been swinging around both in spread compression as well as being wagged by constituent mix and balance sheet actions. That is a drill-down exercise beyond this current piece.

The above chart plots the long-term OAS differential across the B to CCC tier. We see past credit cycle peaks well inside the current B vs. CCC OAS differential. The credit cycles have seen differentials with +200 bps handles numerous times but with the June 2007 level at +172 bps. The past credit cycle lows are materially inside the current +499 bps.
We looked at this relationship in past commentaries citing some dollar price differentials rather than OAS bps from bygone days. The dollar prices are more intuitive around the “equity-like” risks in down markets. The CCC tier can turn bonds into high-risk equities very quickly subject to risk pricing overall, special situation developments, or turns in the default cycles.
Excerpt from past commentary:
“The CCC tier hit a 42.9 dollar price low in Oct 2001 after the CCC YTW hit 28% in late Sept 2001. The ‘B minus CCC’ dollar price differential soared to 43.5 (Jan 2002), which was wider than the later credit crisis at 31.9 (Feb 2009). For the B to CCC differential, the difference in the credit crisis in late 2008/early 2009 was that everything plunged in price.”

The above chart shortens up the timeline to detail the recent swings as the CCC tier goes through a recent material compression. The CCC OAS minus B tier OAS differential is down to +499 bps or near the long-term median of +484 bps.
A look at yields…
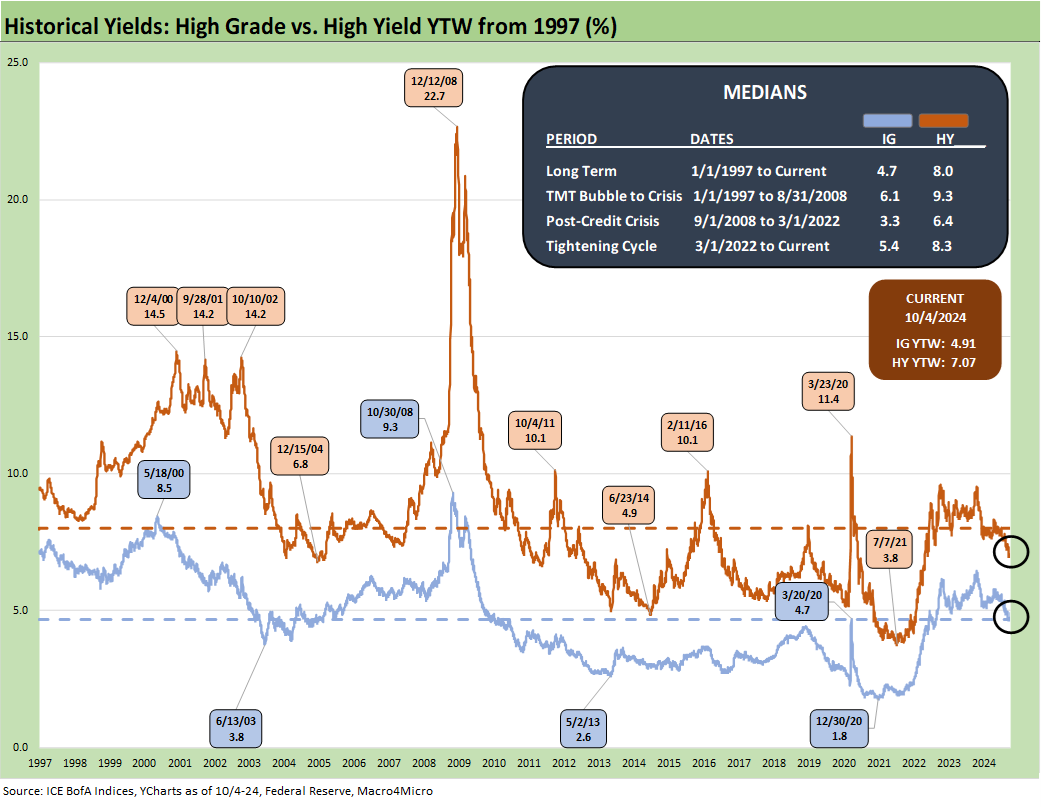
The above chart updates the long-term YTW time series and select medians for IG YTW vs. HY YTW. The distortions of post-crisis ZIRP and slow (and thwarted) normalization periods now over after the tightening cycle. The new easing cycle is now upon us, so the pre-crisis cycle (before Aug 2008) of 6.1% for IG YTW and 9.3% for HY YTW are the most relevant frames of reference. We are now in a tight spread and low UST environment (see Footnotes & Flashbacks: State of Yields 10-6-24). The explanation is not hard to come up with for only 4.9% YTW in IG and 7.1% in HY YTW.

The above chart updates the IG index YTW on the horizontal lines for last week and the credit peaks of June 2007 and late 1997. We also plot the UST curves for those dates. The low yields are not hard to explain with UST near all time “normal Fed cycle” lows and low spreads in a credit cycle peak.

The above chart does the same exercise for HY that we do for IG. The 7.07% yield comes at a 96+ dollar price and 6.3% weighted average coupon. The cash flow dynamics are tricky until more refi and extension gets done at higher spreads.
Contributors:
Glenn Reynolds, CFA glenn@macro4micro.com
Kevin Chun, CFA kevin@macro4micrco.com
See also:
Footnotes & Flashbacks: State of Yields 10-6-24
Footnotes & Flashbacks: Asset Returns 10-6-24
Mini Market Lookback: Cracking the 300 Line in HY 10-5-24
Payroll Sept 2024: Rushing the Gate 10-4-24
CarMax: Why Do We Watch KMX as a Bellwether? 10-3-24
Credit Returns: Sept YTD and Rolling Months 10-1-24
JOLTS Aug 2024: Openings Up, Hires Down, Layoffs Down, Quits Rate Down 10-1-24
Footnotes & Flashbacks: Credit Markets 9-30-24
Footnotes & Flashbacks: Asset Returns 9-29-24
Footnotes & Flashbacks: State of Yields 9-29-24
Mini Market Lookback: PCE Tailwinds, GDP Holds Serve 9-28-24
State Level Economic Reality Check: Employment, GDP, Personal Income 9-28-24
PCE Prices Aug 2024: Personal Income & Outlays 9-27-24
KB Home: Steady Growth, Slower Motion 9-26-24
Durable Goods Aug 2024: Waiting Game 9-26-24
2Q24 GDP: Final Estimate and Revision Deltas 9-26-24
New Home Sales Aug 2024: Waiting Game on Mortgages or Supply? 9-25-24
Lennar: Bulletproof Credit Despite Margin Squeeze 9-23-24
Mini Market Lookback: FOMC Week 9-21-24
Credit Crib Note: Service Corp International (SCI) 9-19-24
FOMC Action: Preemptive Strike for Payroll? 9-18-24
Home Starts Aug 2024: Mortgage Rates to Kickstart Hopes Ahead? 9-18-24
Retail Sales: Down to the Wire? 9-17-24
Credit Crib Note: United Rentals (URI) 9-16-24
Industrial Production: Aug 2024 Capacity Utilization 9-17-24
Consumer Sentiment: Inflation Optimism? Split Moods 9-13-24
CPI Aug 2024: Steady Trend Supports Mandate Shift 9-11-24
 |
|