
Existing Homes Sales Aug 2024: Mortgages Still Rule
Prices ticked down from records and MoM EHS declined with inventory not normalized yet and affordability stretched.


Those are the guys with 3% mortgages…
Inventories are higher (+0.7%) but still short of normal levels while prices are up (+3.1%) YoY for the 14th consecutive month even if down from the record levels of July 2024.
The affordability relief of lower mortgages has been moving in the right direction in recent weeks, but it is hardly a foregone conclusion that will continue with the 10Y UST higher on “Fed Day” as well as today as we go to print (see FOMC Action: Preemptive Strike for Payroll? 9-18-24, Footnotes & Flashbacks: State of Yields 9-15-24).
For August, the YoY decline in total existing home sales was -4.2% and down -2.5% sequentially from July.
The trend line in existing home sales shows the 3 price tiers below $500K lower in volumes and the 3 price tiers higher than $500K higher in volume with the important $250K to $500K tier (44% of total sales) down by -3.0%.

The above chart updates the time series on sales volume deltas by price tier. We look at the current mix in more detail in a chart further below. The trend is clear enough in that higher price tiers are rising and lower-price tiers still struggling.
Well-heeled buyers have an easier time looking past the “locked-in effect” on current mortgages and many can plan on making a move and then consider refinancing later in a friendlier rate backdrop if that does come to pass. Many others with 4% and 3% handle mortgages have put tapping the positive home equity on hold whether for the cash or for a move.

The above chart offers a reminder on the geographic mix of existing home sales volumes with some details on the price mix by region (as defined by the Census). As we covered in our earlier commentary on the Harris Housing plan, the South rules in the new and existing single family business (see Harris Housing Plan: The South’s Gonna Do It Again!? 8-28-24).

The above chart updates the run rate on inventories as those rise sequentially to 1.35 million units. That clearly remains well below historical medians as noted in the chart. That helps keep Homebuilder ASPs strong with the relative lack of alternatives and existing home prices rising.

The above chart updates the time series for existing home sales and new home sales and the relative scale. We update the rising share being taken by new home sales with the “new home sales” August release next week. The simple point is that existing home sales dominate total home sales. That said, the decline in existing home sales vs. long term medians is stunning in magnitude as noted in the median box vs. current levels (5.25 million vs. 3.86 million). Meanwhile, the new home sales are well above medians.
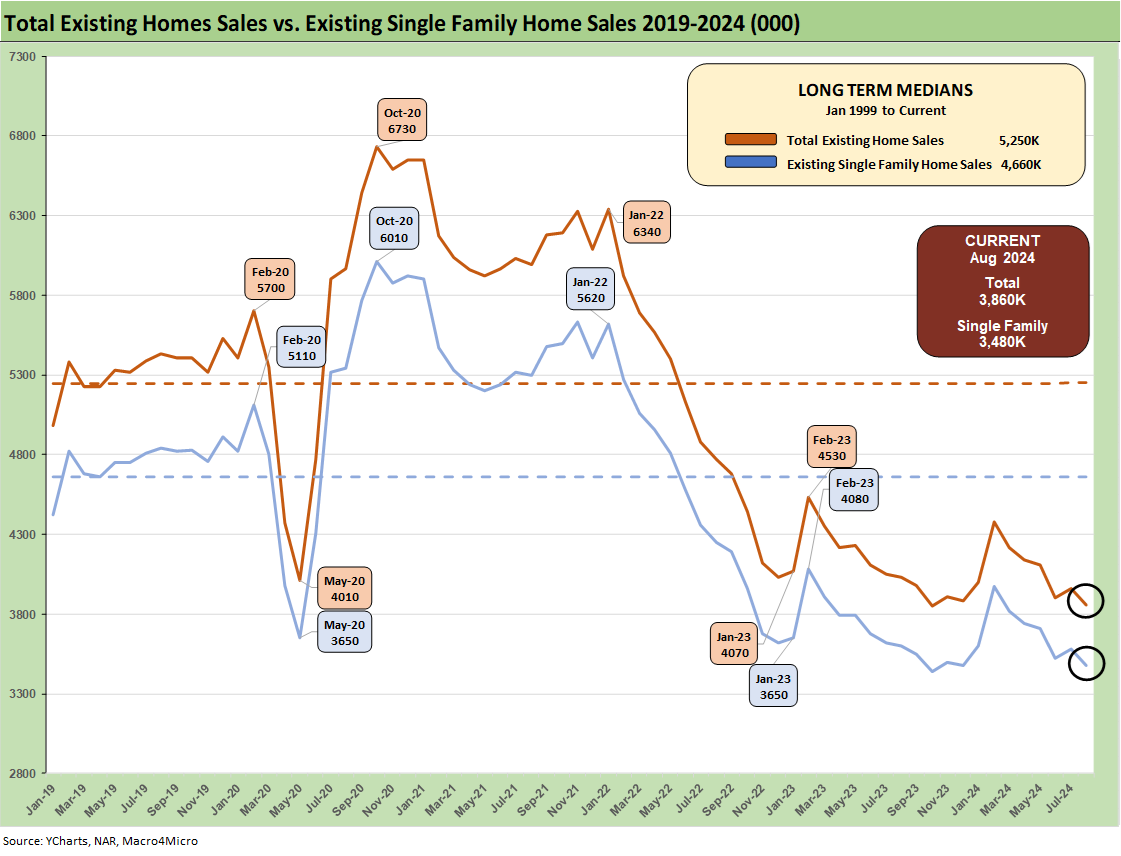
The above chart breaks out the timeline for single family alone of 3.48 million vs. total existing home sales of 3.86 million, which is well below the long-term median (from Jan 1999) of 5.25 million for total existing homes. The lower line is ex-condo/ex-co-ops. We saw 380K in condos and co-ops in July, flat to 380K in July 2024.

The above chart updates the median price for existing single family homes at $422.1K. That is well above the $308K back in Jan 2021 when mortgage rates were near record lows. Higher mortgage rates and near record prices were the double whammy, but mortgage rates heavily drive the monthly payment burden.

The above chart updates the monthly existing home sales across the timeline from Jan 2021 through August 2024. The market is a long way from the 6 million and high 5 million handles of 2021 and then into early 2022 when many homeowners refinanced and new buyers locked in low mortgages. ZIRP ended in March 2022 and then the UST migration began.
The August 2024 total of 3.88 million is below the May 2020 COVID trough of 4.07 although we had a few more sub-4 million handles along the way as noted in the chart.
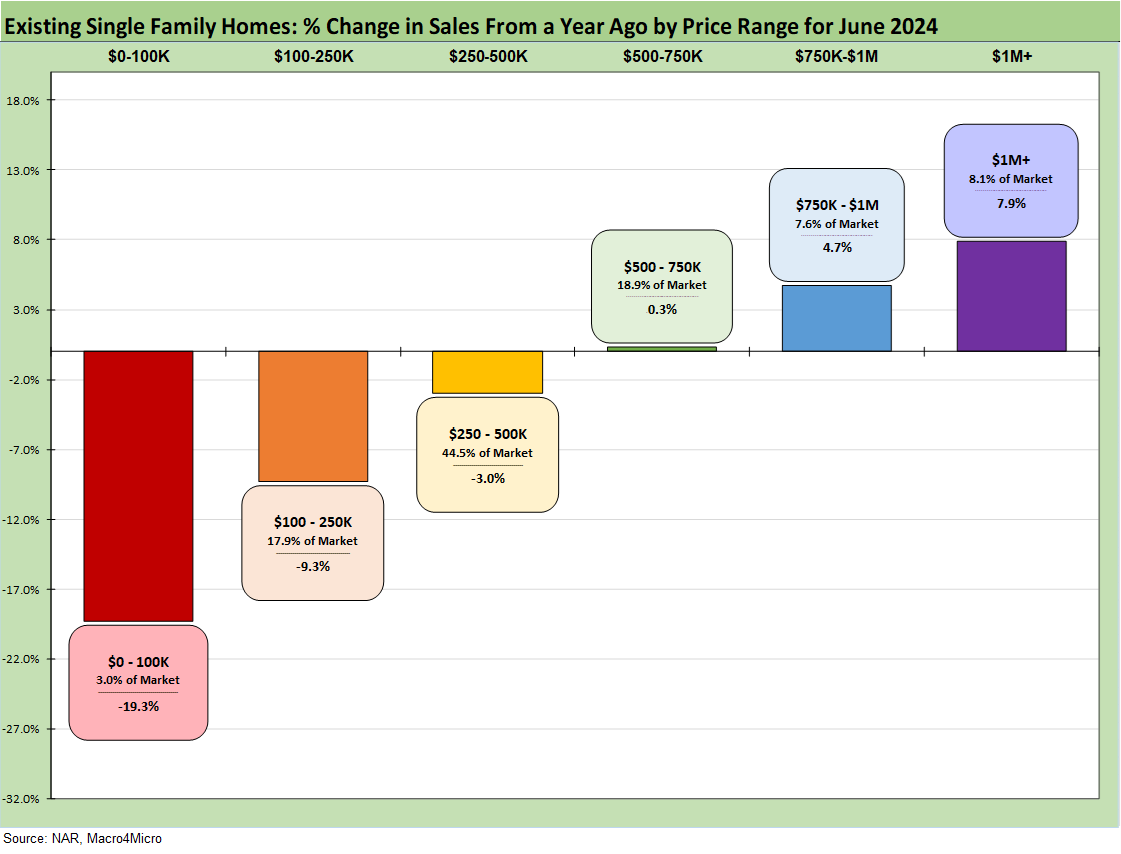
The above chart details the sales deltas in the price tiers as lower price tiers are buffeted by affordability headwinds and “barriers to exit.”
See also:
For housing:
Home Starts Aug 2024: Mortgage Rates to Kickstart Hopes Ahead? 9-18-24
Harris Housing Plan: The South’s Gonna Do It Again!? 8-28-24
New Home Sales July 2024: To Get by with a Little Help from My Feds? 8-25-24
Existing Home Sales July 2024: Making a Move? 8-23-24
Housing Starts July 2024: The Working Capital “Prevent Defense” 8-16-24
Credit Crib Note: PulteGroup (PHM) 8-11-24
Credit Crib Note: D.R. Horton (DHI) 8-8-24
New Homes Sales June 2024: Half Time? Waiting for Mortgage Trends 7-24-24
Existing Home Sales June 2024: Supply Up, Prices Up, Volumes Down 7-23-24
Housing Starts June 2024: Still All About the Deliveries 7-17-24
Homebuilder Equities: “Morning After” on Rate Optimism 7-12-24
Homebuilders: Equity Performance and Size Rankings 7-11-24
Credit Crib Note: KB Home 7-9-24
Lennar: Key Metrics Still Tell a Positive Macro Story 6-20-24
Credit Crib Note: NVR, Inc. 5-28-24
Toll Brothers: A Rising Tide Lifts Big Boats 5-23-24
Credit Crib Note: Taylor Morrison 5-20-24
Recent market related:
FOMC Action: Preemptive Strike for Payroll? 9-18-24
Footnotes & Flashbacks: Credit Markets 9-16-24
Footnotes & Flashbacks: State of Yields 9-15-24
Footnotes & Flashbacks: Asset Returns 9-15-24
A Strange Policy Risk Week: Mini Market Lookback 9-14-24
Consumer Sentiment: Inflation Optimism? Split Moods 9-13-24
CPI Aug 2024: Steady Trend Supports Mandate Shift 9-11-24
Facts Matter: China Syndrome on Trade 9-10-24
Tariffs: Questions that Won’t Get Asked by Debate Moderators 9-10-24
August 2024 Payrolls: Slow Burn, Negative Revisions 9-6-24
Construction Spending: A Brief Pause? 9-3-24