
Footnotes & Flashbacks: Asset Returns 9-29-24
We look at asset returns in a tame week where bonds were soft, China talked big stimulus and energy stayed under pressure.


It seems safe enough in here…
The week was uneventful from the standpoint of the UST curve shapeshifting and any material changes in inflation sentiment with the PCE release and China stimulus headlines.
Bonds underperformed, the tech bellwethers were mixed, and oil seemed more worried about Saudi supply risk than charged up by China bullishness that fueled metals.
Homebuilders stayed solid with a few bellwethers reporting this past week (Lennar, KB Home) that signaled the housing sector was looking at steady performance with mortgages hitting two-year lows despite a stubborn 10Y UST.
This week brings JOLTS and the Sept payroll data with employment now supplanting the PCE and CPI releases as the new “go to” data points for the month (at least for now).

The above chart updates the high-level benchmarks for debt and equity that we watch each week. There is an abundance of good return lines in there and not much to bemoan in debt with 1% handles for 1-month and 3 months returns biased toward the 5% range. We see 1-year debt returns running ahead of the long-term nominal returns on the equity asset class with the Nov-Dec 2023 rally combining with the recent favorable UST curve moves in 2024 to even get the UST index above the +10% line for LTM period.
Equities have been the bigger asset return story despite the volatility bouts with the small caps making a strong comeback over the trailing 3 months and beating out the mixed Tech performance. Looking back YTD, NASDAQ and the S&P 500 are still the big winners.

The above chart updates the 1500 and 3000 series with Energy still the only laggard. Real Estate has been the comeback story beyond the favorable UST shift with a +17% range over 3 months. Income equities are having their day again with speculation around where cash gets deployed serving as a regular talking heads exercise with 3M UST yields in fade mode. Those seeking income will need to go somewhere.
The rolling return visual
In the next section, we get into the details of the 32 ETFs and benchmarks for a mix of the trailing periods. Below we offer a condensed 4-chart view for an easy visual on how the mix of positive vs. negative returns shape up. This is a useful exercise we do each week looking for signals across industry groups and asset classes. We also have a YTD version that we include in the broader commentary on the time horizons further below.
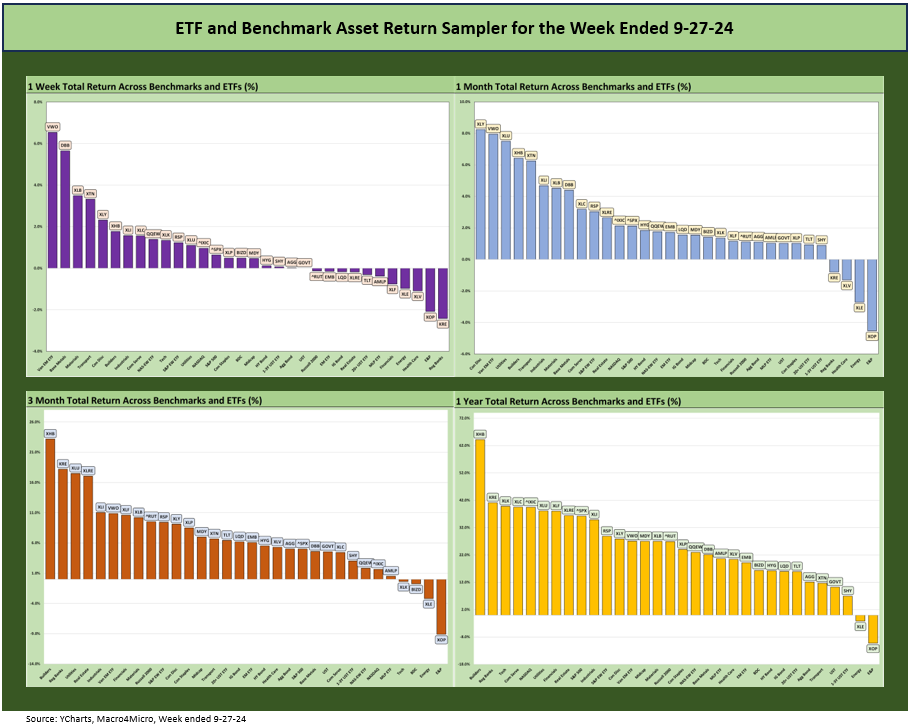
The above chart mix shows the heavy bias toward positive across various time horizons with the 1-week period having a more mixed profile at 21-11, but the 3-months, YTD (not shown), and 1-year horizons underscore a strong period for duration, equities, and credit risk.
The Magnificent 7 heavy ETFs…
Some of the benchmarks and industry ETFs we include have issuer concentration elements that leave them wagged by a few names. When looking across some of the bellwether industry and subsector ETFs in the rankings, it is good to keep in mind which narrow ETFs (vs. broad market benchmarks) get wagged more by the “Magnificent 7” including Consumer Discretionary (XLY) with Amazon and Tesla, Tech (XLK) with Microsoft, Apple, and NVIDIA, and Communications Services (XLC) with Alphabet and Meta.
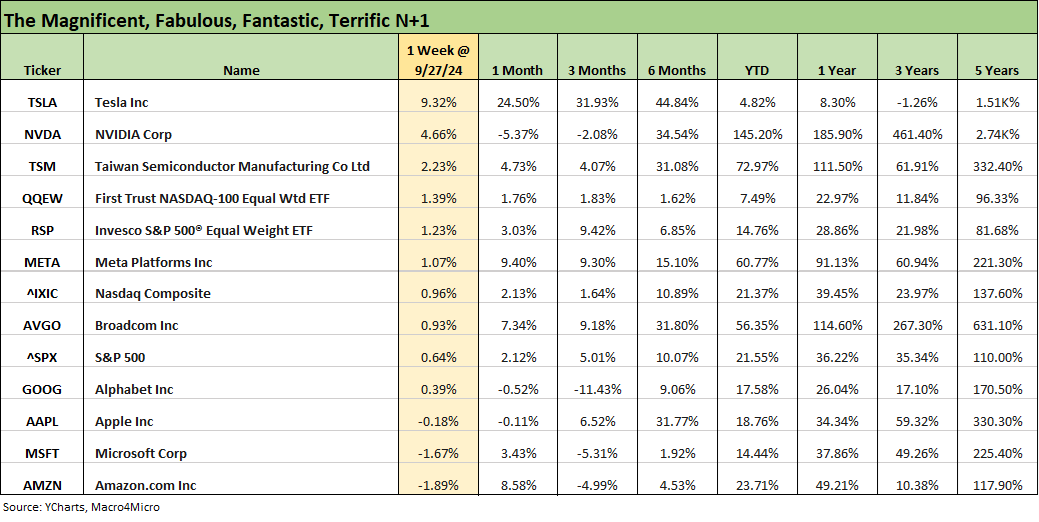
We looked at the Tech bellwether results in our earlier Mini Lookback (see Mini Market Lookback: PCE Tailwinds, GDP Holds Serve 9-28-24). Tesla and NVIDIA had big weeks with Tesla still posting up the weakest performance YTD of the Mag 7. TSLA was the only Mag 7 name in single digits YTD and 1 year and the only name in negative range over the trailing 3 years.

The 1-week data was also already discussed in Mini Market Lookback: PCE Tailwinds, GDP Holds Serve with a score of 21-11. The leadership ranks were taken by EM Equity ETF (VWO) and Base Metals ETF (DBB) on the aggressive China stimulus headlines which also fed into Materials (XLB).
On the low end, we see Energy on the bottom again as Saudi supply worries trumped China excitement. We see 3 bond ETFs in the red with the long duration 20+ Year UST ETF (TLT) on the bottom. The other 4 bond ETFs are only slightly ahead in minimal positive return range.
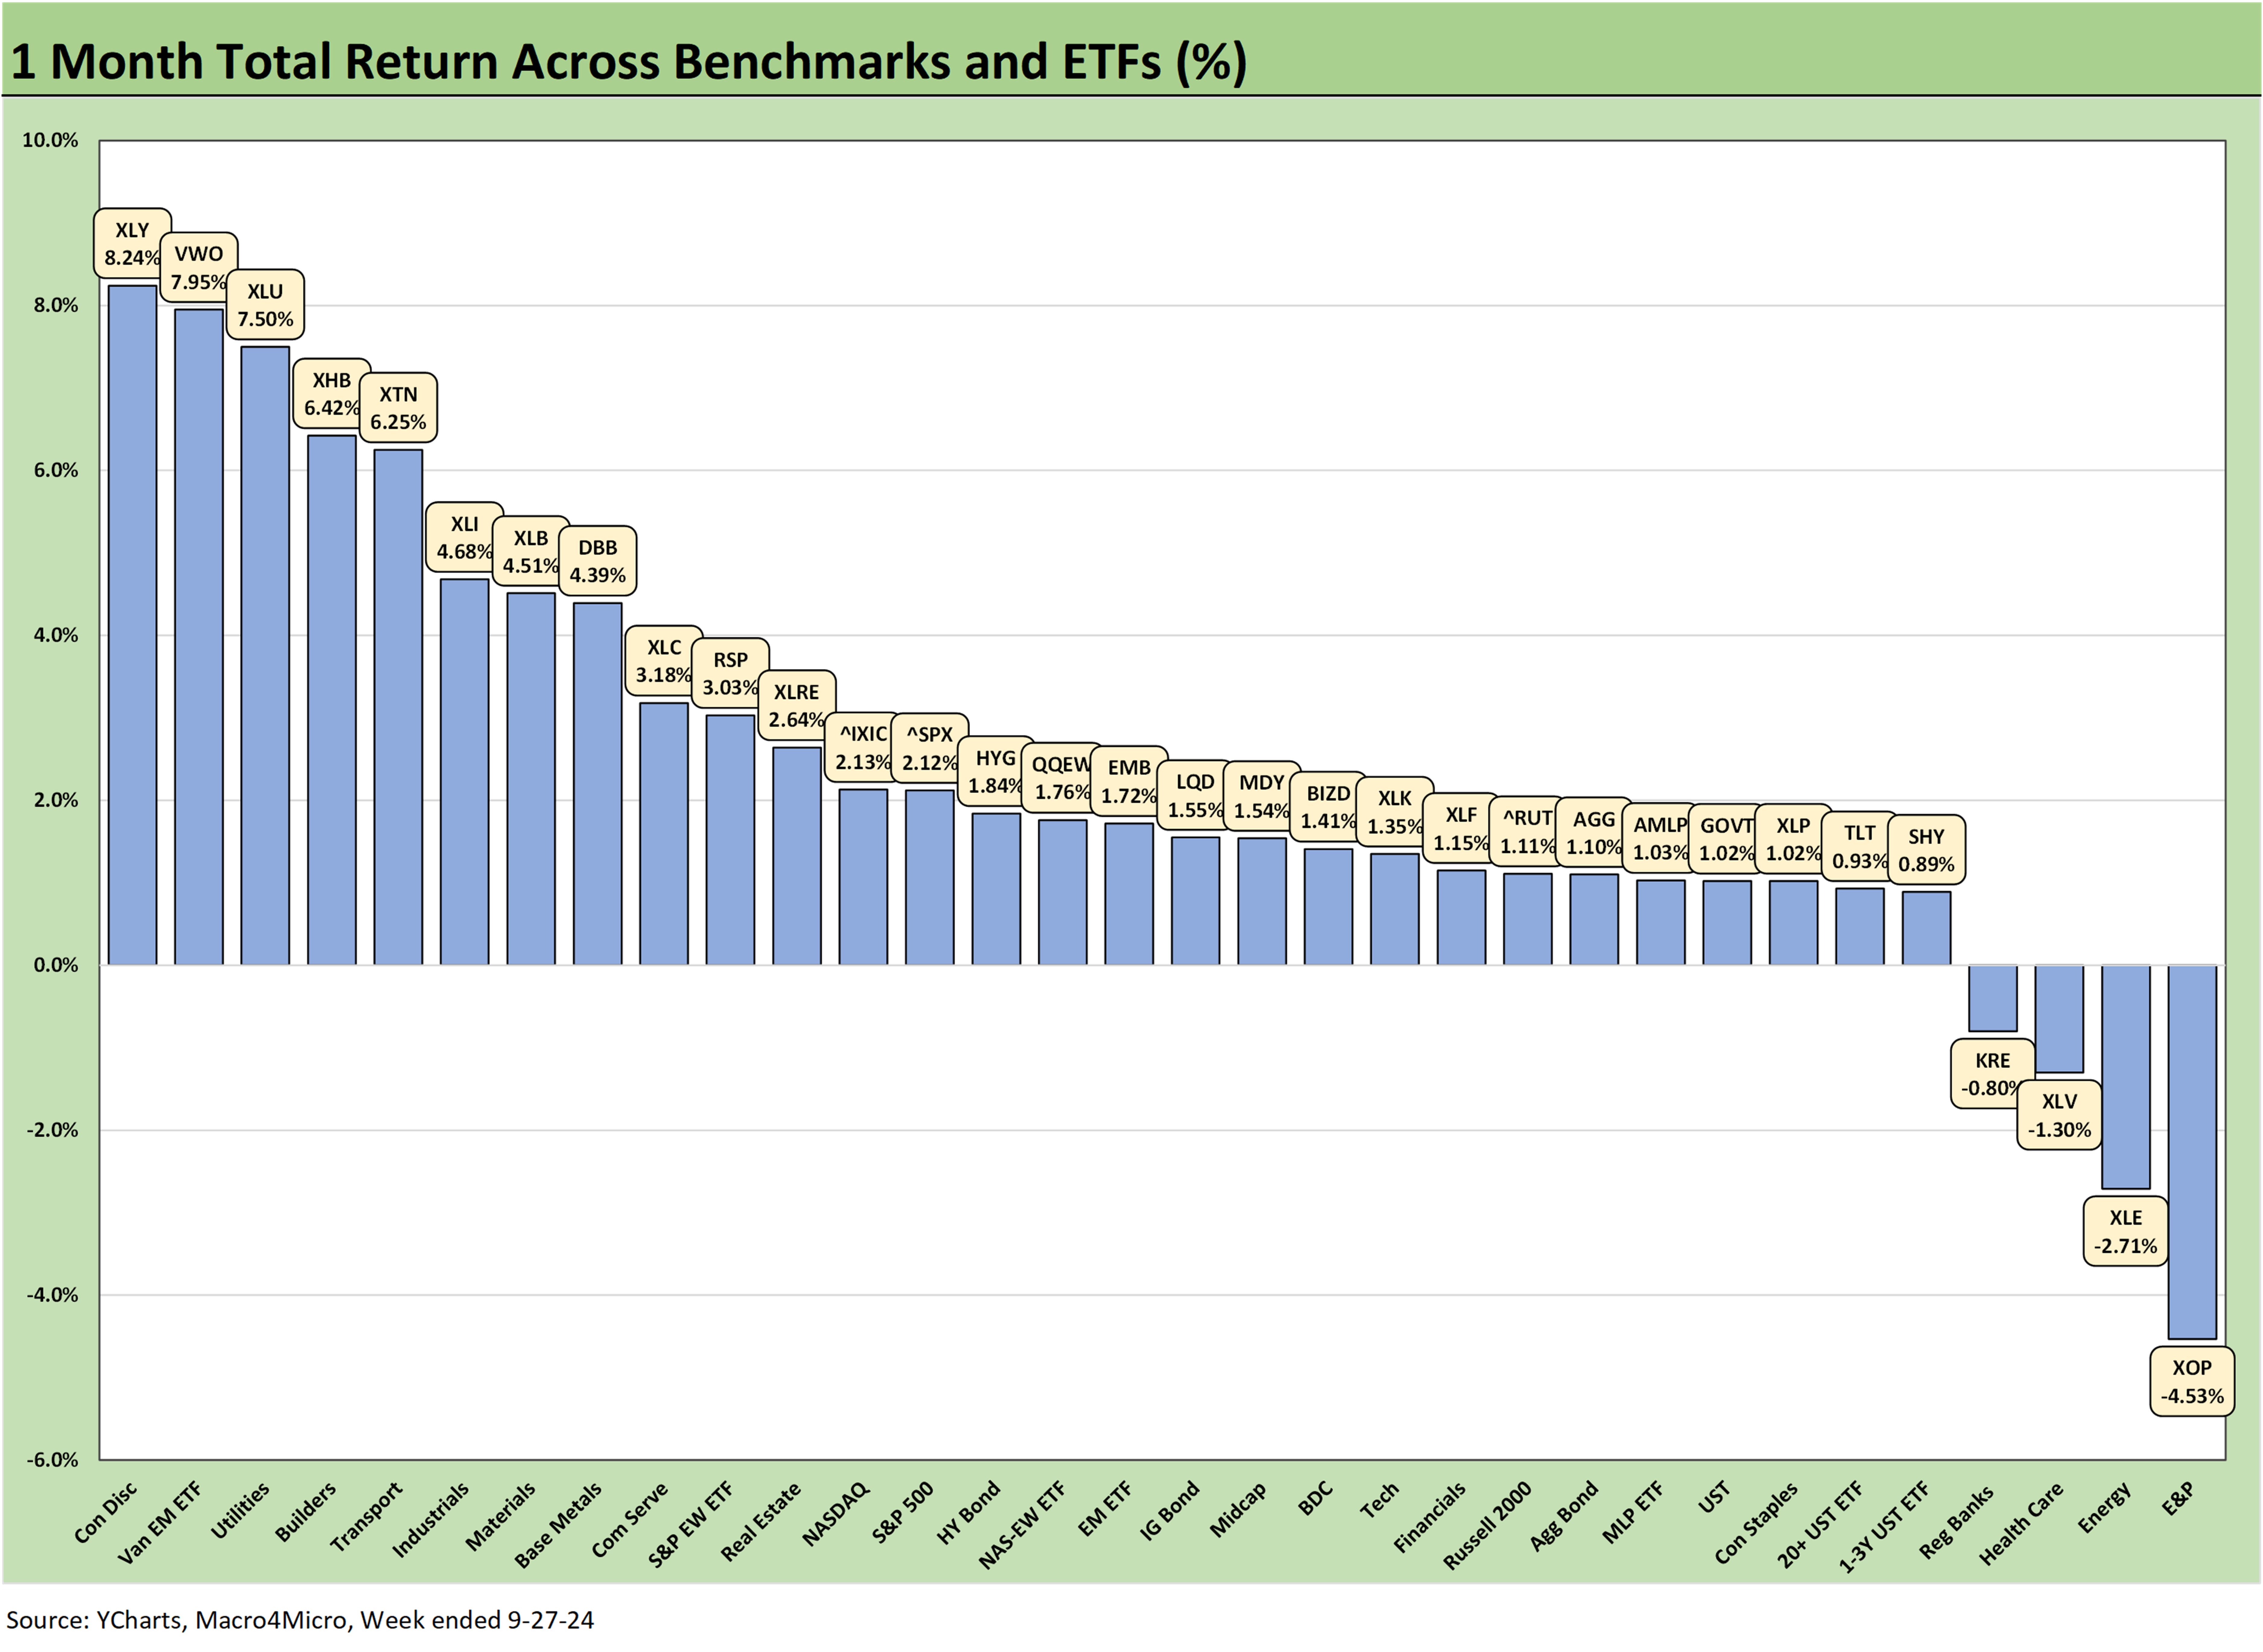
The 1-month returns are solid at 28-4 with E&P (XOP) and Energy (XLE) on the bottom and KRE doing a fade this week. On the high end for the month, Consumer Discretionary rides the Tesla rebound and decent Amazon numbers. VWO rode the China connection and stimulus while Utilities (XLU) and Homebuilders (XHB) are scoring on both fundamentals and interest rate sensitivity.
For cyclical reassurance, we see Transports (XTN), Industrials (XLI), Materials (XLB), and Base Metals (DBB), but that comes with the asterisk of global demand and not just the US cycle. China always weighs heavily. The cyclical and China X-factor will get tested soon enough on tariff policy.
Bond ETFs are all positive but spread across the second, third, and bottom quartiles with HYG on top and TLT at #6 of the 7 ETFs and SHY just below TLT on the bottom.

For 3 months, we see a very respectable score of 28-4 with the entire top quartile in double digit returns. The 3-month leaders have the interest rate factor very much in evidence with Homebuilders (XHB) well out in front with Regional Banks (KRE) and Utilities (XLU) and Real Estate (XLRE) with strong double-digit gains along with the Industrial ETF (XLI), Financials (XLF) and Materials (XLB). EM Equities (VWO) rounds out the top quartile for 3 months.
The 4 negatives include the two main energy laggards who have been feeling oil prices in E&P (XOP) and diversified Energy (XLE). The BDC ETF (BIZD) was also in the red along with the Tech ETF (XLK) as some Mag 7 constituents (4 of 7) were in the red on that stretch including 2 of the 3 in XLK.

The YTD returns weighed in at 30-2 with only E&P (XOP) and Transports (XTN) slightly in the red. We see 19 of 32 line items with double digit returns and another handful (5) running at annualized double digit return rates. This is a very solid performance in terms of breadth as the broad market benchmarks get a lot of attention for headline index records.
Bond ETFs are clustered in the bottom two quartiles, but EM Sovereign ETF (EMB) and HY (HYG) are running at annualized run rates that would hit equity returns if they get a bit of UST curve support in the home stretch (plus their accrued coupon).
That is a good year with headlines around the election still to be navigated. The market still faces the challenge of what risks will need to be factored in after that result (in theory) is settled give the mix across the White House, Senate, and House.

The 1-year returns post a 30-2 score with higher returns generated by the very strong finish to 2023 from the Nov-Dec 2023 bond and risk rally. The only two in negative range are E&P (XOP) and Energy (XLE). We see 29 of the 32 in double-digit returns and 21 lines above a 20% return, 10 above 30%, and Homebuilders ETF (XHB) ringing the bell at +64.2%.
See also:
Footnotes & Flashbacks: State of Yields 9-29-24
Mini Market Lookback: PCE Tailwinds, GDP Holds Serve 9-28-24
State Level Economic Reality Check: Employment, GDP, Personal Income 9-28-24
PCE Prices Aug 2024: Personal Income & Outlays 9-27-24
KB Home: Steady Growth, Slower Motion 9-26-24
Durable Goods Aug 2024: Waiting Game 9-26-24
2Q24 GDP: Final Estimate and Revision Deltas 9-26-24
New Home Sales Aug 2024: Waiting Game on Mortgages or Supply? 9-25-24
Lennar: Bulletproof Credit Despite Margin Squeeze 9-23-24
Footnotes & Flashbacks: Credit Markets 9-23-24
Footnotes & Flashbacks: State of Yields 9-22-24
Footnotes & Flashbacks: Asset Returns 9-22-24
Mini Market Lookback: FOMC Week 9-21-24
FOMC Action: Preemptive Strike for Payroll? 9-18-24
Home Starts Aug 2024: Mortgage Rates to Kickstart Hopes Ahead? 9-18-24
Retail Sales: Down to the Wire? 9-17-24
Industrial Production: Aug 2024 Capacity Utilization 9-17-24
Consumer Sentiment: Inflation Optimism? Split Moods 9-13-24