
Footnotes & Flashbacks: Asset Returns 10-12-24
We update another steady week for equity returns with some new records and a replay of duration pressure on bonds.


The fears of a bogus journey after election are still repressed…
Another record S&P 500 before and after the mixed CPI numbers did not derail a week staring at a countdown to Election Day and Israel “Retaliation Day” with the uncertain but inevitable reaction of oil prices.
Bond ETFs weighed in with 6 of 7 negative on the week as the long duration UST (TLT) was in dead last with only the short UST ETF 1Y to 3Y (SHY) barely across the positive line.
The start of big bank earnings brought some important reassurance on the relative health of the larger corporate and consumer loans relative to expectations with both JPM and WFC posting a solid stock rally.
The next two weeks will be a blitz of financial color from big banks to regionals to consumer lenders, so the inputs will keep on coming with next week also bringing Retail Sales and Industrial Production.

The above chart updates the high-level debt and equity benchmarks we monitor, and debt has been doing a fade while equities keep seeing solid if mixed numbers. Record highs mixed in with macro event risk anxiety has been the headline flavor, and JP Morgan’s earnings call mixed in good news at sea level with some fears of the wide range of outcomes if geopolitics and trade go wrong.
The recent duration struggles are evident in the trailing 1-month numbers for the UST index and the longer duration IG corporate index. High Yield and Agg are barely positive for the month. As we detail below in the benchmark and ETF section, we see 5 of the 7 bond ETFs in the bottom quartile with 6 of 7 in negative return range for the trailing 1-month period.
After the big payroll surprise, the bear and bull flattener vs. steepener lingo took over the discussions with a bear flattener being the initial reaction. That was followed by a bear steepener this week. The 2Y had initially moved more sharply and the 10Y moved higher but had already been stubborn before that headline.
We will address the UST curve action in our separate Footnotes publication on yields, but the relatively good news seen in the summer and early fall for bond returns is now backsliding as we approach the 1-year anniversary of the peak 10Y UST just below 5% (on 10-19-23).
Equity benchmarks have held in well as the S&P 500 and Dow hit new all-time highs this past week. The benchmark returns in equities are in a tight range for the month, but the Russell 2000 edged into the lead for the1-month period in a nice vote for cyclical breadth and US-centric optimism.
For the broad market S&P 500, this past week brings the count of record highs to around 45 all-time highs this year after hitting around 77 record highs in 2021. The 5-week streak of positive returns in the face of geopolitical risk and extreme post-election policy uncertainty has bears detailing all the ways that this peak could get ugly in a hurry. For the 1-week period, large caps, midcaps, and small caps all ended the week in positive range.
We also hear a lot of commentary that there is not much of an election trade theme to craft yet with so much ambiguity and noise and given the glaring differences in policies – that is, where the policies even exist. Given the Trump fixation on stock records, you would think the mainstream media would be asking about that more (the prevailing theory is they’re afraid to ask).
The health of the market across the past year has been very impressive. The political media seems as inarticulate on the topic as Trump and Biden, and Harris has been slow to cite the financial markets much. That is a missed opportunity to shine some light on what unfolded in 2018 and 2019 (see HY Pain: A 2018 Lookback to Ponder 8-3-24, Histories: Asset Return Journey from 2016 to 2023 1-21-24).
Recent weeks have highlighted how the modest rise of the UST curve after the payroll report has complicated the asset allocation debate heading into 2025. On the one hand, inflation sentiment has been good but might face a tariff reality check. On the other hand, the potential for setbacks in oil and in trade conflict could have materially negative effects on corporate capex that flows into hiring and cost reduction (layoffs).
Tariffs could weigh directly on consumers no matter what the “liars at large” spin on tariffs. The fact that “buyer pays” and that China has paid zero on tariffs (again, the buyer pays) was not addressed in the single debate. Trump got lucky and Harris dropped the ball on the topic. Tariff threats have only multiplied (literally). The bogus trade policies could bring the Grim Reaper effects of stagflation and contraction. Such risks are not off the table if we are supposed to take any of the political policy posturing seriously.
The checklist of troubling rhetoric and risk factors includes blanket tariffs on all imports (insane, self-destructive idea), combative punitive tariffs tied to cooperation on mass deportation, labor fallout from the deportation of millions (wage pressure), or a Mexico vs. US clash on trade tied to nationalism and sovereign sensitivities. Mexico is a critical part of so many supply chains with many owned by US companies. It is a leading import nation in the Big 4 trade partners of the EU, Canada, Mexico, and China. Mexico was the #1 importing nation and EU the #1 when treated as a bloc (see Tariffs: Questions that Won’t Get Asked by Debate Moderators 9-10-24, Facts Matter: China Syndrome on Trade 9-10-24).
The ultimate worry is trade war with China dislocating supplier chains (notably semis), withdrawal from NAFTA/USMCA after a 6-month notice period, a breakdown with Canada or Mexico ahead of the 2026 USMCA reviews. We have already seen what supplier chain turmoil can deliver in price effects in an economy where demand is solid.
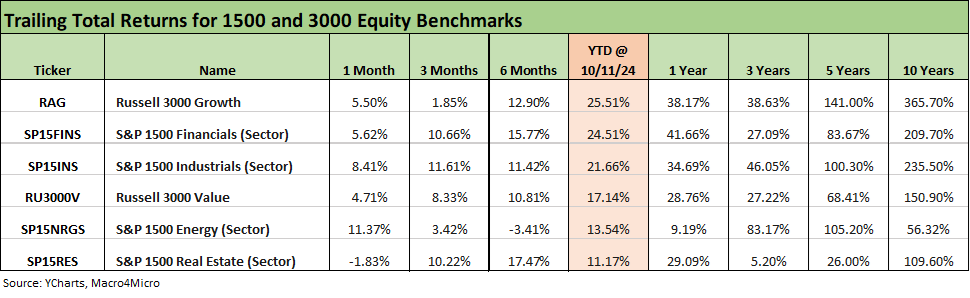
The above chart updates the 1500 and 3000 benchmarks with only real estate posting negative numbers for the 1-month period after a very strong run for real estate on the UST rally over the summer and early fall. As we detail below in the benchmark and ETF time horizon review, the Real Estate ETF (XLRE) is second to last over the 1-month period with only the long duration 20+ Year UST ETF (TLT) doing worse.
The rolling return visual
In the next section, we get into the details of the 32 ETFs and benchmarks for a mix of the trailing periods. Below we offer a condensed 4-chart view for an easy visual on how the mix of positive vs. negative returns shape up. This is a useful exercise we do each week looking for signals across industry groups and asset classes. We also have a YTD version that we include in the broader commentary on the time horizons further below.
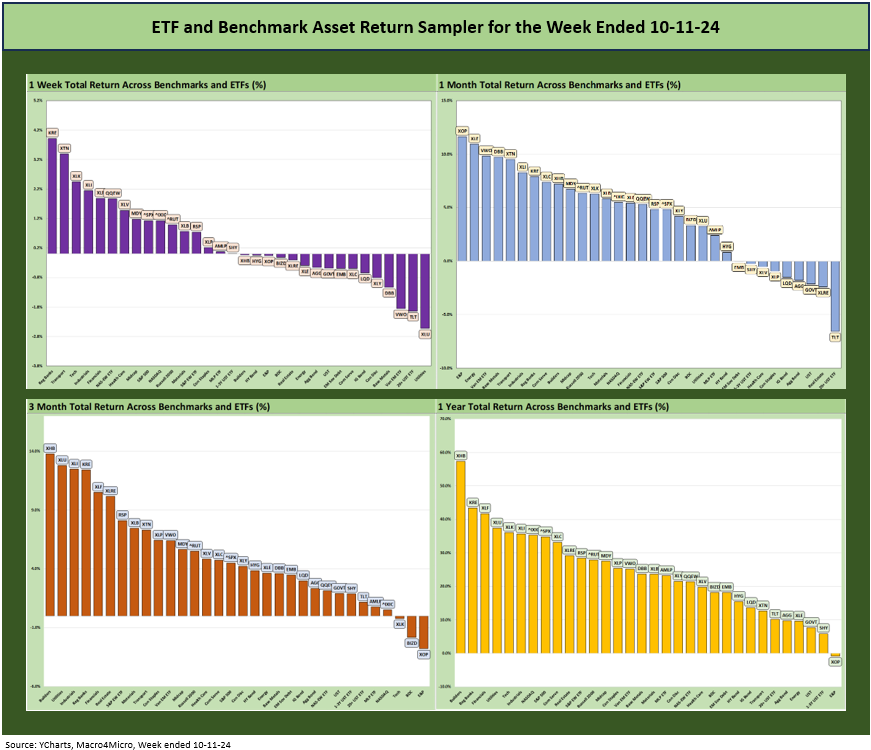
The above chart offers the “aerial view” on some of the key time horizons. The 1-week period is a dead heat at 16 positive and 16 negative even with the cyclical reassurance the market has been receiving, the “record high” headlines in equities, the solid response to the initial megabank earnings (JPM, WFC) and the longer-tailed tech rally of the last week seen in the Tech ETF (XLK) and Equal Weight NASDAQ 100 (QQEW). The headlines seem rosy given the performance in equities of late, but the chance of a material second-guessing phase on valuation could be an event or two away.
The Magnificent 7 heavy ETFs…
Some of the benchmarks and industry ETFs we include have issuer concentration elements that leave them wagged by a few names. When looking across some of the bellwether industry and subsector ETFs in the rankings, it is good to keep in mind which narrow ETFs (vs. broad market benchmarks) get wagged more by the “Magnificent 7” including Consumer Discretionary (XLY) with Amazon and Tesla, Tech (XLK) with Microsoft, Apple, and NVIDIA, and Communications Services (XLC) with Alphabet and Meta.

The tech bellwether table above lines up the Mag 7+ Taiwan Semi and Broadcom stocks in descending order of returns for the week. Those are listed alongside a range of other trailing time horizons back to 5 years. We also drop in the broad market S&P 500 and NASDAQ along with two Equal Weight ETFs for the S&P 500 (RSP) and NASDAQ 100 (QQEW).
Tech leaders had a very mixed week with NVIDIA rebounding again and Taiwan Semi rebounding but 3 of the Mag 7 in negative range (Tesla, Alphabet, and Meta) with 2 barely positive (Microsoft, Apple). Amazon at +1.1% was essentially tied with the S&P 500 in the week with NVIDIA leading the pack at +7.9%.
Tesla took a beating at -12.9% after its Robotaxi event saw the word “flop” show up more than a few times in commentary. We see TSLA in the red for a range of trailing timelines at -12.3% YTD, -17.2% 1-year and -17.5% for 3 years. It is still a home run over 5 years.
The future of Autonomous Vehicles (“AVs”) is losing some of its buzz over time just as EV is no longer a magic pair of letters in the auto sector. Even if it is easy enough to believe the AV subsector and the “Uber without the Dude” theme will be a broader fact of life in time, the exercise of setting revenue and earnings forecasts and attaching a multiple and discount rate to it always is going to have elements of the late 1990s forward valuation rain dances on how to roll it into companies with otherwise fading sales growth.
The revenue growth challenges for some low revenue growth megacaps gets quite a bit of focus lately in tossing around the “bubble” word for the total index. The diminished odds of recession risk and the favorable (if stalled) moves lower in inflation and solid payroll are all supporting the soft landing headlines.
That said, there is a common theme that the market multiples are too high and protectionism will hurt demand, undermine exports (even just on retaliation alone without the other factors), and tariffs will crush supplier chains, raise unit costs, and send companies into defensive mode on capex. In other words, these are some of the same factors that sent stocks into the tank in 2018 – only worse. That is, until the Fed came to the rescue in 2019.

The 1-week numbers were split at 16-16 on the positive vs. negative scoresheet. Even though CPI was tagged as “hotter than expected,” the move into low 2% handle (+2.4%) headline CPI ranks as the lowest since 2021 and is below the long-term median of +3.1% (see CPI Sept 2024: Warm Blooded, Not Hot 10-10-24). An escalation in the Middle East could change the calculus in a hurry if the Strait of Hormuz bears the brunt or Israel does the counterintuitive (and risky) move of attacking energy infrastructure (thus seriously annoying allies on oil price effects).
The top quartile shows a good week for Financials and Tech. The JPM earnings release is always a critical focal point and JPM popped by over +4.4% while fellow Big 6 member Wells Fargo (WFC) rose by over +5.6% on the day. The color was positive for large corporates and the tone around the consumer sector was favorable even if there is no way to get around weakening asset quality for more stretched households. JPM flagged the “soft landing” scenario as the most likely outcome while Jamie Dimon also hedged his bets with the event risk on the geopolitical side.
We see the relief in financials with the Regional Bank ETF (KRE) performance for the week at #1 and the broad Financials sector ETF (XLF) at #5. We see Tech (XLK) at #3 and Equal Weight NASDAQ 100 (QQEW) in the top quartile also. We see some cyclically supportive diversity in the mix across Industries (XLI), the typically lagging Transports (XTN), Health Care (XLV), and Midcaps (MDY) in the top quartile.
Just across the line at the upper end of the second quartile we see the S&P 500, NASDAQ and Small Caps hanging around a +1% week, so the overall response to CPI and headline event risk remains mild for now.

We already addressed some of the 1-month trends earlier in the chart mix at the beginning of this commentary. The main theme is that it was a rough month for bonds after a strong payroll shocked the consensus (see Payroll Sept 2024: Rushing the Gate 10-4-24). Obscured by the Sept payroll surprise was the vary favorable JOLTS release for August with its 1-month lag (see JOLTS Aug 2024: Openings Up, Hires Down, Layoffs Down, Quits Rate Down 10-1-24).
That payroll news flowed into the UST curve and sent 5 of the 7 bond ETFs into the bottom quartile with the long duration UST ETF (TLT) posting an ugly -6.6% return and into a distant last place with 4 of the bottom 5 ETFs being bond ETFs. We see the Real Estate ETF (XLRE) in second to last. HY rode the spread tightening to its position as the only bond ETF to register positive returns at sub-1% just ahead of a minimal negative return for EM Sovereigns (-0.04%).
We see the Israel-Iran event risk flowing into the E&P ETF (XOP) and broad Energy ETF (XLE) along with China stimulus lifting the EM Equity ETF (VWO) and Base Metals ETF (DBB) in the Top 5. We also see a relief rally over in the Transport ETF (XTN) as the temporary agreement with the Longshoremen headed off a potential pre-election disaster for the freight sector that would have had massive ripple effects.
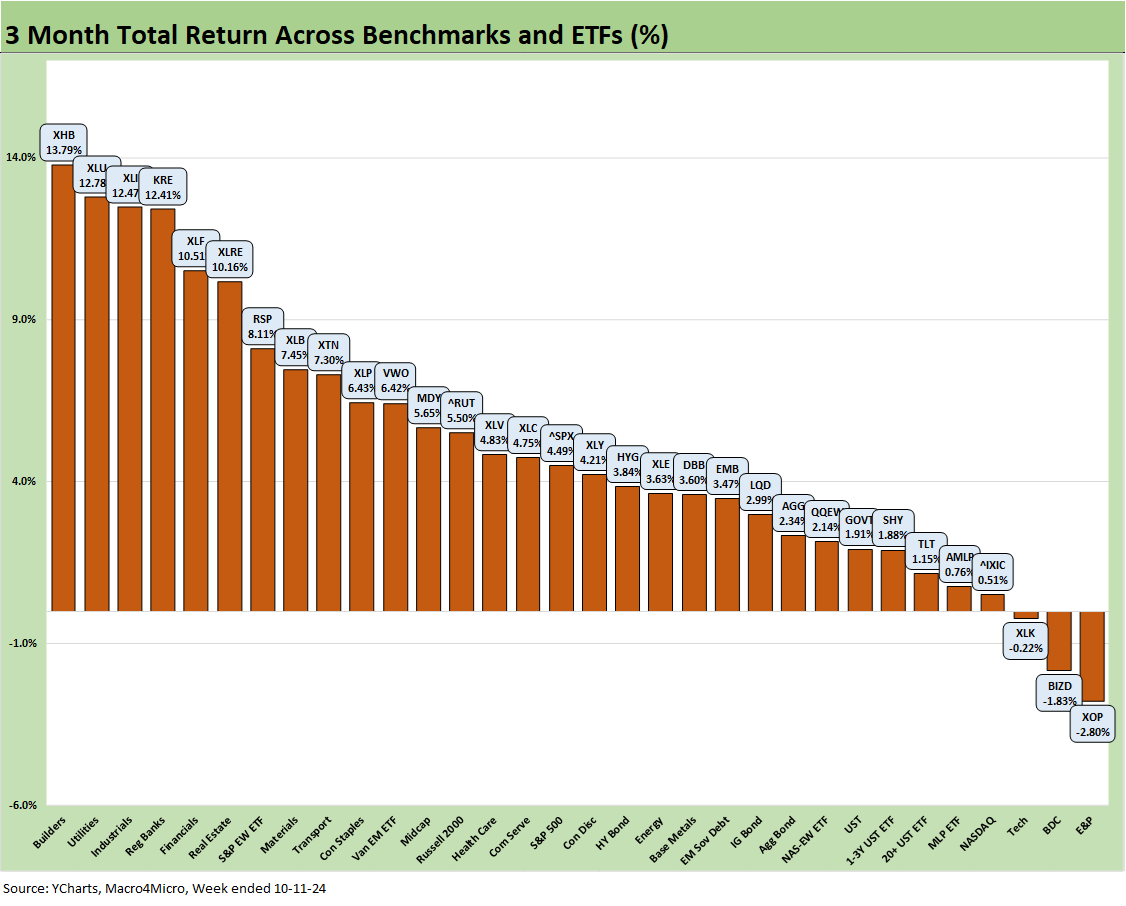
The 3-month returns are decidedly positive with a score of 29-3. The results show the benefits of the Fed easing, the favorable curve action, and the strong run in interest-sensitive stocks and financials (see FOMC Action: Preemptive Strike for Payroll? 9-18-24). E&P (XOP), the BDC ETF (BIZD), and the Tech ETF (XLK) are the only lines in the red zone for the time horizon in a reminder of the recent tech and Mag 7 swings.
We see 6 of 8 in the top quartile in double-digit returns, and that is impressive across a diverse mix that includes Homebuilders (XHB), Utilities (XLU), Industrials (XLI), Financials (KRE, XLF), and Real Estate (XLRE). We see the Equal Weight S&P 500 (RSP) in the top quartile at +3.6% return points ahead of the S&P 500, which is sitting at the bottom of the second quartile.
The Homebuilder ETF (XHB) is on top as 30Y mortgage rates were moving the right way. Freddie Mac was closing in on the +6.0% 30Y level before the payroll setbacks sent mortgage rates backpedaling closer to 6.5% on “payroll Friday” with Freddie at 6.32% this week (6.84% 52-week average).

The YTD returns present an easier picture to brand as very positive at a score of 31-1. Only the long duration UST 20+ Year ETF (TLT) is in the red at -2.4% in a reminder of the very tough 1H24 for duration after the booming rally of Nov-Dec 2023 for both duration and fundamental risk pricing across equities, credit, and the high quality bond markets.
As we detail below in the 1-year numbers, TLT generated an equity-like return at over 10% LTM, but even with such strong numbers, was in the bottom quartile of a banner trailing 12 months since just before the UST market peak 10Y UST (10-19-23). For a frame of reference, the TLT generated a near tie with the HY ETF (HYG) from 10-19-23 with both around +17.8%. The S&P 500 posted almost +36%. For those with major concentration risk, that is a lot of chips on the table heading into a very uncertain election and geopolitical period.
The top quartile YTD shows Utilities (XLU) edging out Homebuilders (XHB) with Communications Services (XLC), Financial (XLF), and the S&P 500 rounding out the top 5. With the large cap benchmarks (NASDAQ, S&P 500) joined by Industrials (XLI) in the top quartile, the mix shows a healthy, diverse cross-section of cyclical drivers. That is a reassuring mix and certainly not “all about tech” from a broader perspective even if the cap-weighted benchmarks are wagged by the Mag 7.

The leaderboard for the trailing year shows Homebuilders (XHB), Regional Banks (KRE), and broad Financials (XLF) in the Top 3 with interest sensitive and fundamentally well-positioned Utilities (XLU) in the top 4 before we get to the Tech ETF (XLK) at #5. Rounding out the top quartile is Industrials (XLI), tech-heavy NASDAQ and the S&P 500 at #8 with its Mag 7 influence. The Equal Weight S&P 500 is 6.4 points behind the S&P 500 only a few spots behind at #11.
For bond ETFs LTM, we see 5 of 7 in the bottom quartile (SHY, GOVT, AGG, TLT, LQD) with 2 others (HYG, EMB) at the bottom of the third quartile. E&P (XOP) is the sole ETF in the red zone with the broad Energy ETF (XLE) a few notches higher. Transports (XTN) rounded out the low quartile.
See also:
CPI Sept 2024: Warm Blooded, Not Hot 10-10-24
HY OAS Lows Memory Lane: 2024, 2007, and 1997 10-8-24
Footnotes & Flashbacks: Credit Markets 10-7-24
Footnotes & Flashbacks: State of Yields 10-6-24
Footnotes & Flashbacks: Asset Returns 10-6-24
Mini Market Lookback: Cracking the 300 Line in HY 10-5-24
Payroll Sept 2024: Rushing the Gate 10-4-24
CarMax: Why Do We Watch KMX as a Bellwether? 10-3-24
Credit Returns: Sept YTD and Rolling Months 10-1-24
JOLTS Aug 2024: Openings Up, Hires Down, Layoffs Down, Quits Rate Down 10-1-24
Footnotes & Flashbacks: Credit Markets 9-30-24
Footnotes & Flashbacks: Asset Returns 9-29-24
Footnotes & Flashbacks: State of Yields 9-29-24
Mini Market Lookback: PCE Tailwinds, GDP Holds Serve 9-28-24
State Level Economic Reality Check: Employment, GDP, Personal Income 9-28-24
PCE Prices Aug 2024: Personal Income & Outlays 9-27-24
KB Home: Steady Growth, Slower Motion 9-26-24
Durable Goods Aug 2024: Waiting Game 9-26-24
2Q24 GDP: Final Estimate and Revision Deltas 9-26-24
New Home Sales Aug 2024: Waiting Game on Mortgages or Supply? 9-25-24
Lennar: Bulletproof Credit Despite Margin Squeeze 9-23-24
Mini Market Lookback: FOMC Week 9-21-24
Credit Crib Note: Service Corp International (SCI) 9-19-24
Existing Homes Sales Aug 2024: Mortgages Still Rule 9-19-24
FOMC Action: Preemptive Strike for Payroll? 9-18-24
Home Starts Aug 2024: Mortgage Rates to Kickstart Hopes Ahead? 9-18-24
Retail Sales: Down to the Wire? 9-17-24
Credit Crib Note: United Rentals (URI) 9-16-24
Industrial Production: Aug 2024 Capacity Utilization 9-17-24