
Footnotes & Flashbacks: Asset Returns 1-1-24
We wrap the last ETF and benchmark return review for 2023 as the return symmetry late in the year shows a remarkable comeback.


We look at the asset returns for the last week of a wild year as 2023 closes out a full-year performance with 19 of the 31 benchmark/ETFs we track in double-digit positive return range (27 total positive) and only 4 of 31 negative with no double-digit losers.
The Homebuilder ETF (XHB) hung in to close the year with enough to take the top ranking for all of 2023 and beat the Tech ETF (XLK) with the next 4 connected to Tech or Magnificent 7 heavy ETFs.
Besides Builders, the only other category to make the top quartile outside Tech and “Mag 7” issuer concentration was the BDC ETF (BIZD), which ranked just ahead of the S&P 500.
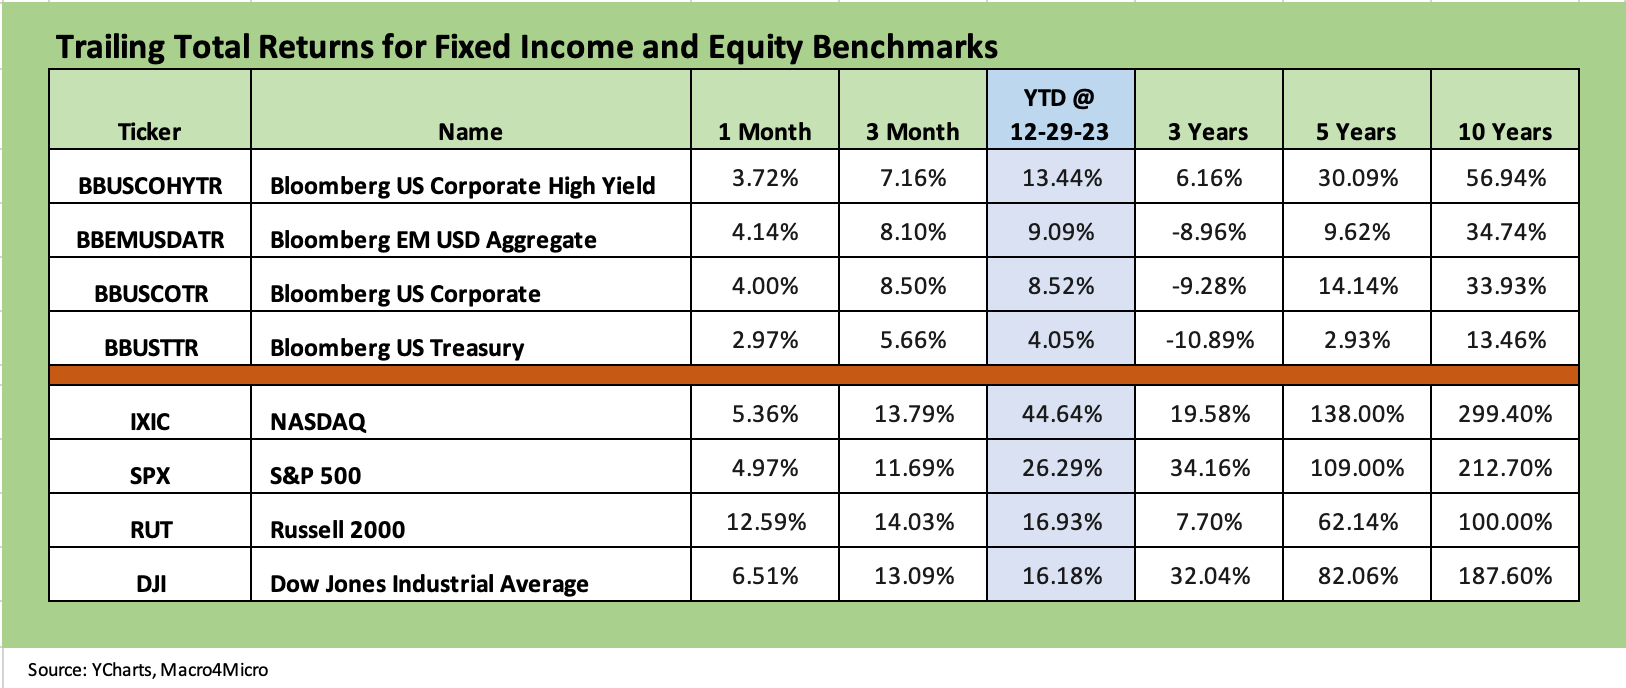
The above chart posts the final “Footnotes” asset return table for the year with the 1-month, 3-month, and YTD columns above all turning up comfortably in the positive zone. The debt and equity benchmarks we follow turned in solid numbers in equities and fixed income benchmarks on all fronts despite showing a lot of red as recently as late Oct 2023 when the 1-month and 3-month returns were all negative. More than 100% of the YTD return for UST is in the 3-month column.
Two months of material spread compression and a shockingly strong UST rally “made the year” for some subsectors. That was notably the case in IG Corporates, where the trailing 1-month was almost half the full year total return. For the 3-month time horizon, the 8.5% 3-month return was almost even with the YTD return ahead of the Nov-Dec rebound.
In equities, the small cap rally over 1-month of +12.6% comprises a substantial majority of the YTD small cap returns and an even higher share over the 3-month horizon, which posted +14% of the +16.9% seen for the year. The Dow hit an all-time high and the S&P 500 barely missed its all-time high.
NASDAQ and tech generally served as the big story for much of the year after a beatdown in 2022. Growth stocks dramatically outperformed broadly even if the outsized returns of the Magnificent 7 grabbed most of the headlines. The breadth of the market strength shown later in the year is detailed in the ETF return section below.
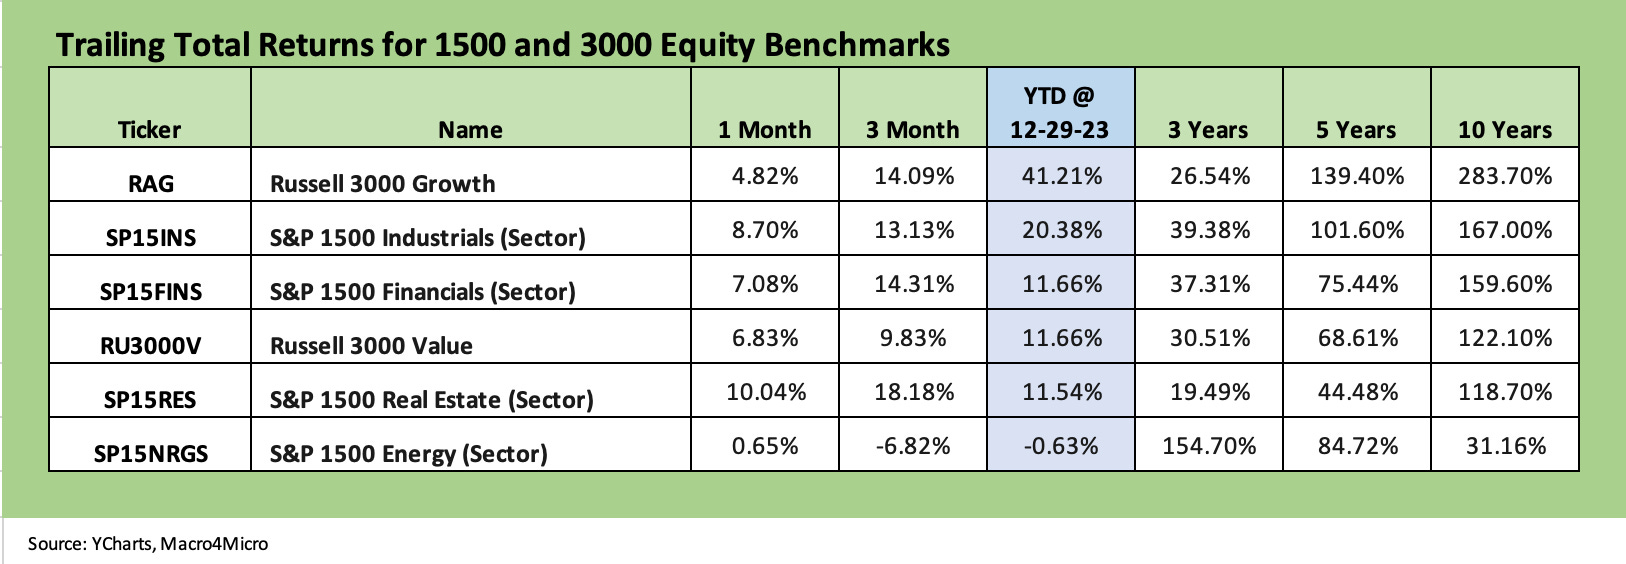
The 1500 and 3000 series kept the themes of this past month intact with Growth staying strong over 1-month and 3-month periods, but we saw disproportionate moves in small caps, financials, and interest-sensitive sectors such as real estate.
The UST support saved the year for some equity benchmarks as the year wound down. Double-digit returns for Financials, Real Estate, and Value were not high odds-propositions to start 4Q23. Industrials tacked on more as well to cross the +20% line for the year.
Energy remained weak for Dec 2023 as oil and gas exposure lost its allure badly later in 2023. The -6.8% 4Q23 sent Energy into slightly negative returns for all of 2023. With an Iranian warship in the Red Sea in the headlines as we go to print, oil is one variable that will always go in the unpredictable bucket.
The return snapshot with a quick visual…
The following chart grouping allows for an easy view of the shape of returns for each period (1-week, 1-month, 3-months, and YTD). We occasionally see all negatives or all positives, but we found it to be an easy way to look at the current configuration and how running YTD numbers may have reshaped in just a week, a month, or a rolling 3-month period.
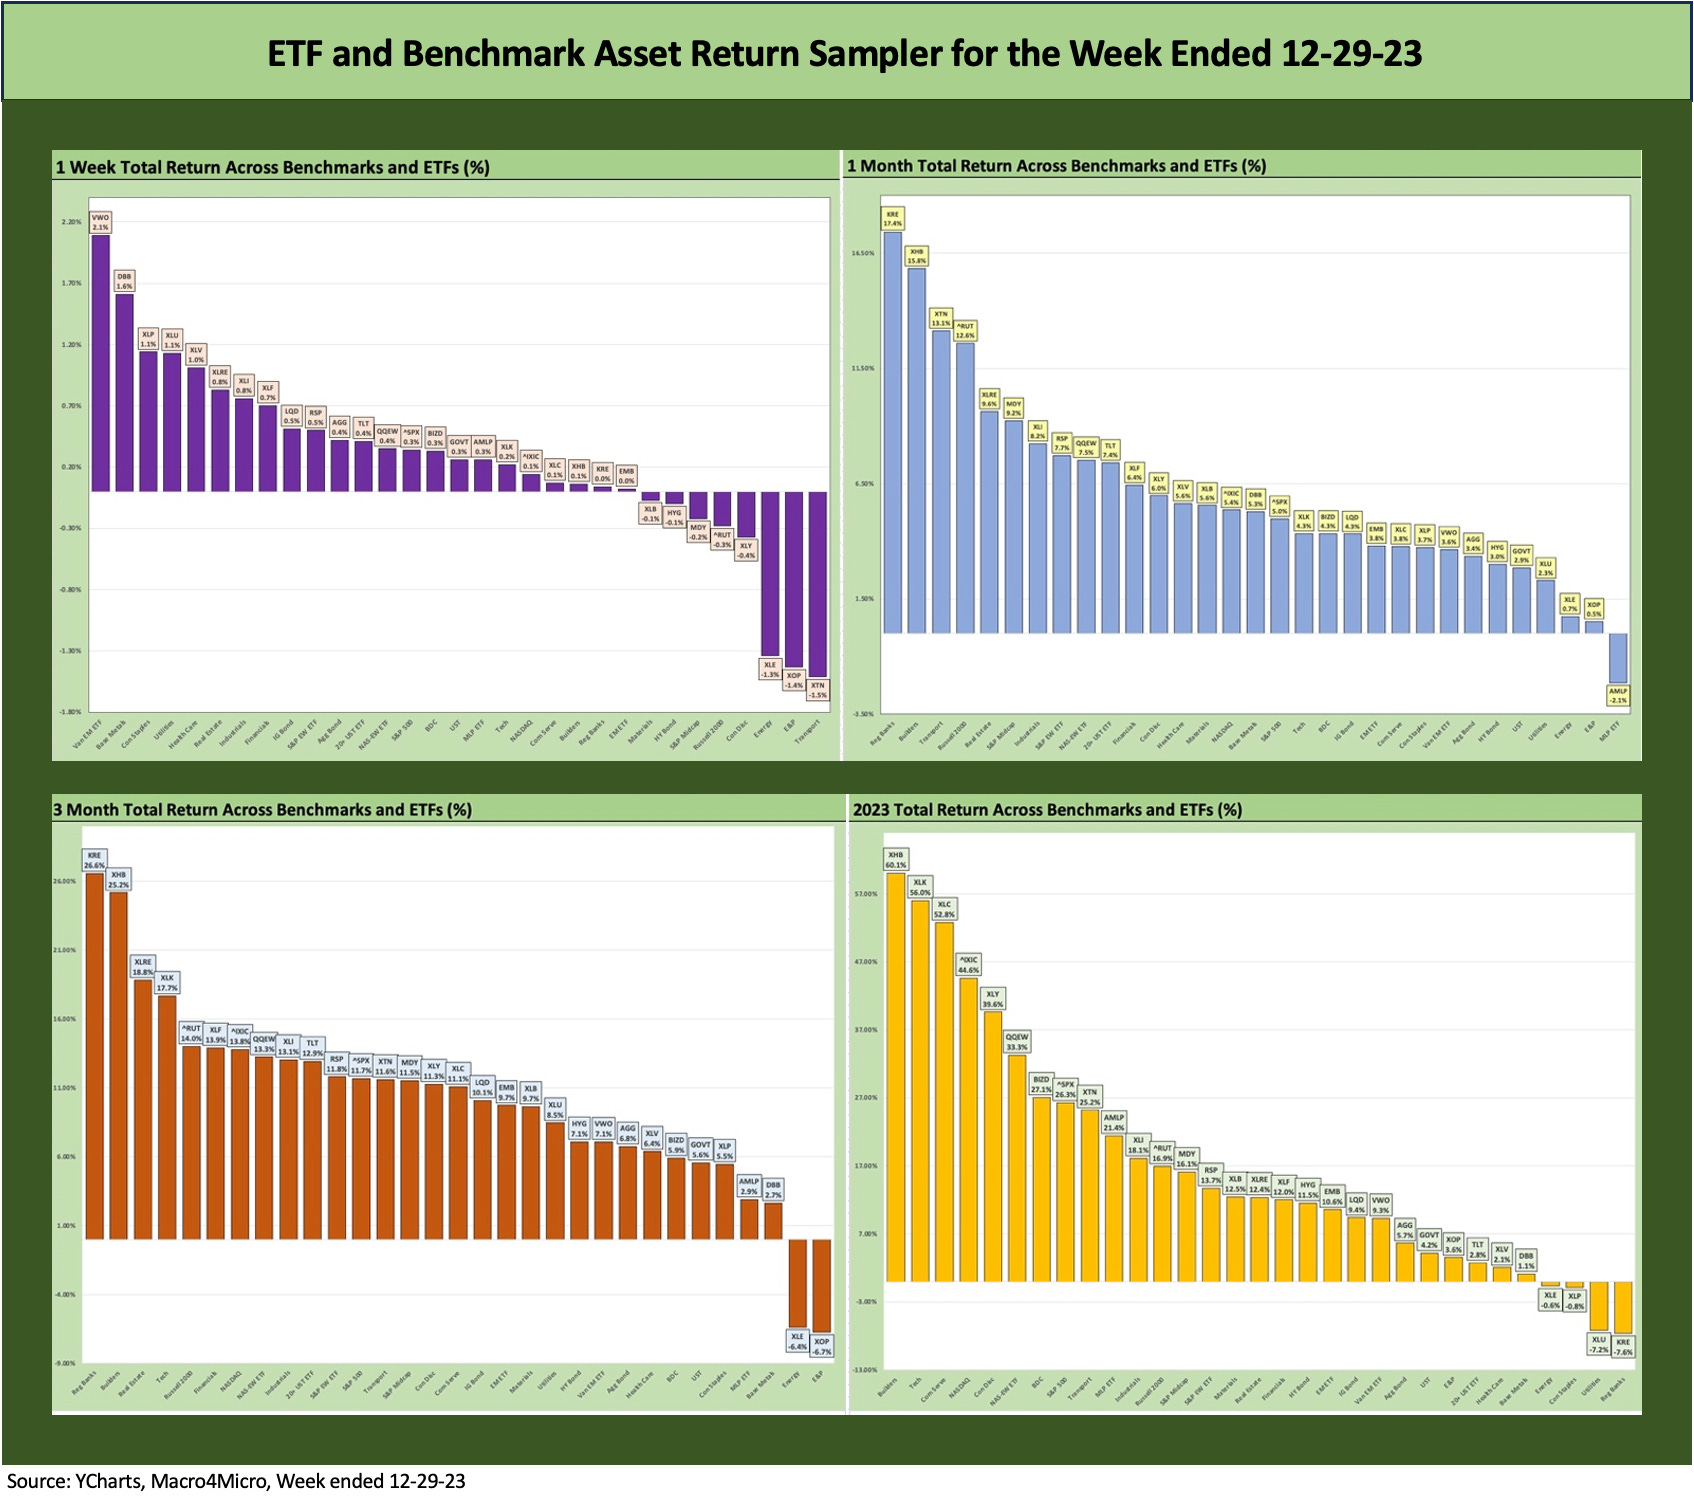
The chart does not leave much to the imagination about how the recent periods have played out. We look at the granular details in the ETF section below.
The latest week booked a few more weak sectors to wrap an exceptionally strong month after a very strong 2-month rally. The final print has only 1 ETF in the red for the trailing 1-month with Midstream (AMLP) and only 2 ETFs in the red for 3-month (i.e., 4Q23) with E&P (XOP) and Energy (XLE).
The strong finish added up to only 4 ETFs in the red for the full year with Energy (XLE), Staples (XLP), Utilities (XLU), and Regional Banks (KRE) bringing up the rear. KRE posted “only” a -7.6% YTD return after KRE was #1 for both the 1-month and 3-month periods as it slowly but steadily recovered from the plunge in March 2023 to continue its comeback. We look at the moving parts in the ETF time horizon sections below.
With 31 benchmarks and ETFs showing 27 positive returns, the breadth issue of the market recovery in equities changed dramatically over a very short time horizon. With 19 of those in positive territory posting double-digit returns for the full year 2023 (versus zero in double-digit negative range), the diversity of winners looked very different from where the market stood in late October.
The Magnificent 7 heavy ETFs…
Some benchmarks have a few issuer concentration elements that leave them wagged by a few names. When looking across some of the bellwether industry/subsector ETFs, it is good to keep in mind which narrow ETFs (vs. broad market benchmarks) get wagged more by the “Magnificent 7” including Consumer Discretionary (XLY) with Amazon and Tesla, Tech (XLK) with Microsoft, Apple, and NVIDIA, and Communications Services (XLC) with Alphabet and Meta.
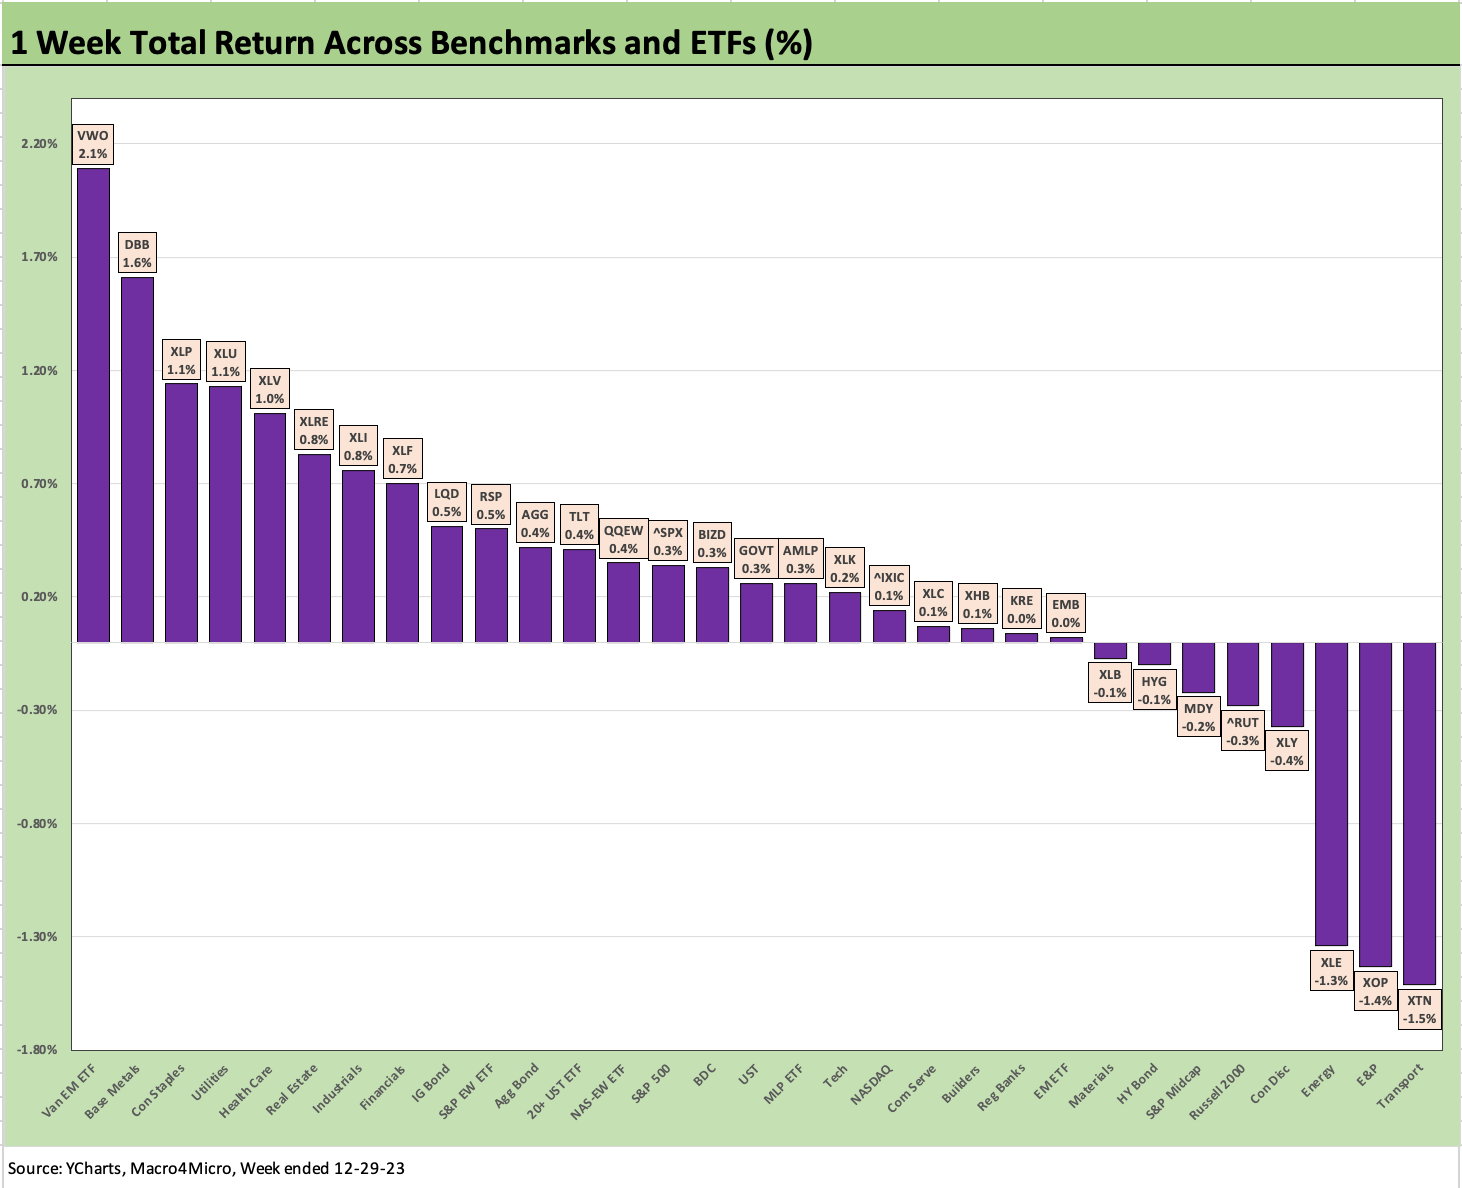
The final week was not especially eventful as the market wound down with a few line items dropping into the red but not changing the December story at all. The week still weighed in at 23-8 positive. The main story for the week seemed to revolve around whether the S&P 500 would hit an all-time high above the Jan 3, 2022 peak of ~4797. The SPX missed the record by just over 0.5% after a +0.3% week.
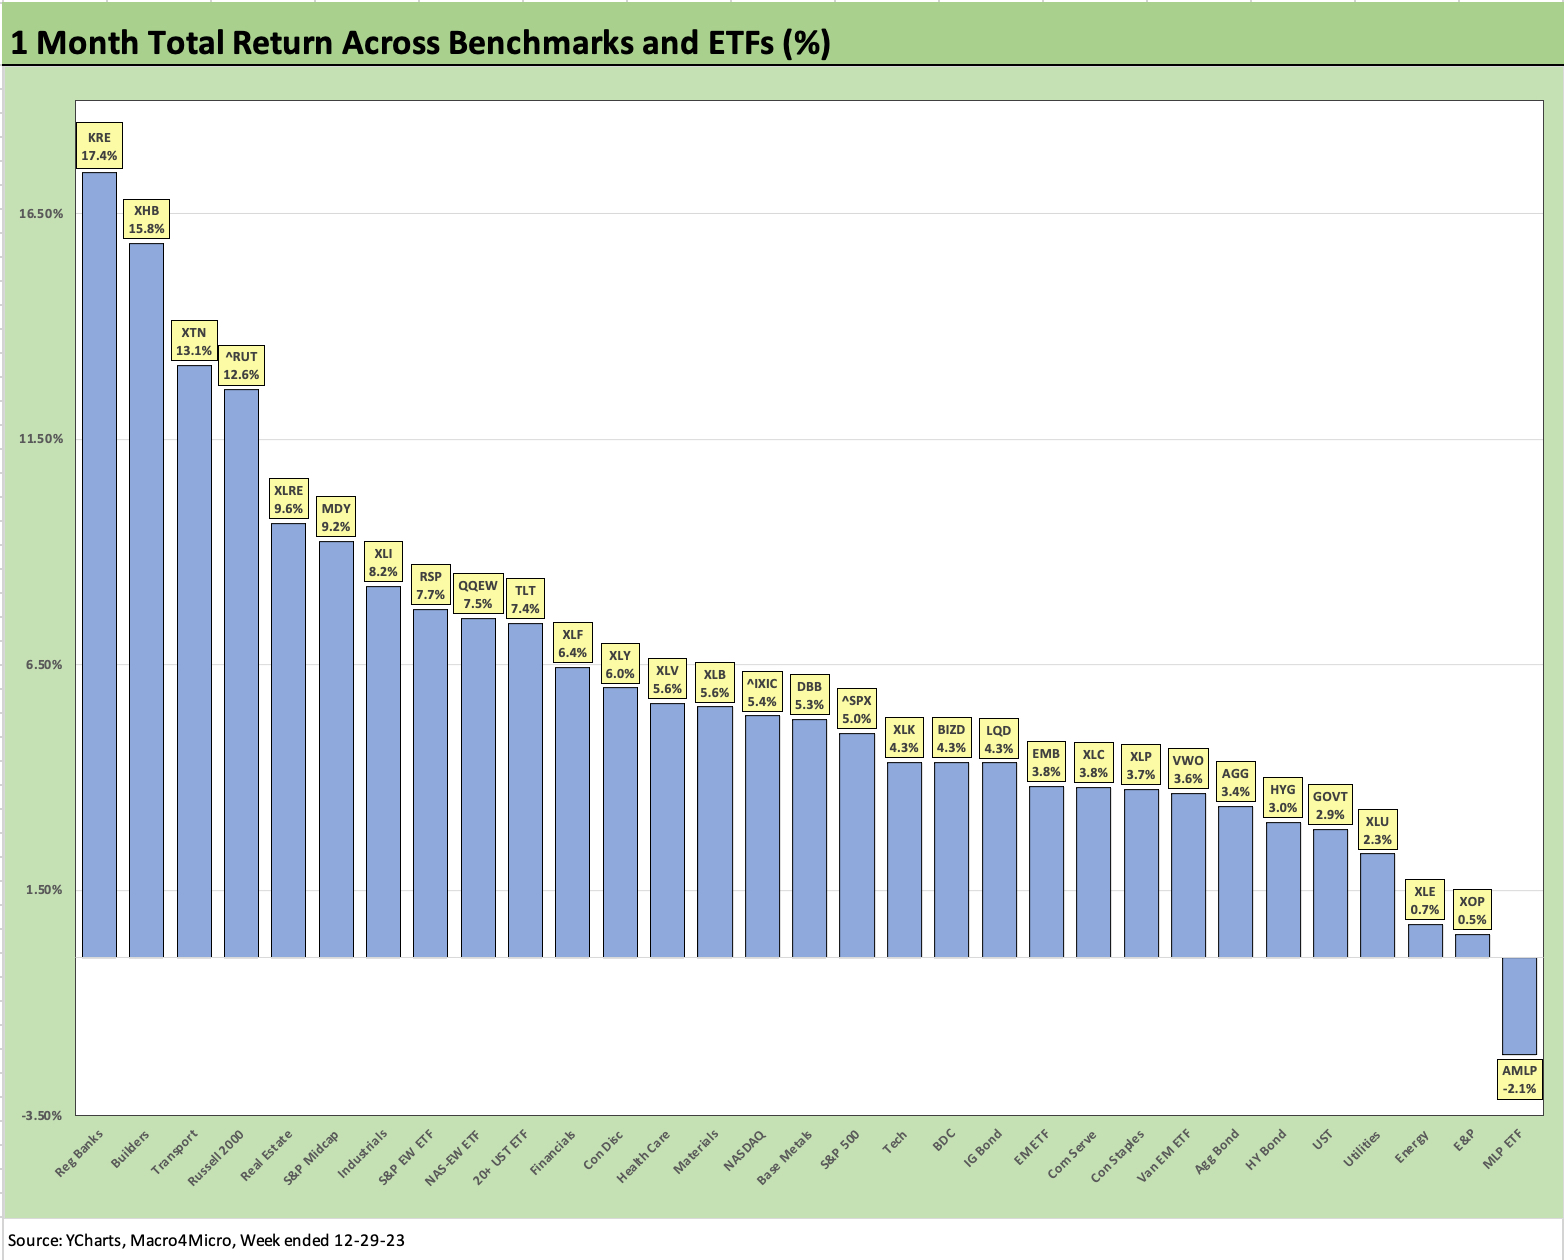
The 1-month will be one to remember after a strong Nov 2023 got the ball rolling. We see one ETF in the red with the Midstream ETF (AMLP). The top 4 were in double digits for the month with more than half the 31 buckets above 5% for the month.
The top quartile saw exceptional breadth and diversity among the top performers with Regional Banks (KRE) at #1, Builders (XHB) finishing in style at #2 to win the year, the cyclical Transports (XTN) making a strong statement to end the year, small caps at #4 after being negative as recently as Oct, and the Real Estate ETF (XLRE) salvaging a volatile year at #5 for Dec 2023.
Midcaps (MDY) chased small caps into the top quartile at #6 with Industrials (XLI) teaming up with the XTN transport and smalls caps (RUT) for some cyclical sentiment support before we see the equal weighted S&P 500 ETF (RSP) at the bottom of the top quartile ranks.
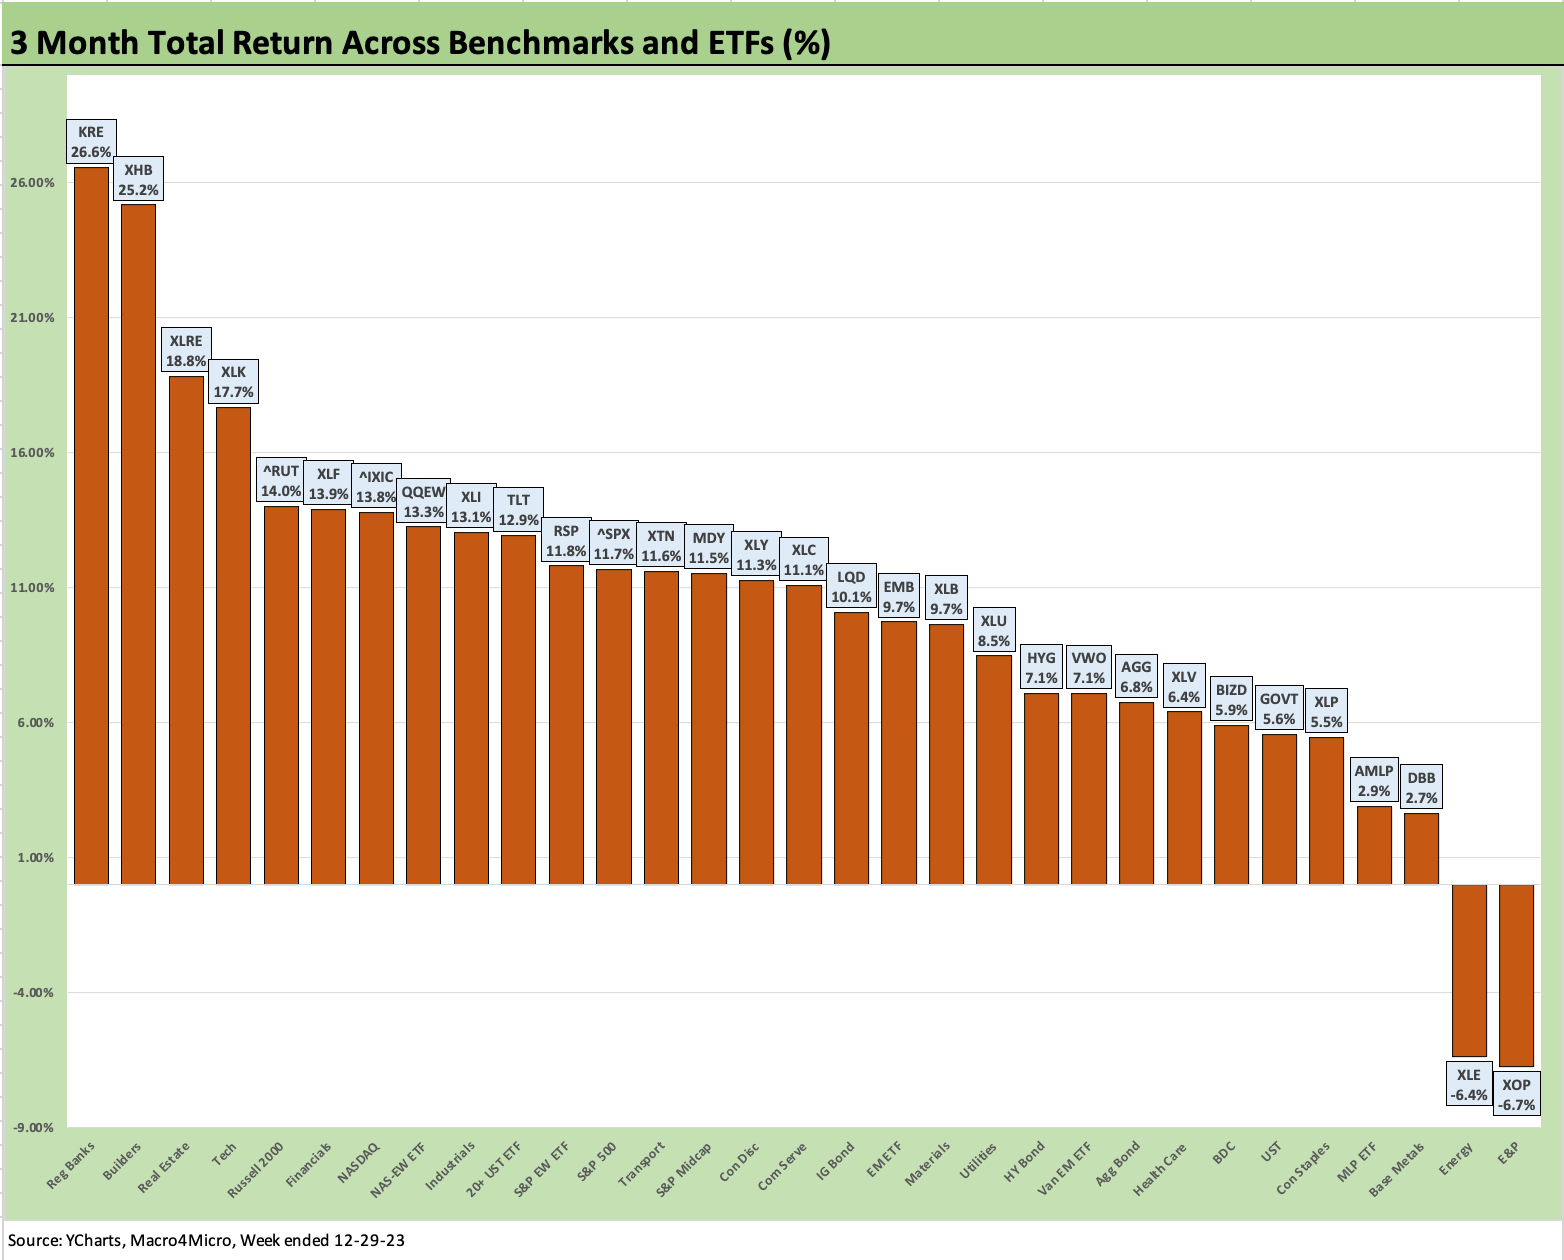
The 3-month closeout to 2023 was 29-2 with only E&P (XOP) and Energy (XLE) in the red. We see 17 of 31 in double-digit positive range and only 4 ETFs below 5% handles. That is a wildly positive quarter considering the overall mix of factors and lingering risks and where the market stood as of late Oct 2023.
Regional Banks (KRE) at over +26% and Builders (XHB) at +25% continued the recovery of KRE in whittling down its running negative returns for 2023 while XHB finished strong to take the title belt for the full year 2023 ahead of the Tech ETF (XLK).
Other strong finishes over 4Q23 included some that have been in the interest-sensitive penalty box including Real Estate (XLRE) at almost +19% for the quarter and Financials (XLF) at almost +14%. The long duration 20+Y UST ETF (TLT) climbed to #10 in the mix as the only fixed income ETF in the Top 10 at +12.9% and the only bond ETF to make the second quartile for 3 months. The IG Corp ETF (LQD) just missed the second quartile with a very solid +10.1% return for the final 3 months. That single quarter is an equity-like return for a full year based on long term histories.
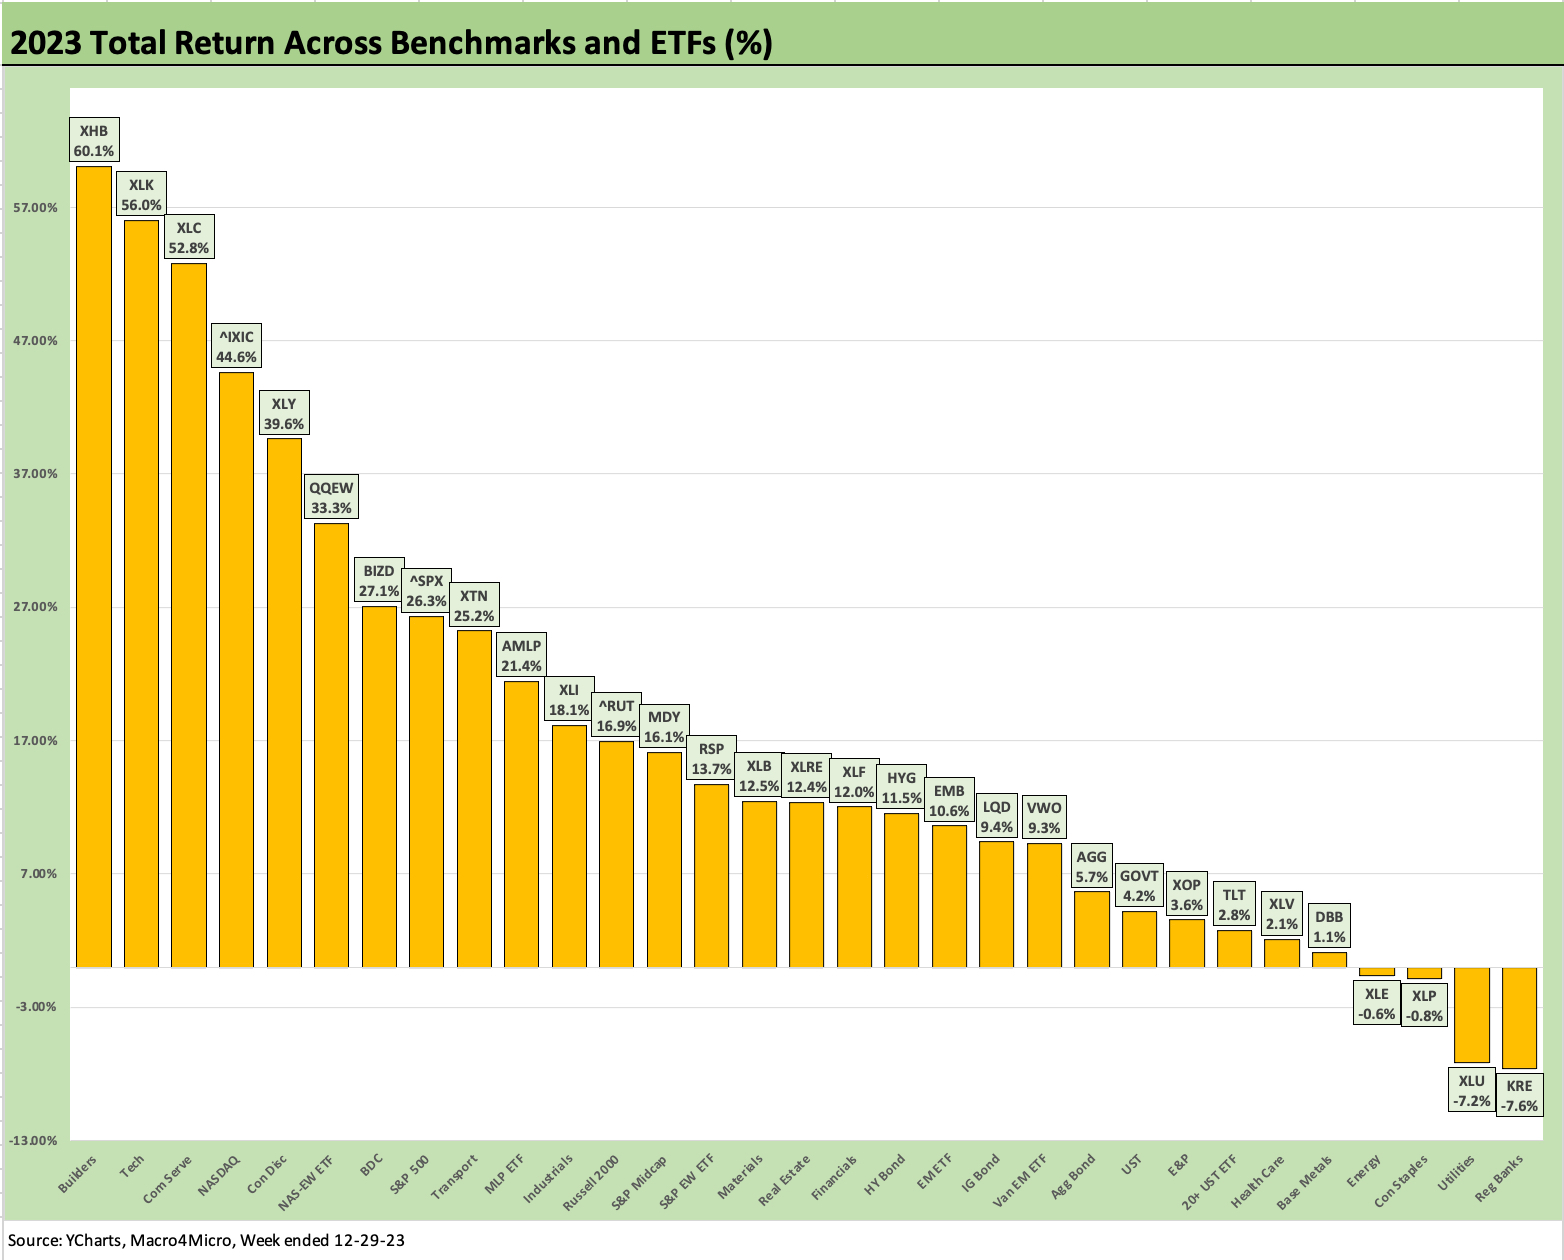
The full year rankings show Builders (XHB) at #1 before the next 5 benchmarks and ETFs tie into Tech (XLK) tech-related, or Magnificent 7 heavy benchmarks. We see the BDC ETF (BIZD) at over +27% riding high dividends and bullish views on the credit cycle to a top quartile spot at #7 just ahead of the Magnificent 7 heavy S&P 500 at #8 with its +26% handle.
The 4 ETFs in the negative zone for the year were addressed earlier, but there was a common theme for 3 of the 4 in terms of interest rate sensitivity. KRE fell back into last place for the full year after briefly edging ahead of Utilities (XLU) YTD as of last week. Using equities as bond proxies is a tough sell when higher yields in cash and fixed income offer alternatives.
Staples (XLP) has been a dog across most of 2023 given a combination of valuation and low dividend yields relative to cash or fixed income alternatives for income seekers. There was also the recurring question of inflation effects on the consumer and diminished purchasing power. The sector is very diverse by industry subsector, so it is not an easy generalization to make for the Staples as a group.
We again see Energy (XLE) as a weak performer after a banner stretch in 2022 on the war panic. M&A and consolidation has been a theme in energy as well, but deal valuations have generally disappointed. The shortfall of energy offers a reminder that energy lends itself to active management and especially when high dividends fade relative to cash.
Energy is always a tricky wildcard for inflation and economic and household discretionary cash flow pressure. As mentioned earlier, the idea of the Iranian Navy messing around in the Red Sea in support of their Houthi proxies is what will always keep energy interesting. The same is true of any escalation on the Iranian side of the Arabian Peninsula where the military action is closer to home for Iran and where the world sees the main OPEC traffic. Any heightened tension between the US Navy and Iranian Navy in the Red Sea could lead to some severe price volatility to the upside in oil (and some marathon swimming experiences for Iranian sailors).
See also:
Credit Performance: Excess Return Differentials in 2023 1-1-24
Return Quilts: Resilience from the Bottom Up 12-30-23
Coupon Climb: Phasing into Reality 12-12-23
HY vs. IG Excess and Total Returns Across Cycles: The UST Kicker 12-11-23
HY Multicycle Spreads, Excess Returns, Total Returns 12-5-23
HY Credit Spreads, Migration, Medians, and Misdirection 11-6-23
Quality Spread Trends: Treacherous Path, Watch Your Footing 10-25-23