
CPI Sept 2024: Warm Blooded, Not Hot
Sept CPI was tagged as “hotter than expected” but headline CPI gives the anxious something to hold onto with the “smallest increase since Feb 2021.”


Is this a kid’s story or a call on the 10 year?!
The CPI weighed in with less support than desired by many UST bulls but does not feed the bears much either with Energy and Goods deflation even if Services are sticky with Shelter playing its usual role.
The UST reaction was muted with the 10Y UST up slightly as we go to print and 2Y UST down.
The CPI “All items less shelter” special aggregate index weighed in at +1.1% with Services still hanging around at +4.7% and Shelter at +4.9%, so the sticky challenges still rule the numbers with only a partial story from Harris on housing and zero information from Trump.
We look at the “fed funds minus CPI” relationship across time, and the Fed still has plenty of room to maneuver ahead to ease more if they stay concerned about the overall consumer cycle (read “jobs”) more than stubborn services and housing.
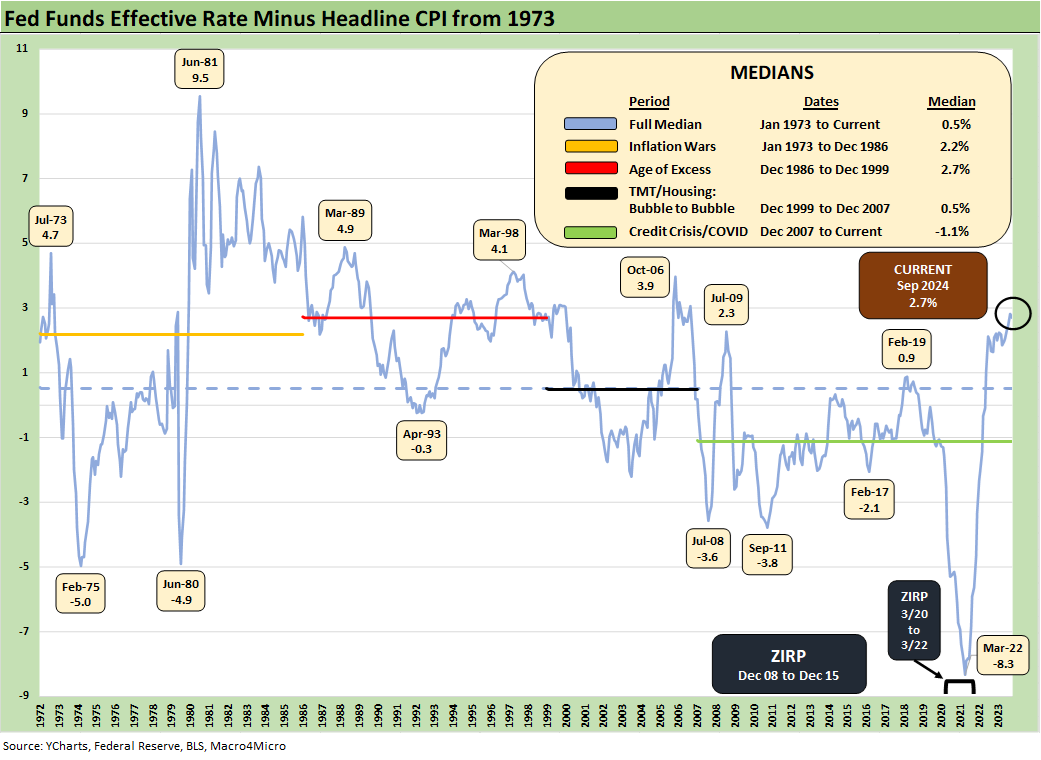
The above chart is one we often use in framing fed funds vs. CPI or PCE. This “real fed funds rate” offers a measure of how much room to tighten and how much flexibility the Fed has. The Fed sets its sundial by PCE, but the same basic concept applies after a period in 2022 where tightening was still yielding net negative fed funds.
The PCE and CPI news overall in recent months has been favorable even with some core inflation stalls, so the +2.7% excess noted above in the fed funds effective rate vs. CPI is helpful to the story. “Fed funds minus headline CPI” is comfortably in excess of the long-term median of +0.5% across the wild inflation swings. The median from Jan 1973 to Dec 1986 posted a median differential of +2.2%. This median covers the time from the oil embargo year to the oil crash of 1986 and 1% handle CPI.
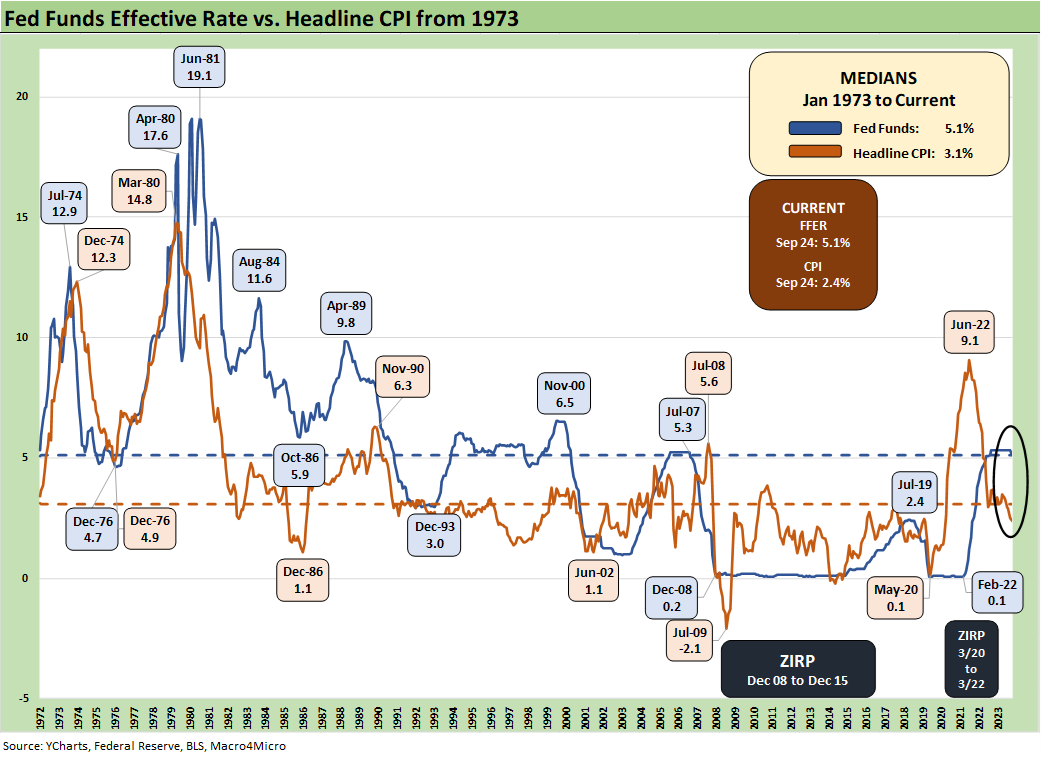
The above chart offers some more historical flavor on the CPI vs. fed funds rate time series used to derive the differential. This history tells a story that shows how ugly it can get as seen in the post-oil crisis years of 1973 and later including the years when US industry was going through gut-wrenching changes in the late 1970s and early 1980s. That period includes the stagflationary double dip recession of 1980-1982.
As a reminder from earlier commentaries, the early 1980s peak actually hit 20% fed funds, but the Fed data source we use rolls up averages for the 19% handle peak noted in the chart. The 1973 oil embargo and the 1979 Iranian “oil crisis” (much of it self-inflicted by the major integrateds’ refined product inventory management) flowed into some very heady CPI numbers on the energy component. Those were very different times.
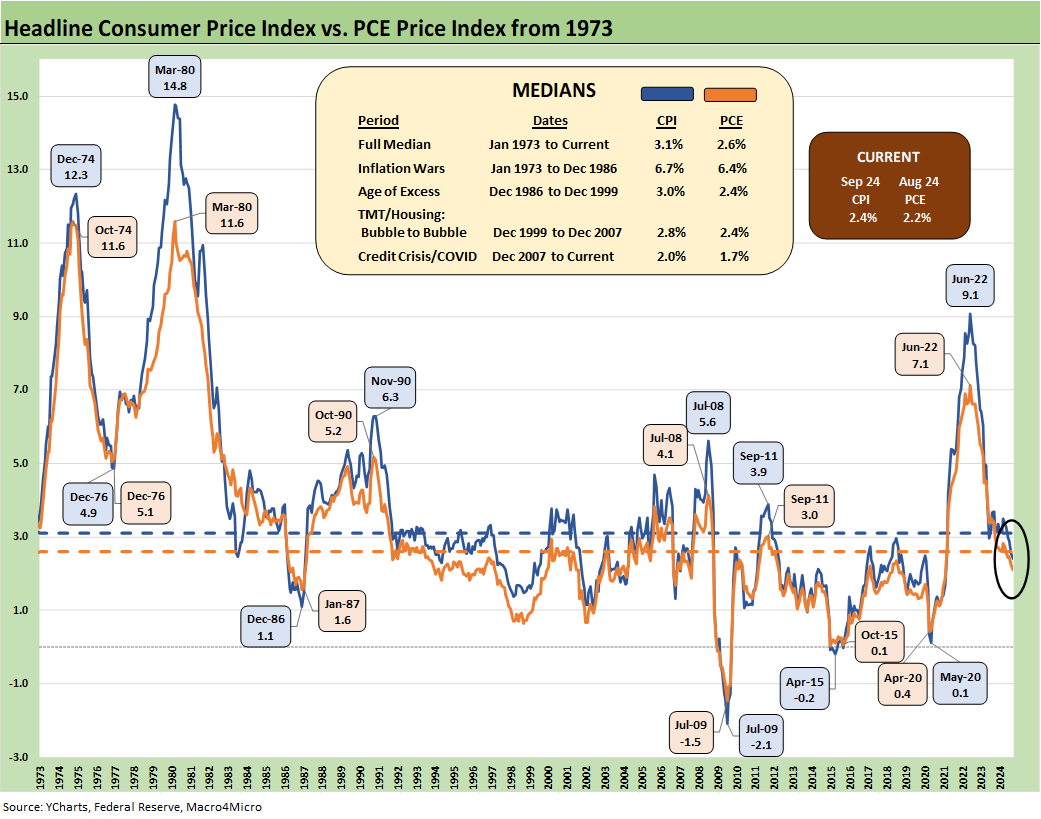
The above chart offers another visit to the CPI vs. PCE relationship across the decades. The long-term median for headline CPI is +3.1% and PCE is +2.6%, so that helps give some context to the +2.4% headline CPI released today. Energy and food tend to dominate the dialogue for very good reasons with “Food all” at +2.3% and “Food at home” at +1.3%.
Energy is very volatile as history has shown while the big economic headache for Food is that – in notable contrast to energy – food does not get into heavy deflation mode and does not revert the “cost of the menu “to earlier purchasing power. In other words, it doesn’t deflate in aggregate food CPI except for some very small deflation moments. Some line items will deflate, but not when you roll them up (see Inflation Timelines: Cyclical Histories, Key CPI Buckets11-20-23).
Some will claim that none of those would have happened under different leaders (“Putin and the Avian Flu virus would not dare mess with our eggs if I was President”), the inflation story is always much more complicated than the simple pitches and especially in geopolitically driven oil prices.
Into the weeds for Sept 2024 CPI…
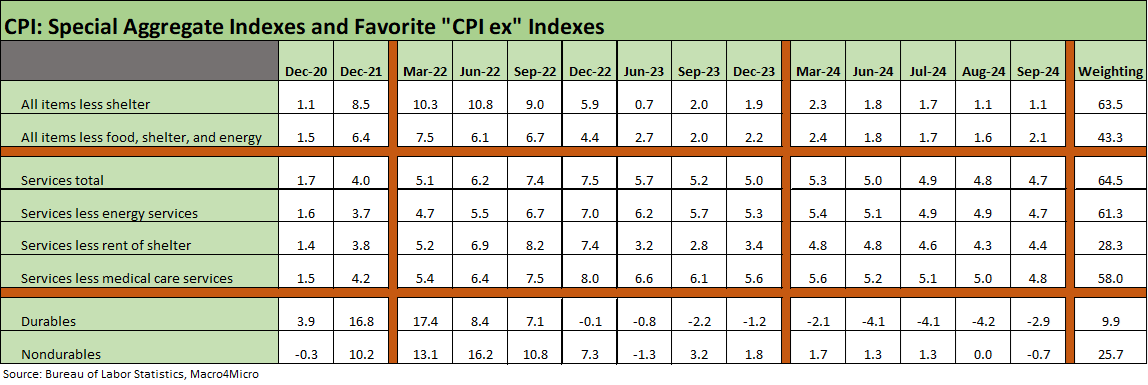
As we get into the CPI lines for the month, the above “Special Aggregate indexes” offer some different angles. The +1.1% for CPI All Items less Shelter is supposed to calm nerves. For policy-related political debates, the idea of supply vs. demand and the role of demographics usually do not come up enough even if it’s a major factor driving the bullish view of the homebuilding industry and the demand side.
COVID saw a spike in demand while rates were very low after a protracted period of ZIRP and normalization of rates turbocharged refinancing volumes and owners locked in low mortgage rates that continued into 2020-2021. The immediate issue in CPI is that there are a lot of asterisks that come with the Owners’ Equivalent Rent metrics that depart from a realistic, actual owners monthly cash flow burden. We have looked at that in past commentaries.
Most homeowners own an appreciating asset with fixed, low monthly mortgage rates. With 60% of mortgages below 4%, the world is in a different place around the new vs. existing dynamics. We look at their issues in our housing macro commentaries for new and existing home sales (see New Home Sales Aug 2024: Waiting Game on Mortgages or Supply? 9-25-24, Existing Homes Sales Aug 2024: Mortgages Still Rule 9-19-24).
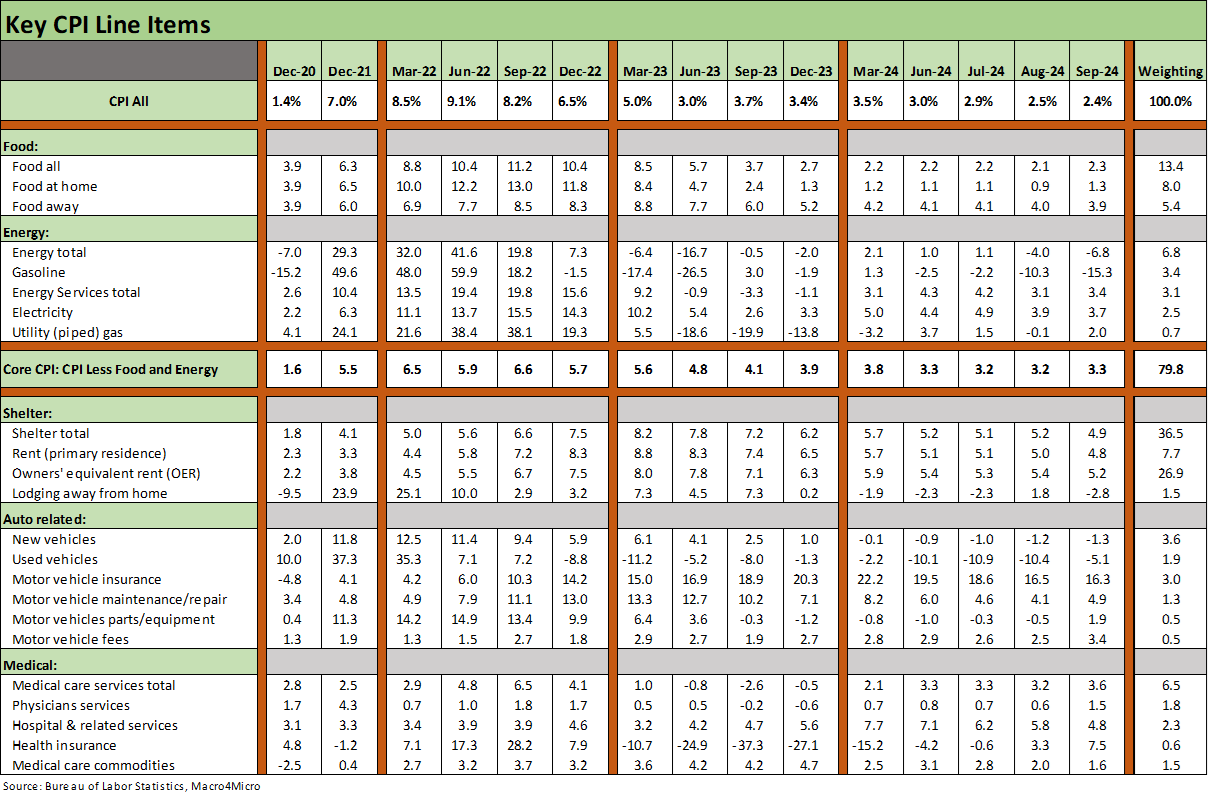
The above chart runs through our Big 5 buckets across Food, Energy, Shelter, Auto Related, and Medical. We see “Food all” tick slightly higher as Food at home ticked up more than “Food away” which moved slightly lower for Sept. Energy is in deflation mode to -6.8% for Sept, but oil is always a few bombing runs and a few hundred missiles away from a sharp rise.
The net effect of Core CPI was a sequential uptick to +3.3% from +3.2%, thus earning CPI the label “hotter than expected” when taken in tandem with the sticky Services and Shelter numbers. We already discussed Shelter in the prior section, but Services in general remains a drag at almost 2/3 of CPI.
We have focused on Automotive more than most by rolling up a range of related line items that make autos one of the most important CPI index categories for household economics (see Automotive Inflation: More than Meets the Eye10-17-22). The headlines around auto insurance remain ugly at +16.3% even if down from the highs. Both new and used vehicles are deflating with used cars straining affordability with higher contract rates pressuring monthly borrowing costs (see CarMax: Why Do We Watch KMX as a Bellwether? 10-3-24).
Medical Care Services CPI does not get enough focus since it is more about the fears of what lies ahead after the election than the current rates. That said, the move in Medical Services to +3.6% is one of the more notable increases in the CPI subsector checklist. That is up from +3.2% last month and 2% handles earlier in the year. Medical care commodities at +1.6% was good news, but the election period will bring a lot of noise in the home stretch about what the repeal of the ACA might mean even if cloaked in the “make it better” or “replace” language. Any changes will still need to get past the House and Senate.
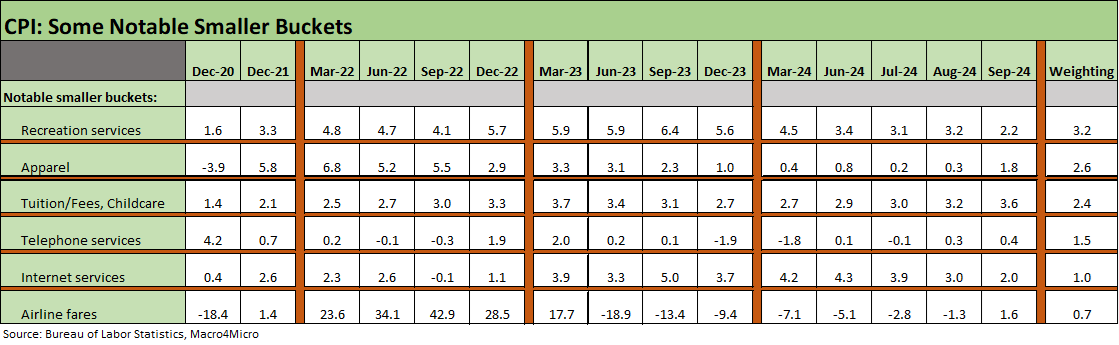
The above chart highlights some line items near and dear to many consumer households. Taken in tandem with the Big 5 in the prior charts, the mix totals over 86% of the CPI index. We see 4 of the 6 lines of the “add-ons” post rising YoY CPI with Recreation Services down and Internet down.
For an off-the-run piece of information in Recreation Services, Pet Services (including veterinary) runs at 0.44% weighting at +5.6% CPI with Pet Services at +7.3% and Vet Services at +6.7%. Pet Services were down MoM to -0.3% from +0.3% the prior two months. Cable, satellite, and live streaming posted a MoM rate of -0.2% from +0.2% the prior two months. Overall, Recreation Services hit recent lows.
See also:
HY OAS Lows Memory Lane: 2024, 2007, and 1997 10-8-24
Footnotes & Flashbacks: Credit Markets 10-7-24
Footnotes & Flashbacks: State of Yields 10-6-24
Footnotes & Flashbacks: Asset Returns 10-6-24
Mini Market Lookback: Cracking the 300 Line in HY 10-5-24
Payroll Sept 2024: Rushing the Gate 10-4-24
CarMax: Why Do We Watch KMX as a Bellwether? 10-3-24
Credit Returns: Sept YTD and Rolling Months 10-1-24
JOLTS Aug 2024: Openings Up, Hires Down, Layoffs Down, Quits Rate Down 10-1-24
Mini Market Lookback: PCE Tailwinds, GDP Holds Serve 9-28-24
State Level Economic Reality Check: Employment, GDP, Personal Income 9-28-24
PCE Prices Aug 2024: Personal Income & Outlays 9-27-24
KB Home: Steady Growth, Slower Motion 9-26-24
Lennar: Bulletproof Credit Despite Margin Squeeze 9-23-24
FOMC Action: Preemptive Strike for Payroll? 9-18-24
Credit Crib Note: United Rentals (URI) 9-16-24
CPI Aug 2024: Steady Trend Supports Mandate Shift 9-11-24
Inflation Timelines: Cyclical Histories, Key CPI Buckets11-20-23