
Footnotes & Flashbacks: State of Yields 9-29-24
A very quiet week along the UST curve masks the tension around the curve call and how the flattening might unfold from the front end.


The market was expecting more excitement for the 10Y UST…
The UST curve will get a fresh dose of intensive review with the payroll release this week after some color from JOLTS as the UST curve has fought the bulls on the longer end since the FOMC action (see FOMC Action: Preemptive Strike for Payroll? 9-18-24).
The PCE price index release was supportive on the inflation front for more easing, but the consumer sector saw some solid numbers in the mix including some state-level color in a Friday release on state GDP and state Personal Income trends (see PCE Prices Aug 2024: Personal Income & Outlays 9-27-24, State Level Economic Reality Check: Employment, GDP, Personal Income 9-28-24).
We update the 2Y to 10Y UST across time as the market awaits more action in the long end despite fears that the record deficits and funding needs and an uncooperative global demand backdrop might invoke those pesky laws of supply and demand.

The above chart updates the UST across the cycles from the 1978 Carter inversion on through 2006 before the credit crisis brought ZIRP and subsequent normalization attempts. The chart excludes the “Fed distortion years” after the crisis and into the pandemic and picks up the UST curves again at the tightening cycle peak (10-19-23 peak 10Y UST). As you look at the UST curves across history, the current UST curve is clearly extraordinarily low vs. the “semi-normal” monetary backdrops before the crisis ZIRP periods.
The UST curve chart collection for the past week is not showing much excitement as the market awaits payroll numbers. The latest round of releases from PCE and the final GDP print do not cover much new ground or change the calculus (see 2Q24 GDP: Final Estimate and Revision Deltas 9-26-24). The PCE release rolled in some major revisions that gave a very different read on savings rates as so many 3% handles of 2024 jumped up to 5% handles (see PCE Prices Aug 2024: Personal Income & Outlays 9-27-24).
The DPI vs. PCE data is always useful for color on the durability of the consumer, but the savings rate swing undermines part of the “consumers are running out of money” theme that pitches the “ticking clock theory” on the ability of the consumer to spend. The next round of payroll stats this week will add to the discussion even if there is no shortage of opinions on which payroll numbers allow the labor force to tread water vs. demographics.
The breakdown of trends by state that we posted this weekend covers 2Q24 personal income growth rates by state. Those numbers looked pretty solid by any measure. In a very intensive political year (ok, let’s call it a hate mongering festival), the use of facts seems to end on the 5th car of a 4-car train. Despite the fact free environment, the breadth of GDP growth by state in 2Q24, the high levels of personal income growth rates, and the abundance of states with 2% and 3% unemployment rates in August tell of a resilient and healthy, diversified economy even if there are ample metrics that signal some slowing.

The above chart updates the UST journey from the 10-19-23 peak. We post the 12-31-23 UST curve and current curve. The YTD migration has shifted dramatically after spending a good part of the year higher before the 2H24 shift lower. The UST deltas are broken out in the box. The bull steepener is clear enough with the 30Y UST slightly higher. Many in the market at the start of the year were calling for bigger moves all along the curve and much lower rates on the front end by now.

The above chart updates some of the key time periods across the migration. Our focal point in this chart is the convergence of the 10Y UST at the end of 2022 and end of 2023 despite the 100 bps fed funds differential. That convergence in the 10Y remains our gut check on the 10Y UST and how it might move as fed funds come down. The 2022-2023 experience challenges assumptions about the 10Y following the fed funds in lockstep. Such a move would require a recession.
The rhetoric around “cutting rates” in half in the political sphere seldom clarifies what section of the UST curve segment such proclamations are referring to. The Fed controls the short end, and the market controls the long end. The issues around deficits, UST supply and demand, the risks of the dollar and how that will affect global flows also get caught up in recent threats against those countries questioning the dollar as the reserve currency of choice.
Threatening those nations with triple digit tariffs could be a self-fulfilling prophecy to not add UST exposure when incremental demand is needed for UST borrowing. Even selling UST is a legitimate response to tariffs and trade penalties. Threatening your way to more retaliation could even accelerate the plans around an alternative multinational BRICS currency (digital or otherwise).

The above chart updates the muted weekly UST deltas. We looked at the week’s action already (see Mini Market Lookback: PCE Tailwinds, GDP Holds Serve 9-28-24). As we covered in that piece, the weekly bond ETFs were laggards as duration did not get a reward from the macro releases on the week. We will be out with our full asset return Footnotes commentary later.

The above chart offers an updated view on the bull steepener YTD. Bonds have regained some solid footing after a rough start.

The above chart updates the deltas from the 10-19-23 peak as 2023 ended up with very strong performance for duration, equity risk, and credit risk. Equities and credit spreads were home runs in the Nov-Dec 2023 rally (see Footnotes & Flashbacks: Asset Returns 1-1-241-1-24).
Duration got back on track in recent months of 2024 after a very rough start. For markets such as HY bonds, the spread rally to close out 2023 was impressive. We are modestly inside those levels to end this week.

The above chart details the Freddie Mac 30Y mortgage rate benchmark for the latest benchmark release at 6.08% for a two-year low. That is set against a 52-week average of 6.89% and a 52-week range of 6.08% to 7.79%.
In the interest of historical frames of reference, we also include the Freddie Mac benchmarks for the peak homebuilding year of 2005 and then for mid-2006, when the RMBS structures were starting to roil the markets and generated worries around asset quality risk. We also include a UST curve for each period.
At this point, the UST curve is in a very different zip code than 2005 and 2006 while still seeing mortgages at a 6% handle. That feeds the optimism for a migration to 5% handle mortgages into 2025. With a shortage of available supply of affordable new homes, that plays to the homebuilder story given their intrinsic ability to provide mortgage financing incentives and fee relief.
This week we saw some Aug 31 reporting Homebuilder companies that painted a picture of steady growth in revenues and some trade-offs of margins vs. volumes depending on the strategy of the builder on pace vs. price. We heard from Lennar and KB Home with continued optimism around demand and revenue prospects with mortgage rates clearly a swing factor but not a barrier (see KB Home: Steady Growth, Slower Motion 9-26-24, Lennar: Bulletproof Credit Despite Margin Squeeze 9-23-24).

The above chart updates the 2Y UST to 10Y UST slope as the market has upward sloping UST curves from 2Y and 5Y. The UST slopes from the 3M UST (3M to 5Y, 3M to 10Y) are materially inverted. The short end starting point slopes have a long way to go in order to get even remotely close to normal relative to the current inversion.

The above chart frames the shorter timeline for 2Y to 10Y from Jan 2021 during ZIRP, across the tightening cycle to a peak inversion of -108 bps in July 2023 and then back to upward sloping in 2024.
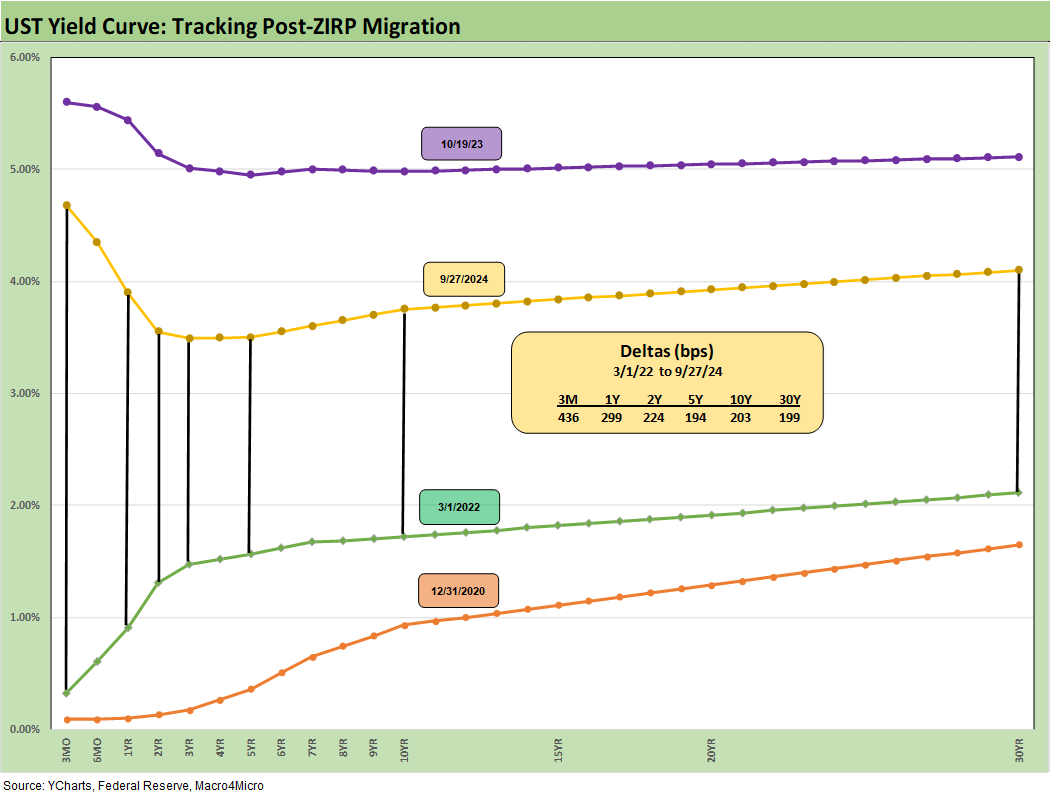
The above chart wraps this week’s State of Yields with an update of the running UST deltas from March 1, 2022, the month that ZIRP ended, and the tightening cycle began. The migration from ZIRP and upward sloping into a bear flattening and then a bear inversion is starting a slow process of undoing the front-end inversion. The journey to flat on 3M to 5Y is a long way off.
See also:
Mini Market Lookback: PCE Tailwinds, GDP Holds Serve 9-28-24
State Level Economic Reality Check: Employment, GDP, Personal Income 9-28-24
PCE Prices Aug 2024: Personal Income & Outlays 9-27-24
KB Home: Steady Growth, Slower Motion 9-26-24
Durable Goods Aug 2024: Waiting Game 9-26-24
2Q24 GDP: Final Estimate and Revision Deltas 9-26-24
New Home Sales Aug 2024: Waiting Game on Mortgages or Supply? 9-25-24
Lennar: Bulletproof Credit Despite Margin Squeeze 9-23-24
Footnotes & Flashbacks: Credit Markets 9-23-24
Footnotes & Flashbacks: State of Yields 9-22-24
Footnotes & Flashbacks: Asset Returns 9-22-24
Mini Market Lookback: FOMC Week 9-21-24
FOMC Action: Preemptive Strike for Payroll? 9-18-24
Home Starts Aug 2024: Mortgage Rates to Kickstart Hopes Ahead? 9-18-24
Retail Sales: Down to the Wire? 9-17-24
Industrial Production: Aug 2024 Capacity Utilization 9-17-24
Consumer Sentiment: Inflation Optimism? Split Moods 9-13-24