Industrial Production: Aug 2024 Capacity Utilization
Mixed but constructive and sequentially better cap ute numbers do not make the story easier for deeper FOMC cuts.
Trade rep training camp ahead of election…
With industrial production higher in August, headline industry capacity utilization numbers ticked higher as did total manufacturing and durables while nondurables eased slightly with mining up and utilities slightly down.
Total manufacturing capacity utilization is bumping along modestly below the post-1972 average, but that is for a manufacturing sector with much lower breakeven volumes now and more efficient operations today even if that is only a silver lining in the mediocre run rates.
Tariffs could support some manufacturers on pricing but hurt more on costs as inputs tied to global supplier chains get damaged. The lag time to correction could be forever and instead bring layoffs, reduced capex, and downsizing.
For the manufacturing sector looking ahead, blanket tariffs will be the latest case of Washington “picking winners and losers” depending on how any given manufacturer was structured across the decades. Companies will be forced to work the backrooms in D.C. and kowtow (or donate) to influence decision makers.
The above chart updates the running total manufacturing capacity utilization from 1967 to the current levels. The cyclical pain periods are evident as are the peaks during cycles when many companies were struggling with profits even with those lofty “cap ute” levels (notably in the later 1970s) based on cost and efficiency challenges. The lower levels of recent cycles stand out as a trend as we cover in the expansion vs. recession breakdowns in charts further below.
The above chart tracks some headline level capacity utilization trends across total industry, total manufacturing, durables vs. nondurables, and mining vs. utilities. We also look at month-on-month and YoY deltas. MoM frames up well enough but YoY metrics show the slowing.
The sequential trend shows Total Industry, Total Manufacturing, and Durables higher, and that is enough for us to call it favorable given the intrinsic multiplier effects that come with the Durables chain. That whole idea of a “chain” is where the tariff uncertainty comes into play into 2025 as the policy questions work through the political machinery subject to the White House occupant.
The above chart tracks some of the larger industry groups, and those are a mixed bag looking at both MoM and YoY. The good news is that 4 of 5 Durables are higher sequentially for the month with 3 of 5 down YoY. In Nondurables, it was a slight move and a split decision for the two largest sectors.
The volatility in Motor Vehicles stands out across timelines around labor events and production rate issues. Motor Vehicles remain below the long-term averages either way and are below where 2024 started ahead of spring selling season. Aerospace has a cloud over it at this point with Boeing. Capital goods generally have been easing at this stage of the cycle.
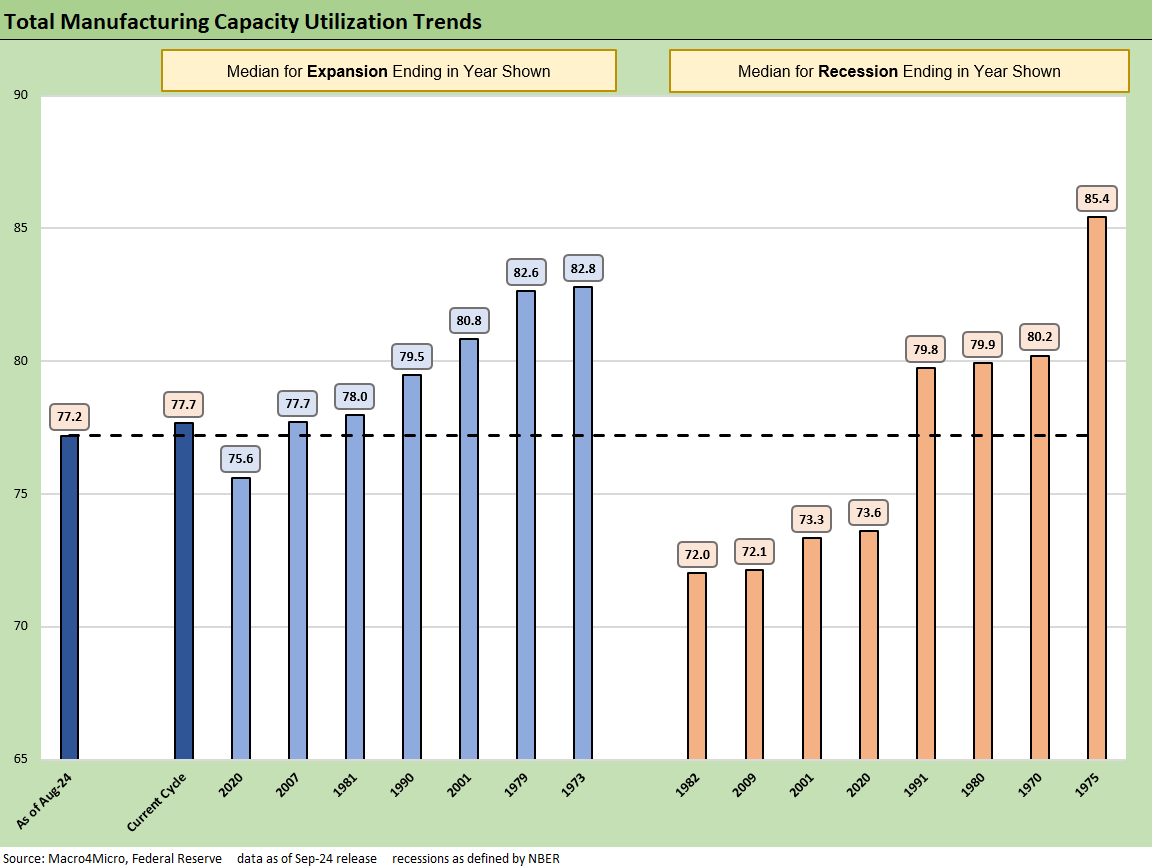
The above chart offers some of the raw data across the expansions and recessions for a frame of reference to today’s run rates. The 77.2 posted in Aug 2024 is well below numerous past recessions with some notable exceptions. The 1980-1982 double dip and the post crisis recession through June 2009 (the longest since the Great Depression) are very weak, but the 1969-1970, 1973-1975 and Jan 1980-July 1980 numbers underscore the problems of that period in cost structures.
We don’t need to revisit the material covered routinely in past commentaries. However, a critical factor in the profitability of the manufacturing sector is the lean manufacturing chains (typically global in scale) that have evolved and allowed companies to be more profitable at lower utilization rates are now in the policy crosshairs. A wide range of industries (notably autos and cap goods) could be under siege in a world of blanket tariffs. The idea that such an overlay would inspire widespread capex increases based in the US is in many cases an assumption wrapped in a fantasy.
The above chart offers another angle on the expansion and recession history and how today’s cap ute rates frame up (Aug 2024 on the left). In historical context, cap ute is low. The questions are “What does that mean in a high tariff environment for cost structures and input costs” and “How will retaliation affect these numbers in a trade clash scenario with our largest trade partners?” (see Tariffs: Questions that Won’t Get Asked by Debate Moderators 9-10-24, Facts Matter: China Syndrome on Trade 9-10-24)
See also:
Credit Crib Note: United Rentals 9-16-24
Footnotes & Flashbacks: Credit Markets 9-16-24
Footnotes & Flashbacks: State of Yields 9-15-24
Footnotes & Flashbacks: Asset Returns 9-15-24
A Strange Policy Risk Week: Mini Market Lookback 9-14-24
Consumer Sentiment: Inflation Optimism? Split Moods 9-13-24
CPI Aug 2024: Steady Trend Supports Mandate Shift 9-11-24
Facts Matter: China Syndrome on Trade 9-10-24
Tariffs: Questions that Won’t Get Asked by Debate Moderators 9-10-24
Footnotes & Flashbacks: Credit Markets 9-9-24
Another Volatile Week: Mini Market Lookback 9-7-24
August 2024 Payrolls: Slow Burn, Negative Revisions 9-6-24
Trump's New Sovereign Wealth Fund: Tariff Dollars for a Funded Pool of Patronage? 9-5-24
Goods and Manufacturing: Fact Checking Job Rhetoric 9-5-24
Construction Spending: A Brief Pause? 9-3-24
Labor Day Weekend: Mini Market Lookback 9-2-24
PCE July 2024: Inflation, Income and Outlays 8-30-24
2Q24 GDP 2nd Estimate: The Power of 3 and Cutting 8-29-24
Harris Housing Plan: The South’s Gonna Do It Again!? 8-28-24
New Home Sales July 2024: To Get by with a Little Help from My Feds? 8-25-24
All the President’s Stocks 8-21-24


