
JOLTS Aug 2024: Openings Up, Hires Down, Layoffs Down, Quits Rate Down
We update a constructive JOLTS report with its 1-month lag ahead of the more current payroll numbers out Friday.


“Little changed…that’s all I have to say about that.”
The JOLTS release was still dominated by the words “little changed” and “changed little” with the directional moves mixed as Job Openings were higher and back to 8.0 million with Hires down, Layoffs/Discharges down, and Quits down.
The Job Openings number is still above the pre-COVID cyclical peak of Nov 2018 in an unusual pattern when payroll run rates have been fading and a fresh gut check coming Friday.
Trade, Transportation and Utilities showed the biggest decline in Hires during August with Professional and Business Services the biggest uptick.
The -6.5% sequential decline in Layoffs/Discharges showed little in concentration themes with the highest category (Health Care and Social Assistance) dwarfed at a material multiple by Hires on the same occupation line.

The above time series updates the state of Job Openings data and related disclosure. The numbers and themes are a lot like last month (see JOLTS July 2024: Mixed Bag, Hires Up, Layoffs/Discharges Up, Quits Flat 9-4-24) except the Openings are higher.
With payroll dead ahead on Friday, we will get a more current set of numbers than the 1-month lag on JOLTS. Last month, payroll was positive but part of a trend toward lower rolling averages that helped fortify the FOMC to pull the trigger on -50 bps (see August 2024 Payrolls: Slow Burn, Negative Revisions 9-6-24).
The above chart shows Openings higher in a sequential rise that still exceeds the earlier peaks under Trump that occurred in Nov 2018 at 7.5 million. The year 2018 was a very bumpy one for the markets (see HY Pain: A 2018 Lookback to Ponder 8-3-24, Histories: Asset Return Journey from 2016 to 2023 1-21-24) as tariffs roiled the markets, and the FOMC had to come to the rescue with 3 cuts in 2019 ahead of COVID and a return to ZIRP.
The payroll trends now have pole position at the FOMC with inflation possibly “passing on the inside” in 2025 if tariffs have their natural Newtonian effects in end market prices or the Middle East turmoil on the screen today sets oil prices ablaze again on Iran actions. The mix of new risks from tariffs and mass deportation are still not reflected in risk pricing and are not showing up in Job Openings either.
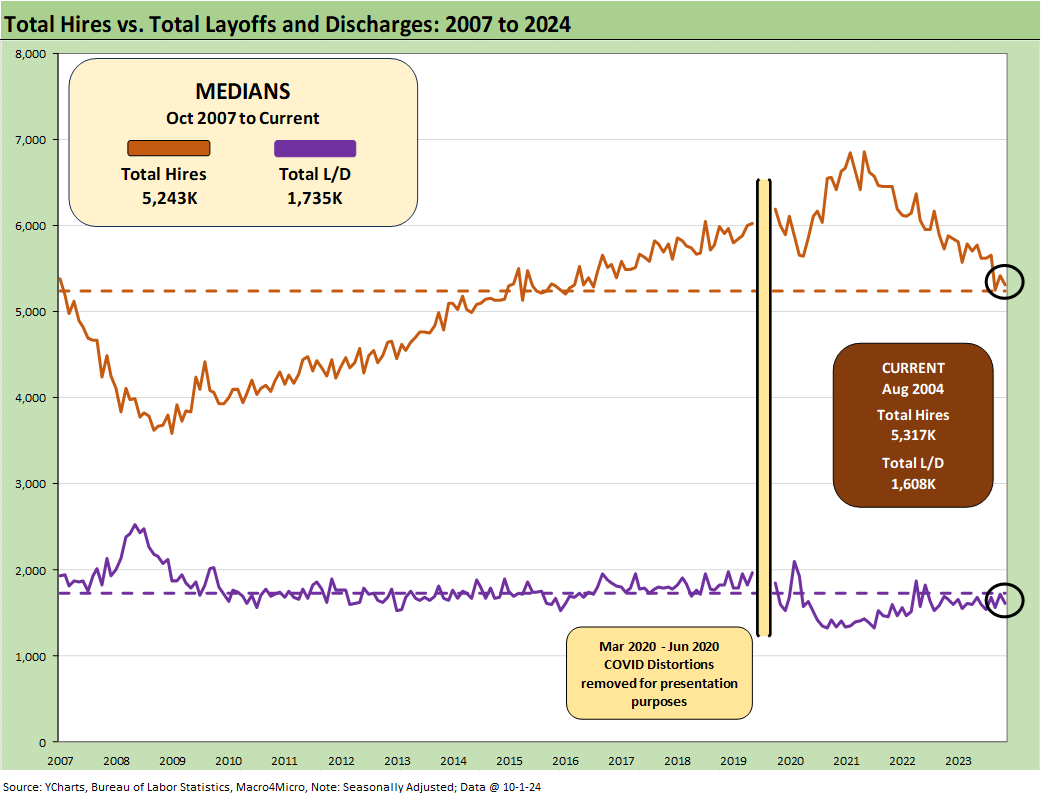
The above chart updates the run rates with total Hires running above the long-term median from 2007 and running below the median for layoffs. We remove the distortions of the COVID period from the charts to improve visuals. We address those in a boxed commentary further below.

The multiple for Hires vs. Layoffs/Discharges are plotted above with the 3.3x ratio above the long-term median of 3.0x. The recession saw a 1.54x ratio back in April 2009 near the recession trough.

The above chart plots Total Hires vs. Total Separations, which includes Quits, Layoffs/Discharges, and “Other Separations” (retirement, death, disabilities, relocation, etc.). We detail Quits further below, which declined to 3.08 million in August from 3.24 million in July. We see Total Hires above the long-term median. Total Separations are running below the long-term median.
We removed the COVID distortions from this chart also, which we address in the next chart.
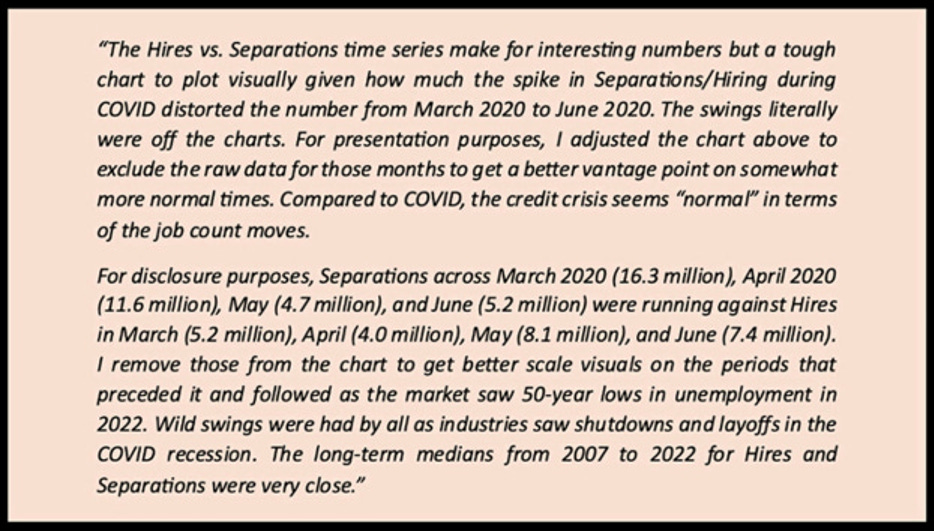
The above chart revisits the insanely high numbers for Separations seen during COVID in March and April of 2020. That was followed by the multimillion swings in the ensuing process of rehiring. You can see why we adjust the time series charts to avoid minimizing and impairing the visual trend patterns in what can be material numbers in normal markets.
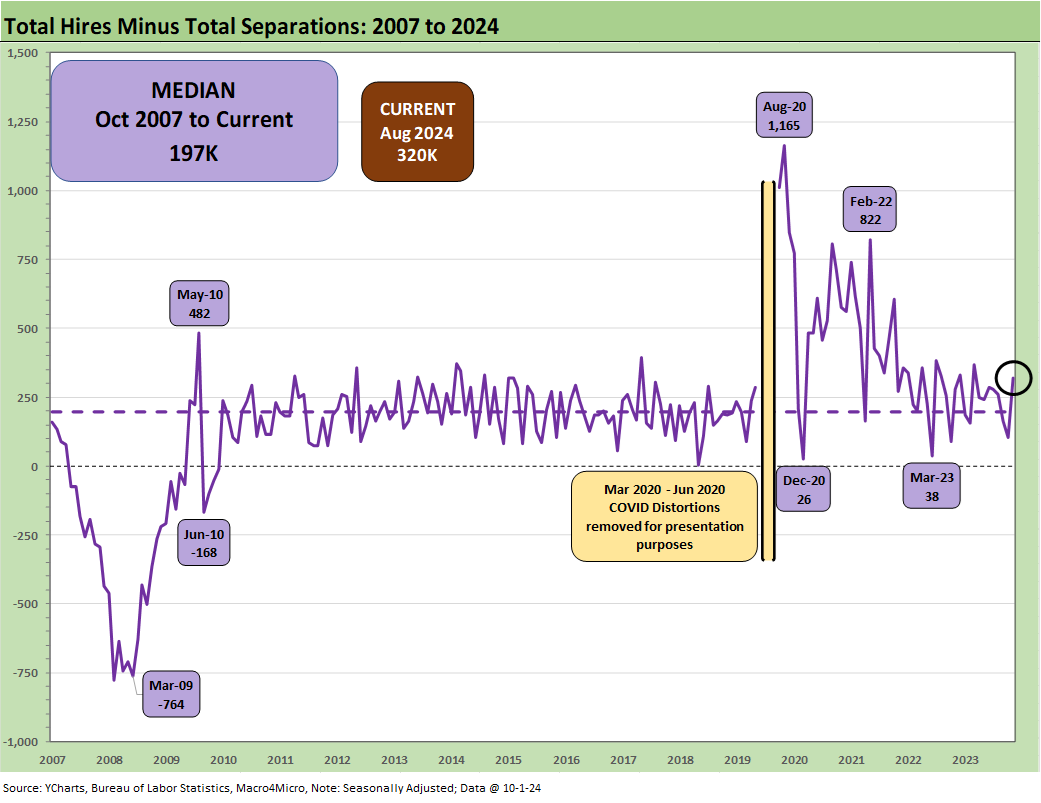
The above chart plots Hires minus Separations, and the current +320K is running well above the median of 197K. The post-crisis bottom was -764K at the worst of the downturn in a month when the S&P 500 also hit a low.

The above chart shows the mix of Quits in the overall Separations at 61.7% or above the long-term median of 57.4%. Though down by -4.9% (SAAR), Quits are still quite busy and notably in lower paying services jobs.
The oft cited “Quits rate” (Quits as a % of Total Employment) ticked lower to 1.9% (SAAR) from 2.0% in July and 2.3% in Aug 2023. That fits in with the theory that Quits decline when confidence of finding a job is lower. The fact that Openings are higher gets back to questions of “mix” whether regional or occupational.
Lower confidence levels have been part of a recurring theme in the data of late. On a not seasonally adjusted basis, the Quits rate was 2.5%, up from 2.4% in July 2024 but down from 2.9% in Aug 2023.
See also:
Footnotes & Flashbacks: Credit Markets 9-30-24
Footnotes & Flashbacks: Asset Returns 9-29-24
Footnotes & Flashbacks: State of Yields 9-29-24
Mini Market Lookback: PCE Tailwinds, GDP Holds Serve 9-28-24
State Level Economic Reality Check: Employment, GDP, Personal Income 9-28-24
PCE Prices Aug 2024: Personal Income & Outlays 9-27-24
KB Home: Steady Growth, Slower Motion 9-26-24
Durable Goods Aug 2024: Waiting Game 9-26-24
2Q24 GDP: Final Estimate and Revision Deltas 9-26-24
New Home Sales Aug 2024: Waiting Game on Mortgages or Supply? 9-25-24
Lennar: Bulletproof Credit Despite Margin Squeeze 9-23-24
Footnotes & Flashbacks: Credit Markets 9-23-24
Footnotes & Flashbacks: State of Yields 9-22-24
Footnotes & Flashbacks: Asset Returns 9-22-24
Mini Market Lookback: FOMC Week 9-21-24
FOMC Action: Preemptive Strike for Payroll? 9-18-24
Home Starts Aug 2024: Mortgage Rates to Kickstart Hopes Ahead? 9-18-24
Retail Sales: Down to the Wire? 9-17-24
Industrial Production: Aug 2024 Capacity Utilization 9-17-24
Consumer Sentiment: Inflation Optimism? Split Moods 9-13-24