
State Level Economic Reality Check: Employment, GDP, Personal Income
We update state data on employment, GDP growth, and personal income for a reality check on right-wing propaganda on the economy.


Trust in me…the economy is terrible…
The idea that partisan state and local politicians might be utterly full of crap is not a late-breaking news item, but we revisit the Friday BEA release of state GDP growth data and personal income numbers by state while dropping in some recent unemployment rates.
The easy takeaway is that some of the best economic performances are seen in some of the noisiest partisan states, the same ones bemoaning the dystopian economic Armageddon of the US. These are the same ones supporting Trump stories of Congolese asylum escapees parachuting in to cast millions of votes in swing states (and dine at the local pet stores).
In this note, the sum-of-the parts in state employment, GDP and personal income meet sum-of-the-BS nonsense. It gets crazier (and meaner) by the day.
Unemployment rates by state are almost all well below the 5% handle unemployment medians seen from 2009, from the 1994 Fed mega-tightening, and from 1972. We see13 states posting 2% handle unemployment rates in Aug 2024 and another 18 posting 3% handle unemployment rates vs. the 5% long-term handles on medians. Bad economy? In what numerical system?
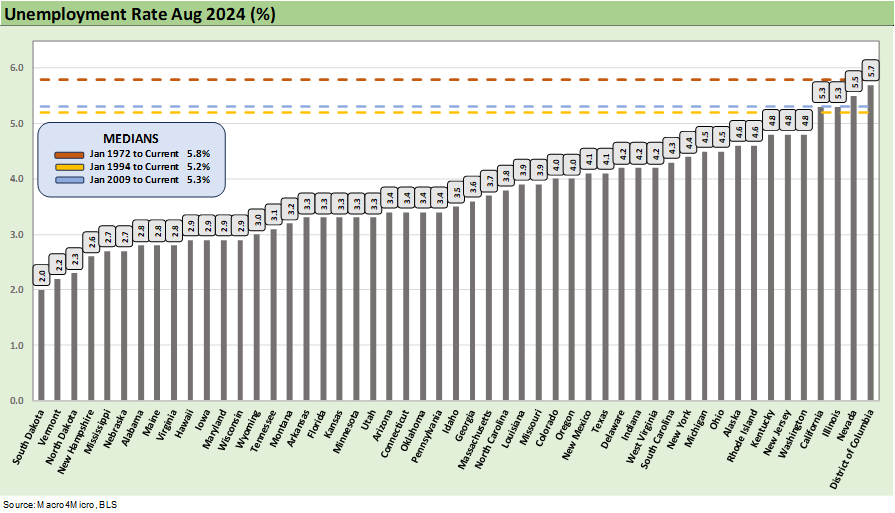
On Friday, the Bureau of Economic Analysis (BEA) published its breakdown of GDP and Personal Income by State for 2Q24. We also dug out the state-level unemployment rates for August and detail those above.
We include horizontal lines showing timeline medians going back to the crisis period of 2009, the period from the 1994 fed tightening on across the TMT bubble years and into the new millennium years, and the long-term time horizon that includes the ugly 1970s stagflation periods and double dip of 1980-1982 as Volcker put the hammer down.
The easy visual conclusion is that unemployment rates are exceptionally low with just over half the states posting 2% and 3% handles (13 states at 2% and 18 at 3%). By any standard, those are exceptionally strong employment numbers.
In the 1990s, the debate around “full employment” level often ended up in the 4% to 5% handle range at the national level (the 94% to 96% range for employment was an easy rule of thumb). Almost all the states above are in that range although each state would have its own dynamics.
The very low 2% handles and low 3% unemployment numbers do raise a few questions:
Will economic growth be limited in those states with extremely low unemployment numbers as they “need more bodies” to do more work and grow?
Will the ability of some states (e.g., North Dakota in energy) with less diversified economies face intrinsic growth limits on tight labor supply and reluctance of companies to expand in such states with light availability of workers?
When Field Marshal Miller and his merry band of brownshirts start doing mass deportations in tandem with a military force, will some states and industries and communities see labor shortages that flow into the lower price tier of labor jobs and fuel renewed wage inflation?
How does one expand the housing stock with extremely low unemployment and semi-skilled and skilled workers to do the building? (Anyone who has been around homebuilders are well aware of the high mix of Hispanic employees).
Will mass deportation lower shelter inflation on the Trump theory that creating more vacancies for more “living space” (a little too close for comfort to the troubling prewar term “lebensraum”) via mass deportation? Does that theory assume all of the deportation targets are homeowners? (They must be productive economic contributors for that!) Or will it imply just higher wage inflation on manpower shortages?
There is a lot to unpack from these very low unemployment rates for states that want more economic growth and to attract businesses to those states who will need more workers to deliver that growth. This gets back to Ronald Reagan’s final speech of his two terms when he chose “immigration” as the topic. Reagan was old and fading, but he was still younger at the end of his second term than Trump is now!

The above chart is simple enough. It ranks personal income growth for 2Q24 by state. Those high growth rates on the left include a lot of red states. The income growth is catching up with inflation and is now ahead of it, but purchasing power is still in the hole in terms of affordability against the cumulative rates of inflation (the repriced menu). The inflation rates are moving in the right direction and so is income (see PCE Prices Aug 2024: Personal Income & Outlays 9-27-24, CPI Aug 2024: Steady Trend Supports Mandate Shift 9-11-24).
As we look at the states leading in personal income growth in 2Q24, we see the top 10 made up of 7 deep red states, 1 swing state (Michigan) and 2 blue states (CA, NY). Within the Top 10, 9 of the 10 posted 6% handle growth in income and well over half the states are at 5% or higher.
As a reminder, the CPI for “all items less shelter” weighed in at +1.1% in August, so the fact that Harris has big ambitions for addressing housing affordability is a major positive. That plan would face a high risk of failing if it is not approached like a national emergency that cuts across both sides of the aisle and enlists the builders and contractors down to the guys in the field and dealing with labor shortages. If Harris gets swept up in Warren-Sanders-style attacks on investment capital flowing into new housing stock (build to rent, etc.), the plan is doomed by joining a de facto attack on builders, contractors, and subcontractors.
Trump has no plan, and Harris still needs a lot more infill (see Harris Housing Plan: The South’s Gonna Do It Again!? 8-28-24). Housing is very complex and cuts across many layers of the economy from global supply chains to mortgage finance. At least Harris has been more vocal in raising the topic of supply in her speech the past week, and any viable plan will need bountiful incentives for builders and the supply chain if it is to succeed.
Trump has no plan for shelter at this point other than freeing up space via mass deportation. That is just the reality of his priority issues tied to immigration as well as his limited capacity to grasp the range of housing sector issues. You cannot shout your way through it but he’ll try.
As we look at the personal income growth rates above, it is also worth keeping in mind that Medical Care Services CPI is now at +3.2%. The issue of pharma prices and services cost when households lack coverage is a major bucket of worry for consumers covered by the ACA. Many believe Trump would seek to repeal the ACA regardless of the timing of a replacement (so do we). Preexisting condition coverage also came under siege this week by JD Vance, so the personal income numbers above can evaporate very quickly with such household expense burdens and inflation risks.

The above chart shows the 2Q24 real GDP growth rates by state. The current dollar GDPs were all higher, but Alaska fell into contraction on a real basis. We see a split down the middle on those posting at or over the +3.0% national GDP level and those below 3.0%. That 3.0% line for the entire US is just for the 2Q24 period, but Trump reached that level on an annual basis only once (2018) in his entire term. The 2018 year was a terrible year for the market despite Trump’s best GDP year (see HY Pain: A 2018 Lookback to Ponder 8-3-24). The Fed was forced to ease in 2019. Trump averaged a 2% handle average GDP growth rate across his first 3 years before COVID (see 2Q24 GDP: Final Estimate and Revision Deltas 9-26-24).
Of the 7 states above the 4% line in the chart above, we see red states at #1 through #5 and two swing states (Michigan and Wisconsin) at #6 and #7. The three states with 5% handles are red states.
Of the clearly red states in the upper half at +3.0% or higher, we see 15 red states and 6 swing states with 4 blue states. That is interesting math on the political bias of the higher growth economies in red states. They can take all the credit they want for superior economic management of their states, but they sure cannot extrapolate that to the horrors on the Biden economy as their spin attempts to reshape reality for political purposes.
They could be saying (if they were honest, which they clearly are not) that the “economy could be much better run than it is now, and we could do better.” That was the kind of balanced approach that made the 1980s and 1990s work so well. Today is all about maximizing division to solidify power. We call this “making sh*t up.” Others call it dishonesty or lying.
Glenn Reynolds, CFA glenn@macro4micro.com
Kevin Chun, CFA kevin@macro4micro.com
See also:
PCE Prices Aug 2024: Personal Income & Outlays 9-27-24
2Q24 GDP: Final Estimate and Revision Deltas 9-26-24
CPI Aug 2024: Steady Trend Supports Mandate Shift 9-11-24
All the Presidents’ Stocks 8-21-14
Presidential GDP Dance Off: Clinton vs. Trump 7-27-24
Presidential GDP Dance Off: Reagan vs. Trump 7-27-24
State Unemployment: A Sum-of-the-Parts BS Detector 6-30-24
Employment: Real Numbers vs. Fictitious Dystopian Hellscapes 3-9-24
Employment Across the Presidents 8-15-23