
Footnotes & Flashbacks: State of Yields 10-13-24
We look at another challenging week for yield curve bulls and bond returns after a mixed CPI report.


Will Rogers (on economics or politics or both):
“The one way to detect a feeble-minded man is get one arguing on economics…”
“Theories are great, they sound great, but the minute you are asked to prove one in actual life, why the thing blows up…”
“When ignorance gets started, it knows no bounds…”
We look at the latest round of mild setbacks for the duration trade as bonds keep underperforming with the bear steepener of the past week falling harder on long duration bonds and the short end more muted in UST deltas (see Footnotes & Flashbacks: Asset Returns 10-12-24).
With a warm-but-not-too-hot CPI this past week, the second-guessing on Fed moves will not go away, and this week brings a fresh Retail Sales number that usually gets a lot of market attention (see CPI Sept 2024: Warm Blooded, Not Hot 10-10-24)
We also get Industrial Production this week for another read on manufacturing at a time when there is a cloud of uncertainty over what capex plans will look like for 2024 with the massive tariff threat hanging over the heads of capital budget planners. They can look back to the defensive moves of 2018-2019 that ended up needing a few FOMC cuts to get back on track.

The above chart tracks the timelines for UST curves across the cycle from the 1978 Carter inversion through this past week. We include important dates for yield curves before the crisis of 2008 and after the tightening cycle of 2022 commenced. We also include the recent peak date for the 10Y UST on 10-19-23.
The goal is to show the history across “normal” monetary and economic cycles. There was nothing normal about the monetary cycle that was part of the credit crisis and a systemic rescue and ZIRP rates or a mass pandemic for the first time in a century. The 13+ year stretch from the crisis to the tightening cycle has distorted memories and frames of reference. We are in theory back in a “new, old world.”
We exclude the post-crisis, post-ZIRP periods where the UST was “artificially” managed lower by the Fed – including during the normalization period from Dec 2015 through Dec 2018 and later the arrival of the COVID period (March 2020) and a return to ZIRP. We include UST curves that are outside the post-crisis Fed support since we have officially put those years behind us with the inflation fighting period from March 2022 when COVID-related ZIRP ended.
We also do not include UST curve action with the FOMC cuts of 2H19 in the chart since that in theory was still part of the normalization timeline. The cuts marked a reversal of that normalization to support the economy in the face of the 2018-2019 market fallout from Trump tariffs (see HY Pain: A 2018 Lookback to Ponder 8-3-24, Histories: Asset Return Journey from 2016 to 2023 1-21-24).
The Trump “economic miracle” sales pitch over his “greatest economy in history” tends to skirt over those two years of 2018-2019 and the FOMC actions. All you need to do is read an FOMC statement in 2019 (“business fixed investment and exports remain weak”). Inflation was low in that period, but the economy was weakening and needed support.
The Fed statements are always politically measured, but the tariffs caused a lot of chaos that was part of the lag time effects on inflation that were severely worsened when supplier chains were slammed in 2020-2021. There were more than a few economists at the time saying the benefits of the tax cuts for corporations and equipment capex incentives were undone by the tariffs. One theory is that if Trump cut taxes and went to the pool at Mar-a-Lago he would have won his election and kept control of Congress.

The shift in the yield curve from the 10Y UST peak (10-19-23) and the YTD 2024 moves are captured in the above chart. For a material part of 2024, YTD UST deltas showed the UST curve higher and duration taking a beating before the summer and early fall rally. The past month has reversed course and turned into a nasty bear steepener after an initial bear flattener when the 2Y UST moved sharply higher initially on “payroll day” relative to the 10Y UST (see Footnotes & Flashbacks: State of Yields 10-6-24).
If we only look back a few weeks to mid-Sept (9-13-24), we see a 3.66% 10Y UST and 3.57% 2Y UST. Just a month ago, we see a very different-looking UST shape and deltas (see Footnotes & Flashbacks: State of Yields 9-15-24).
The duration call generally has been a very difficult one as the economy and notably the consumer sector has held in well. The banking sector generally stayed healthy (with the few regional bank exceptions), and the credit cycle saw steadily favorable risk pricing even to the point of high yield getting back into the past spread low period of 2007 and 1997 (see HY OAS Lows Memory Lane: 2024, 2007, and 1997 10-8-24). UST bulls have had a tough ride.

The above chart revisits our recurring reminder that recent history in this tightening cycle reminds us to not get cocky around the 10Y UST tracking lower with fed funds. The 100 bps in fed funds differential seen in 12-31-22 and 12-31-23 did not stop the 10Y UST area from converging as noted in the chart. So far, the FOMC cut has not done much for a sustained UST rally and has even gone the other way.
UST supply pressure is the only guarantee in life…
With Trump making Harris look like a fiscal conservative “grading on the deficits curve” the supply of UST will not be hard to come by and that obviously will need a market clearing yield. Both candidates will send borrowing needs soaring but Trump policies especially so. The poorly articulated and mixed views from Trump and JD Vance around “the dollar should be weaker” is not exactly a UST recruiting poster for offshore demand.
If the decision is made to launch an all-out tariff war, that could whittle down China demand or lead to an outright downsizing of China holdings. China and its group of BRIC currency advocates are recruiting even more nations to challenge the dollar. They are also moving to avoid sanction risks. Trump made it clear that anyone who challenges the dollar will get smacked with a tariff. For any remotely interested student of history, China and Russia are hard to intimidate and China especially can recruit support with their economic scale.
Trump likes wielding tariffs as leverage in negotiation, but he is using tariffs like a rogue third grader at recess with a squirt gun. The 2018-2019 history does not include many success stories that did not come at great cost. The farm belt (see last cycle’s bailout), the global supplier chain (unit costs higher), exports (retaliation), and UST curve could all suffer when inflation expectations shift (as they should). The USMCA (former NAFTA) could get terminated and Trump has said as much.
Harris has spoken more of revision and review in 2026 under the scheduled review program. Political posturing could elicit more hard line talk from all, making life more challenging for Canada in an election year also. Mexico has new leadership that cannot look weak and cowed by threats.
The tariff threat on such a massive scale is a very serious risk. There are unit cost ramifications for companies and their supplier chains (Mexico and China the two largest importing nations, EU largest importing bloc), price impacts for consumers (buyer pays), funding impacts for the UST (higher supply needs to attract demand with yields), market risks to manage (and hedge) for investors (currencies), and export threats on retaliation.
That laundry list of risk factors is a reason Trump is ducking tough interviews and follow-up questions or fact checking. He could be asked questions on all those topics by serious journalists (hard to find in the corporate media crowd these days). He simply could not answer the questions or demonstrate a sound thought process on his morphing policy views (Did I say 100% tariffs? I meant 200%, etc.).

The above chart offers another visual angle on the 1-week UST delta. The move was not dramatic as a steepener, but the effects were adverse for bond fund ETFs.

The above chart shows the YTD deltas with the short end following the lower rates theme, but the long end is fighting the favorable expectations and notably in 10Y and 30Y.

The above chart frames the running UST deltas from the 10-19-23 peak date that was running alongside a material rally in equities and credit spreads in Nov-Dec 2023. As the crow flies, this is a material downward shift with the lingering anomaly on the front end of an extraordinary inversion. That leaves plenty of room for the 3M and 6M to move lower in an easing cycle, but the funding demands in total will remain extreme.
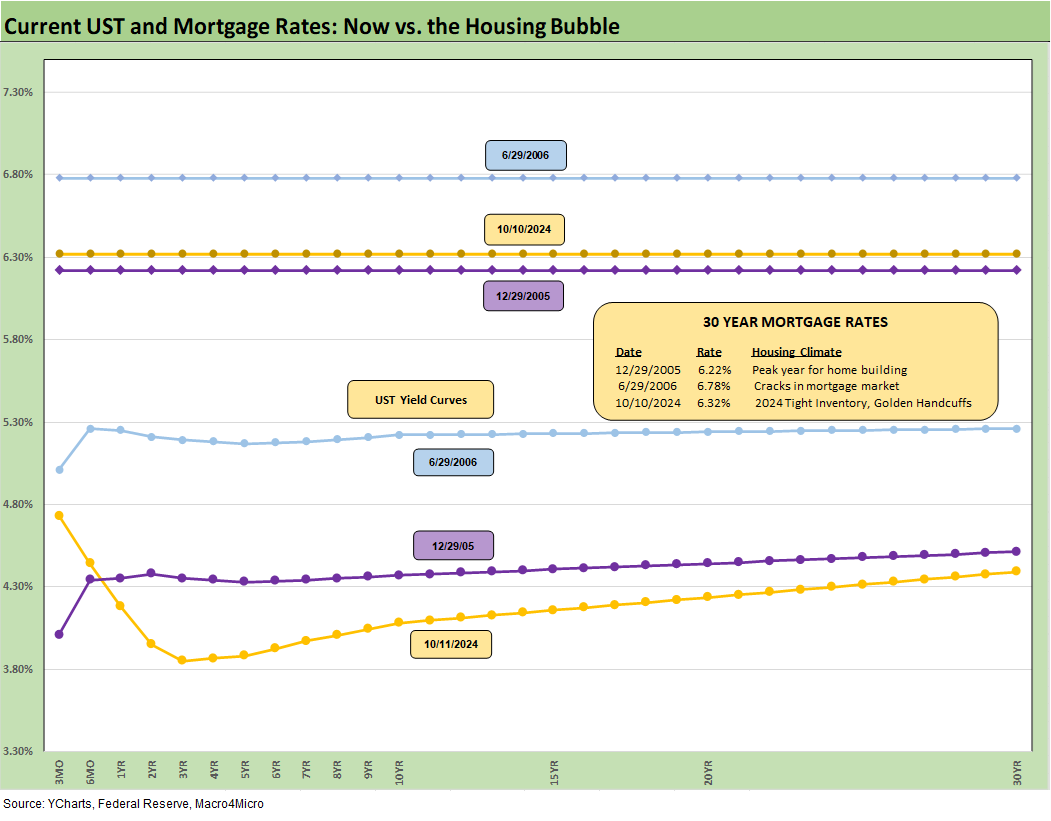
The above chart updates the latest Freddie Mac benchmark 30Y UST rates. After an eventful few weeks around the UST curve, the 6.32% is still constructive although higher since before the payroll number. In the context of a trailing 52-week average of 6.84% and a 52-week range of 6.08% to 7.79%, the current levels mark progress for builders with their buydown strategies, but rates are still tough on existing home sales activities (see New Home Sales Aug 2024: Waiting Game on Mortgages or Supply? 9-25-24, Existing Homes Sales Aug 2024: Mortgages Still Rule 9-19-24).
We also detail the Freddie Mac 30Y for two historical comps. We use the end of 2005 to mark the peak homebuilding year and mid-2006 to highlight a period when the RMBS quality problems and related bubble risks were starting to creep into the market. Rates had moved higher into 2006 from 2005, further pressuring asset quality and consumer strain on reset structures. That was before it all started to unravel in the summer of 2007 and almost nuke the global banking system in Sept 2008.
We add a UST curve for each of these dates, and the differential is supposed to signal the ability of the current market to get into the 5% handle range at some point for 30Y mortgages. One material threat could be the tariff-related inflation pressures and the question of whether that would undermine the 10Y UST and how that flows into the 30Y mortgage rate. We already discussed those UST rate challenges.

The above chart is one we don’t typically follow, but with the -50 bps cut starting to come into play on the fed funds relationship vs. 3M UST we thought it worth a look. The FOMC is in effect controlling the front end. The market controls the long end.
We see the erratic ratcheting of the fed funds vs. 3M UST inversion across the tightening cycle as 2022 and early 2023 phased in higher rates. The short UST rates have a long way to go to return the 3M UST to a remotely normal relationship with the 5Y or 10Y and thus encouraging more investors to extend out the curve and take materially more risk whether duration risk or credit risk.

The above chart is the usual wrap of the weekly yields commentary that breaks out the running UST deltas since March 2022, which was the month ZIRP ended (effective March 17). We also post the 10-19-23 peak and 12-31-20 UST curves as frames of reference. That was a very busy period across a bear flattener, a bear inversion, and now into a slow downshift with a steepening flavor in the 2Y to 10Y/30Y.
We see a lot of wood to chop in that 3M UST number that should start to encourage more redeployment of cash into higher risk assets once the election is done and we can at least identify the moving parts at the Fed and in the UST funding plan.
More importantly, we presumably will get some clarity on the questions around how the tariff policies will play out. At this point, Trump’s tariff details and his factually incorrect and conceptually legless and often erratic and inconsistent commentary has crossed from the extremes of rhetoric into starting to look destructive and delusional.
See also:
Footnotes & Flashbacks: Asset Returns 10-12-24
CPI Sept 2024: Warm Blooded, Not Hot 10-10-24
HY OAS Lows Memory Lane: 2024, 2007, and 1997 10-8-24
Footnotes & Flashbacks: Credit Markets 10-7-24
Footnotes & Flashbacks: State of Yields 10-6-24
Footnotes & Flashbacks: Asset Returns 10-6-24
Mini Market Lookback: Cracking the 300 Line in HY 10-5-24
Payroll Sept 2024: Rushing the Gate 10-4-24
CarMax: Why Do We Watch KMX as a Bellwether? 10-3-24
Credit Returns: Sept YTD and Rolling Months 10-1-24
JOLTS Aug 2024: Openings Up, Hires Down, Layoffs Down, Quits Rate Down 10-1-24
Footnotes & Flashbacks: Credit Markets 9-30-24
Footnotes & Flashbacks: Asset Returns 9-29-24
Footnotes & Flashbacks: State of Yields 9-29-24
Mini Market Lookback: PCE Tailwinds, GDP Holds Serve 9-28-24
State Level Economic Reality Check: Employment, GDP, Personal Income 9-28-24
PCE Prices Aug 2024: Personal Income & Outlays 9-27-24
KB Home: Steady Growth, Slower Motion 9-26-24
Durable Goods Aug 2024: Waiting Game 9-26-24
2Q24 GDP: Final Estimate and Revision Deltas 9-26-24
New Home Sales Aug 2024: Waiting Game on Mortgages or Supply? 9-25-24
Lennar: Bulletproof Credit Despite Margin Squeeze 9-23-24
Mini Market Lookback: FOMC Week 9-21-24
Credit Crib Note: Service Corp International (SCI) 9-19-24
Existing Homes Sales Aug 2024: Mortgages Still Rule 9-19-24
FOMC Action: Preemptive Strike for Payroll? 9-18-24
Home Starts Aug 2024: Mortgage Rates to Kickstart Hopes Ahead? 9-18-24
Retail Sales: Down to the Wire? 9-17-24
Credit Crib Note: United Rentals (URI) 9-16-24
Industrial Production: Aug 2024 Capacity Utilization 9-17-24
Keeping in mind that the upside to HY (from weighted price to par) is much smaller. At what price does high yield become more about the yield/coupon and less about price appreciation?