
Footnotes & Flashbacks: State of Yields 10-6-24
The UST curve rebels and smacks duration after a great payroll number as a bear flattening kicked into gear for a day.


Another -50 bps shouldn’t hurt…bring on the tariffs…
The setbacks for duration with the payroll number on Friday offers a reminder that a good economy can present as many UST curve risks as handicapping supply and demand for record borrowing needs.
This week brings CPI and PPI and the start of earnings season with major banks as usual up at bat first with the next two weeks bringing useful color on the consumer sector, corporate asset quality and updates on real estate.
The market will be bracing for Middle East developments on oil price risks running alongside the countdown to election and the massive gap in policy priorities.
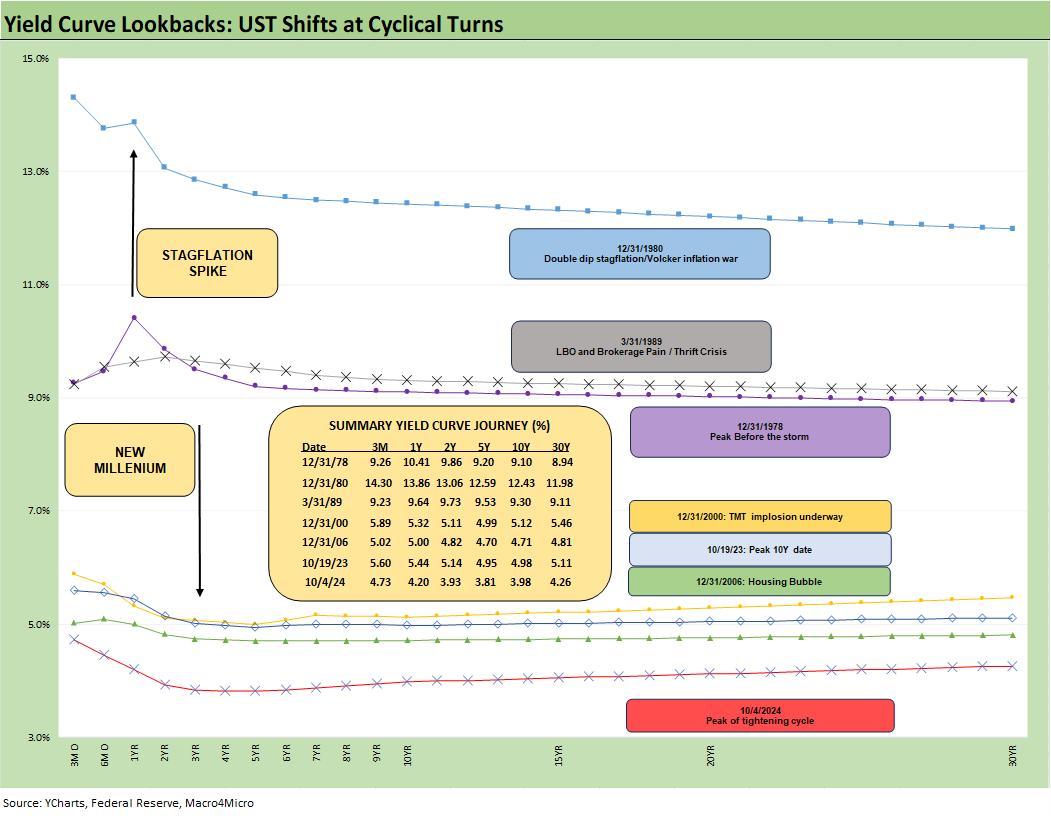
The above chart updates the latest shift for the UST curve as the current shape and level remains below the historical collection of pre-crisis yield curves plotted. The above chart starts back around the Carter inversion of 1978 and then we go on quite a journey. The timeline cuts across a wide range of macro backdrops and cyclical dynamics and monetary regimes.
There is nothing that quite duplicates this latest post-tightening cycle transition into an uncertain level of easing that lies ahead. The 1980-1982 double dip Volcker years was a very different set of conditions on the way to Greenspan taking the helm in 1987.
For the post-crisis (post-2008) period, we only plot two curves for some post-ZIRP context with the 10-19-23 peak 10Y UST detailed and the current UST curve. The visual offers a reminder that history does not provide many comps to what we are looking at today in terms of absolute UST levels or with respect to the front end inversion from the 3M UST to the 5Y and 10Y UST.
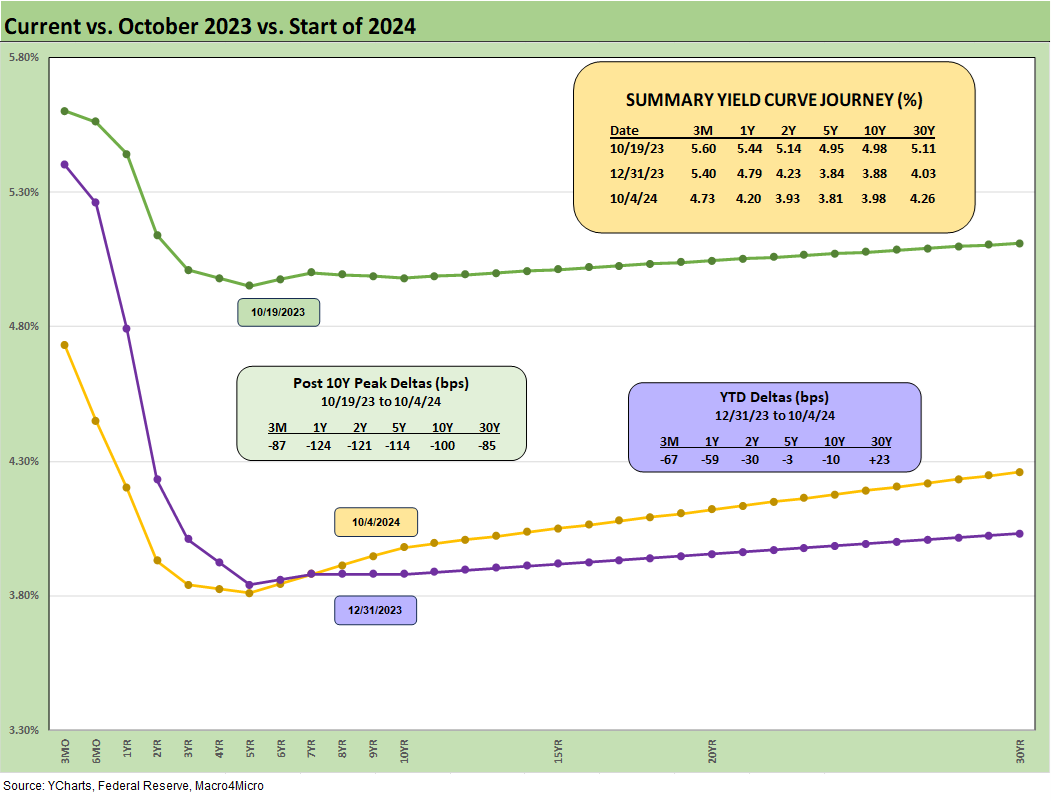
The above chart updates the UST shift from 10-19-23 as the 10Y UST peaked at a hair under the 5.0% line. We also plot the 12-31-23 start date in the current year that went through a stretch of adverse UST moves for bondholders before getting back on the logical path of a downward shift. That is, until this past Friday rattled the expectations cage with a very bullish payroll number (see Payroll Sept 2024: Rushing the Gate 10-4-24).

The above chart is our recurring reminder that the 10Y UST does not have to follow the fed funds number lower or higher. The 12-31-22 and 12-31-23 levels converged despite the 100 bps gap in fed funds, so that is an empirical reminder that a 100 bps rise does not intrinsically move the needle immediately on the 10Y. The flip side of that question is how an inverted curve at such low levels with a -50 cut with a potential -100 bps by year end does not have to offer a sharp move lower in the 10Y along with it.
That steepener vs. flattener trend is a battle that will play out with the combination of inflation trends, FOMC decisions, and how the market reacts to a supply of UST that is certainly not going lower and will need a lot more demand. The idea is that starting a lot of trade battles with some major UST owners (notably China) might not be an aphrodisiac for the demand side.
Meanwhile, when some nations with heavy dollar-based commodities are talking about currency alternatives, such strategies might signal to Trump that threatening them with massive tariffs on their dollar policy might not be a great idea either. That might only make looking outside the dollar more likely.

The above chart is one we already revisited in our earlier posting on the week’s events (see Mini Market Lookback: Cracking the 300 Line in HY 10-5-24). As we cover in the Footnotes commentary on Asset Returns we published earlier today, the bond ETFs all turned up negative this week (see Footnotes & Flashbacks: Asset Returns 10-6-24). That was even the case in HY with its major spread compression move on the week.

The above chart drives home the front end YTD decline in UST rates even with this week’s material move higher detailed in the prior chart. The UST curve spent a good deal of time higher YTD as we have been covering each week until the summer shift lower that has allowed duration to support bond returns and claw back some of the duration hits along the way. As we cover in the separate Footnotes asset returns piece, long duration UST ETF (TLT) has returned over 5% for the rolling 3 months but is still negative YTD at -0.5% with an LTM of over +15% after the bull market run on UST in Nov-Dec 2023.

The above chart shows the UST deltas from the 10-19-23 peak and offers a reminder of how well bonds have done since the peak of the 10Y UST last fall. This timeline saw an impressive bull steepener with a material downward shift across the UST curve. How much juice is left to squeeze out at such low historical rates in the face of a soft landing and record deficits will remain a debate.

We update the Freddie Mac 30Y benchmarks (horizontal lines) above for this past Thursday’s weekly benchmark (priced on Thursdays at noon). We plot the rate for 12-31-05 that marked the end of the peak homebuilding year, and we also plot mid-2006 as RMBS asset quality fears were becoming more prevalent. We also detail the UST curves for each period.
While this past week showed a modest rise in the Freddie Mac rate by Thursday to 6.12% from 6.08% the prior week, the Friday payroll and UST price action meant all bets were off with 6.5% mortgage rates being tossed around in the trade rags on Friday. That is set against a 1-year average of 6.86% and a 52-week range of 6.08 to 7.79%. The homebuilders have prospered at materially higher rates than the current ones, but existing home sales will still face material headwinds.

The above chart updates the 2Y to 10Y again since the 2Y made such a notable move this week and pulled the recent steepening back closer to flat at +5 bps. That minimal upward slope as noted in the chart above is dramatically below the long-term median of +94 bps.

The above chart just shortens up the timeline from the start of 2021 for a more granular view of the wild ride from steep to flat to sharply inverted back to flat and lately to slightly upward sloping.
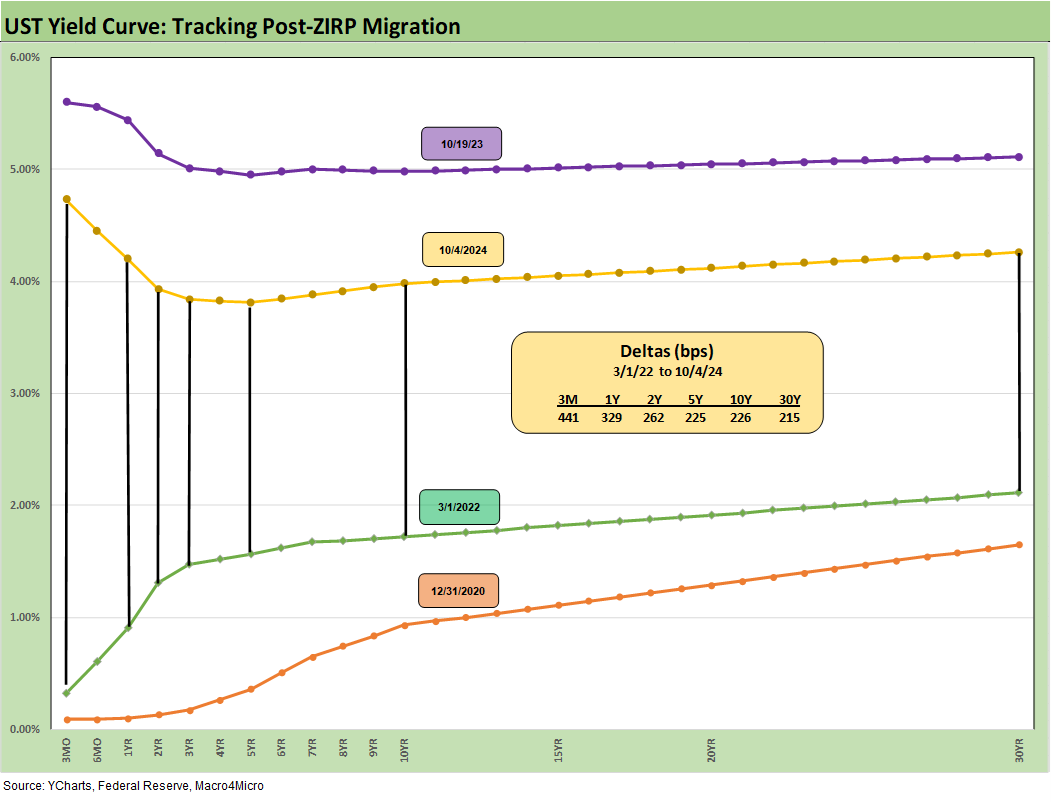
The above chart wraps up the weekly yields review with the UST deltas from the start of March 2022 when ZIRP ended through the end of the past week. These moves all took place within the context of a tightening cycle and continued economic expansion ahead of the recent easing at a +3.0% GDP for 2Q24 (see 2Q24 GDP: Final Estimate and Revision Deltas 9-26-24). We also drop in the 12-31-20 and 10-19-23 UST peak 10Y date for frames of reference. That was a wild ride and there is more to come during an unpredictable shapeshifting period.
Contributors:
Glenn Reynolds, CFA glenn@macro4micro.com
Kevin Chun, CFA kevin@macro4micro.com
See also:
Footnotes & Flashbacks: Asset Returns 10-6-24
Mini Market Lookback: Cracking the 300 Line in HY 10-5-24
Payroll Sept 2024: Rushing the Gate 10-4-24
CarMax: Why Do We Watch KMX as a Bellwether? 10-3-24
Credit Returns: Sept YTD and Rolling Months 10-1-24
JOLTS Aug 2024: Openings Up, Hires Down, Layoffs Down, Quits Rate Down 10-1-24
Footnotes & Flashbacks: Credit Markets 9-30-24
Footnotes & Flashbacks: Asset Returns 9-29-24
Footnotes & Flashbacks: State of Yields 9-29-24
Mini Market Lookback: PCE Tailwinds, GDP Holds Serve 9-28-24
State Level Economic Reality Check: Employment, GDP, Personal Income 9-28-24
PCE Prices Aug 2024: Personal Income & Outlays 9-27-24
KB Home: Steady Growth, Slower Motion 9-26-24
Durable Goods Aug 2024: Waiting Game 9-26-24
2Q24 GDP: Final Estimate and Revision Deltas 9-26-24
New Home Sales Aug 2024: Waiting Game on Mortgages or Supply? 9-25-24
Lennar: Bulletproof Credit Despite Margin Squeeze 9-23-24
Mini Market Lookback: FOMC Week 9-21-24
Credit Crib Note: Service Corp International (SCI) 9-19-24
FOMC Action: Preemptive Strike for Payroll? 9-18-24
Home Starts Aug 2024: Mortgage Rates to Kickstart Hopes Ahead? 9-18-24
Retail Sales: Down to the Wire? 9-17-24
Credit Crib Note: United Rentals (URI) 9-16-24
Industrial Production: Aug 2024 Capacity Utilization 9-17-24
Consumer Sentiment: Inflation Optimism? Split Moods 9-13-24
CPI Aug 2024: Steady Trend Supports Mandate Shift 9-11-24