
Footnotes & Flashbacks: Asset Returns 12-3-23
We update asset returns as equity and debt wrap a very positive 1-month move heavily driven by the UST curve.


Duration, fundamentals, demand for risk has driven debt and equities to what will now end up as a good year barring major setbacks in employment, CPI, Fed misstatement, and dot plot color over a tense two weeks ahead.
The 31 ETF and benchmarks that we track weighed in at 27-4 positive for the week, 30-1 for the trailing month, and 22-9 for the trailing 3-months as asset returns stay on course for a remarkable comeback.
Regional banks have received a major lift from the bull steepener with the Regional Bank ETF (KRE) taking the lead for the week and trailing 1-month even if still mired in last pace for the YTD period.

The above chart updates the running returns for the major debt and equity categories we routinely track. The trailing 1-month, 3-month, and YTD running returns have shifted fairly dramatically over the past 6 weeks with everything now positive after almost everything was negative as of the third week of October. As a frame of reference, the week ended Oct 20 had all the 1-month and 3-month returns in this chart negative with the YTD only showing HY in the black at that point with +3.9% YTF return. What a difference a curve and a good month makes.
The duration winnings have swayed the IG Corporate benchmarks back ahead of a coupon return for the year. The above chart used the Bloomberg Index via YCharts, but using the ICE index we see a par weighted coupon of 6.1% for HY and 4.1% for IG. That sets a bar that both credit asset classes, HY and IG, are now clearing in a year of volatility and a lot of market turmoil. HY cleared it with a lot of room to spare and looked to end the year in line with long-term nominal returns for equities as an asset class. We looked in depth at the UST curve moves and credit spread action in the Yield Footnotes published separately (see Footnotes & Flashbacks: State of Yields 12-3-23).

The above chart updates the 1500 and 3000 series, and again the 1-month and 3-month columns have shifted from almost all negative in late October to almost all positive now. The one positive back for the week ended 10-20-23 was Energy at +9.0% for the rolling 3 months at the time. In the current update, the S&P 1500 Energy is now dead last for the 3-month period as the only negative line at -6.0% and negative YTD at -.09%.
Back in the late October report, 3 of the 6 were negative YTD with Real Estate in last at -9.5%. We now see Real Estate at +4.6% in a 14-point swing. The interest rate X-factor has done wonders for Real Estate and Financials with the latter seeing a positive move of +11.6 points to the current YTD number of +6.4%.
The return snapshot with a quick visual…
We started dropping in the following “box of four” for the time horizons to allow for an easy view of the shape of returns for each period (1-week, 1-month, 3-months, and YTD). We occasionally see all negative or all positive, but we found it to be an easy way to look at the current configuration and how it may have reshaped in just a week. First, we show the box of 4 for this week and then we show one for last week.

We see the rolling return shifting to the left and the highs getting higher. The good news for diversified portfolios of stocks and bonds is that the YTD period shows 24 positive and 7 negatives. We see the chart above and the chart below both showing very strong recent periods bolstering the 4Q23 performance with a single month of numbers left to book still ahead.
We have had some very unusual months in past peak years. We had some notoriously bad 4Q periods such as in 2018 and more narrowly Dec 2018 coming off equity market peaks and HY spread lows. The economic backdrop and UST curve and monetary cycle is in a very different place right now with the first major inflation cycle since the Volcker years.
The Hi-Lo range of the YTD total return differential is over 67 points from #1 to #31. The magnitude of return differential makes a statement with the Tech ETF (XLK) at #1 and Regional Bank ETF (KRE) at #31. If we throw out the Hi and Lo, we still see a Hi-Lo differential of almost 55 points.

Time horizon ETF and benchmark returns…
In our next four asset return charts, we cover 1-week, 1-month, 3-months, and YTD time horizons for a range of ETF and benchmark returns. We look at 31 different benchmarks and ETFs that cut across a wide expanse of the economy.
We recently added 3 more ETFs to the mix, including one for the SPDR S&P Midcap 400 (MDY), one for Emerging Markets Equities (Vanguard FTSE Emerging Markets ETF), and one for the iShares JPM Emerging Market USD Bonds (EMB). We needed some EM representation in EM equities and bonds as well as some benchmark to connect the large caps and small caps.
Midcaps have a wide variety of valuations with growth companies to go with diverse industry groups. Midcaps also have a fair amount of overlap with the HY issuers base and credit intensive sectors generally with less of the narrow issuer distortion that we see in the broad market large caps.
The Magnificent 7 heavy ETFs…
Some benchmarks have a few issuer concentration elements that leave them wagged by a few names. When looking across some of the bellwether industry/subsector ETFs, it is good to keep in mind which narrow ETFs (vs. broad market benchmarks) get wagged more by the “Magnificent 7” including Consumer Discretionary (XLY) with Amazon and Tesla, Tech (XLK) with Microsoft, Apple, and NVIDIA, and Communications Services (XLC) with Alphabet and Meta.

Another bullish week kept the leftward shift going with 27 positive and 4 negative and a very strong week for the Regional Bank ETF (KRE) at #1. Very small negatives did not move the needle much with only the Communications Services ETF (XLC) with Magnificent 7 members Meta and Alphabet both selling off. The 3 other negative returns (DBB, XOP, BIZD) rounded to zero.
The leaders of the week were heavy on interest-sensitive names with KRE, Real Estate (XLRE), Homebuilders (XHB), the long duration 20+ Year UST ETF (TLT) in the top 5 joined by Transport ETF (XTN) that had been a regular laggard in recent months.
Among other notable performances this week was the IG Corporate ETF (LQD) at the bottom of the high quartile as duration was a winner and some spread compression helped a little. On the lower end, Energy (XLE) lagged again with E&P (XOP) second to last and XLE also in the bottom quartile.
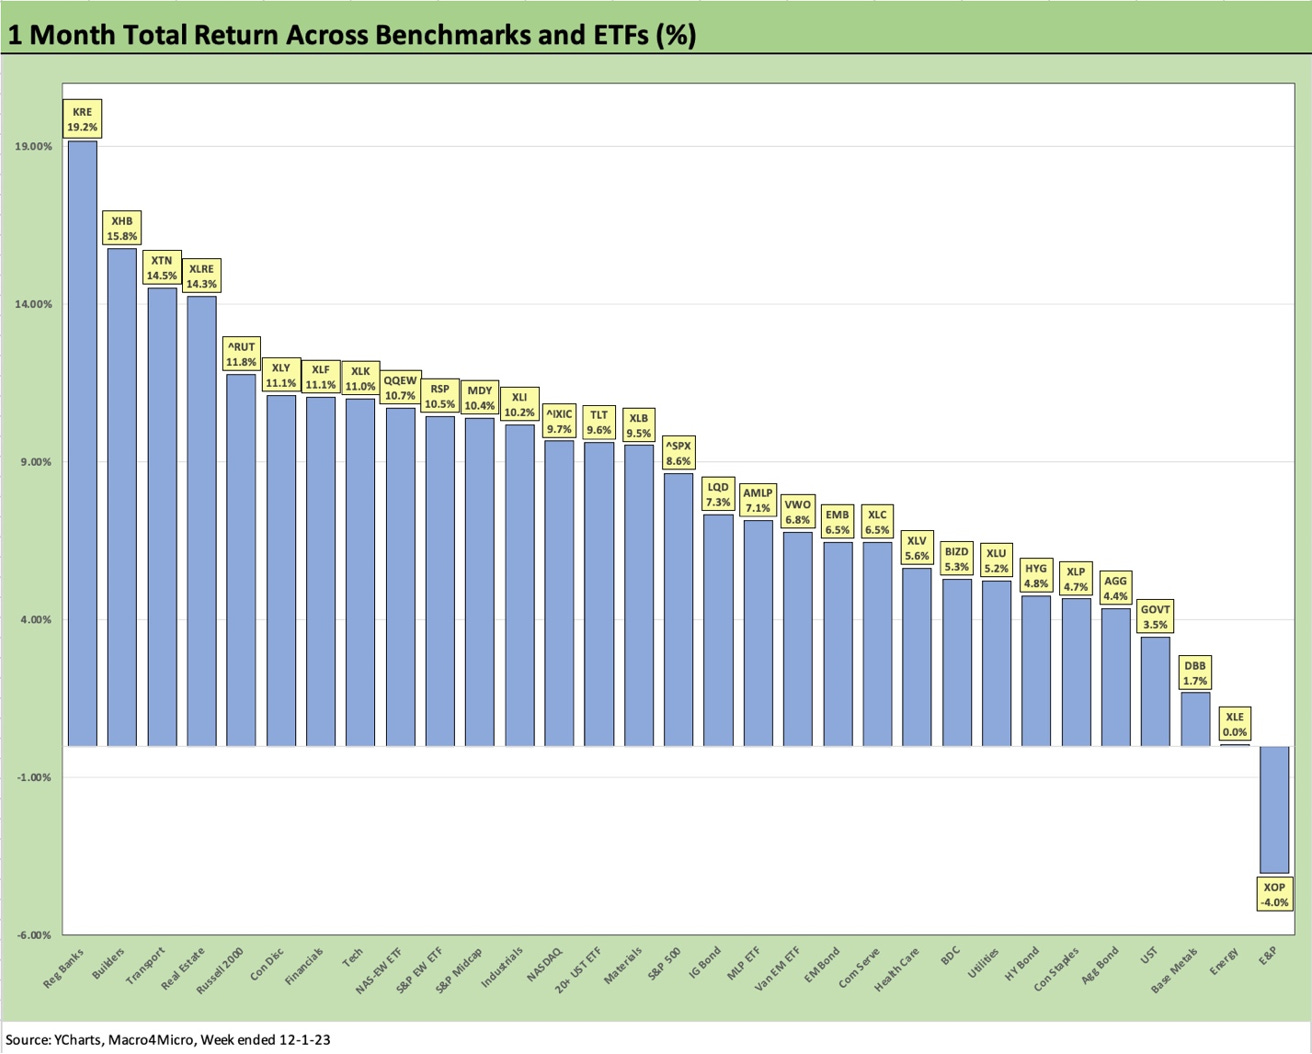
The 1-month return profile is clear enough at 30-1 positive with only the E&P ETF (XOP) in the red with Energy ETF (XLE) barely positive. China headlines are not helping the Base Metals ETF (DBB) much in third off the bottom just below the Agg Bond ETF (AGG) and UST ETF (GOVT).
Despite a strong performance for the month in HY at +4.8%, the equity run was so strong that the HY ETF (HYG) return did not get out of the bottom quartile in a sign of how well stocks did and how important the curve proved to be for the longer duration fixed income ETFs, the 20+ year UST ETF (TLT) at +9.6% and IG Corporates (LQD) at +7.3%. Those are very impressive months for two high quality bond ETFs.
The winners for 1-month generally are a diverse group given how the UST curve drove some sectors to performances that trumped some of the usual winners in Tech and Magnificent 7 heavy ETFs. As with the 1-week numbers, we see Regional Banks (KRE) at #1 with Builders (XHB), Transports (XTN), and Real Estate (XLRE) in the leader ranks.
We saw a very strong stretch for small caps with the Russell 2000 putting up a stellar 11.8% month after being in negative YTD zone as recently as the period ending 11-10-23. The Russell 2000 has now climbed up to the low end of the second quartile as the concentrated equity performance has given way to breadth.

The 3-month time horizon is more mixed since it includes some of the rough periods for the UST curve that also put some pressure on the equity market. We see 22 positive and 9 negative returns in the rankings. The rolling 3-month returns back on Oct 20 had 4 of the ETFs and benchmarks in positive zone (we were using 28 in our universe at the time).
To underscore how quickly this market moved broadly and by individual ETF and subsector, the E&P ETF (XOP) and Energy ETF (XLE) were #1 and #2 in the Oct 20, 2023 trailing 3-month returns. Those same two are now in last place and second to last in the above 3-month rankings.
We highlight the performance of the Midstream ETF in the trailing 3-month at #1 ahead of #2 Tech (XLK) and #3 Regional Banks (KRE) with Financials at #4 feeling the latest tailwinds from the UST curve action. The BDC ETF (BIZD) is in the top quartile for 3 months and on the cusp of top quartile YTD. That is a reminder of cash income returns in the picture with AMLP and BIZD both performing well.

As we covered at the top of the piece, the YTD performance has staged quite a comeback with this last month a key driver. We see a YTD positive advantage of 24-7 with only one ETF in negative double digits in Regional Banks (KRE) at -17.0%. We see 5 of the 7 negative returns in low single digits with interest sensitive Utilities (XLU) in second to last at -7.8%.
In contrast, we see 11 benchmarks and ETFs in double digit positive range. For the YTD period, we see 4 of the Top 5 in Tech or Magnificent 7 categories with homebuilders breaking up the group at #3 for Builders (XHB) at +42.7%.
We highlight that the Equal Weighted S&P 500 (RSP) is over 13 points below the S&P 500 with its Magnificent 7 driven returns of +21.5%. At least the RSP has a shot at a return for the year at or perhaps over the 10% area, which is the long-term nominal return on equities as an asset class. RSP was negative YTD as recently as the 10-27-23 rankings. Another nice comeback there.
Contributors:
Glenn Reynolds, CFA glenn@macro4micro.com
Kevin Chun, CFA kevin@macro4micro.com