
Footnotes & Flashbacks: Asset Returns 2-23-25
We look at asset returns in a week with mild risk repricing that even pushed HY OAS wider.


If Trump asks, tell him you are Ukrainian invaders…he gets his East and West confused…
The past week saw anxiety levels ticking up on multiple fronts as Trump added even more tariff targets from the top US import list, Walmart spooked the market on the consumer, the UMich survey reiterated sharply higher inflation expectations, and housing reported some mediocre numbers (see Housing Starts Jan 2025: Getting Eerie Out There 2-19-25).
EU clearly is in the crosshairs while White House foreign policy has gone full-on pro Putin with an “alternative facts” approach to the largest land war in Europe since WWII. German elections and the AfD noise is bringing back memories of Nazi extremism in Germany (On a side note: we now learn the Sudetenland actually invaded Germany. See Mini Market Lookback: Tariffs + Geopolitics + Human Nature = Risk 2-22-25).
The coming week brings some excitement with NVIDIA earnings, the next round of PCE inflation and some Personal Income and Outlays data for January that is more recent than the 2nd estimate of 4Q24 GDP also due this week.

The above table updates the usual high-level benchmarks for debt and equity asset classes. We line them up within their asset classes (debt, equity) in descending order of 1-year total return. For debt, HY and EM are a tossup over the past year with HY still across the double-digit return line.
The trailing 1-month equity benchmarks were back into negative range for all the line items, but 3-month returns hit the Russell 2000 harder. With some support from the yield curve, the debt benchmarks were positive for 1-month and 3-months but 6-months numbers show the UST setback since the Sept lows when the 10Y UST had bottomed around 3.6%.
The rolling return visual
In the next section, we get into the details of the 32 ETFs and benchmarks for a mix of the trailing periods. Below we offer a condensed 4-chart view for an easy visual on how the mix of positive vs. negative returns shape up. This is a useful exercise we do each week looking for signals across industry groups and asset classes.
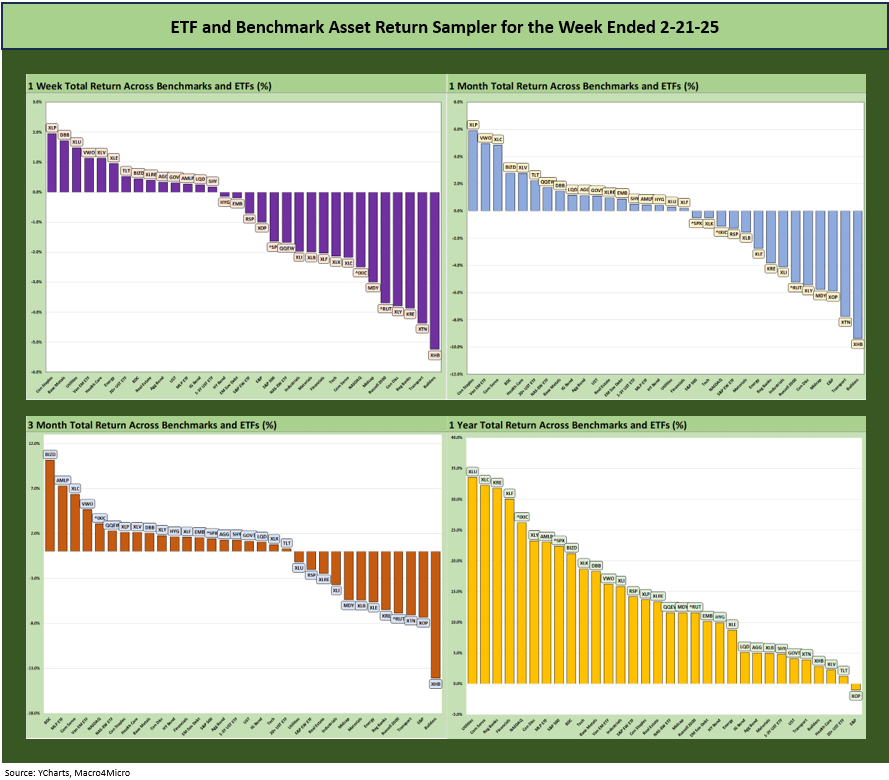
The symmetry of the return charts shows a mixed picture for the 1-week, 1-month and 3-month timeline. It will take some time to shake off the very impressive 2024 equity market performance with its breadth across so many different sectors and industries.
The more material changes await completion of a budget ceiling, a legislative read on UST supply tied to deficits, and more clarity on Trump’s actual tariff implementation plan. On trade and tariffs, the market needs real numbers and timelines and his inevitable backtracking on exemptions (after all, Trump is not exactly consistent in his tariff rhetoric over time).
The advantage of the rationalization that “it is all a negotiation tactic” can ease market anxiety. The flip side is that the “other side of the table” can feel the same way (just a tactic) and call his bluff – if that is in fact a bluff. Then the overlapping of economic damage, personal egos, and national pride kicks in. Since Trump still thinks tariffs are not inflationary and that the “seller pays the tariff,” it is in no way assured that he is bluffing.
There is a reason they call it “game theory” but this is a very risky game. This overlaps with nationalism and the trade partners have political risks to consider also. National leaders of other countries are not a bunch of cowed old white guys, Christian Nationalists, and lapdogs in Congress. When you start insulting entire nations (Canada, Mexico, now the EU), people get their blood up and some angry trade partners can say “go ahead, see what happens.” Since the attack is on 4 major trade partners including China, what happens if they all say “call!”? The 3 fights in 9 seconds after the puck was dropped in the US-Canada game might be a sign.
The Magnificent 7 heavy ETFs…
Some of the benchmarks and industry ETFs we include have issuer concentration elements that leave them wagged by a few names. When looking across some of the bellwether industry and subsector ETFs in the rankings, it is good to keep in mind which narrow ETFs (vs. broad market benchmarks) get wagged more by the “Magnificent 7” including Consumer Discretionary (XLY) with Amazon and Tesla, Tech (XLK) with Microsoft, Apple, and NVIDIA, and Communications Services (XLC) with Alphabet and Meta.
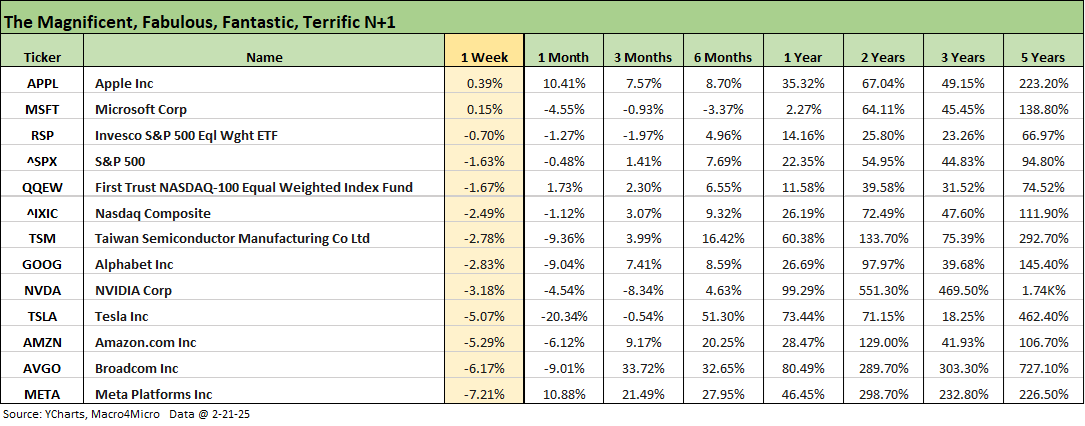
We looked at the tech bellwether numbers in our earlier Mini Market Lookback: Tariffs + Geopolitics + Human Nature = Risk (2-22-25). As we detail further below, the Mag 7 influence on NASDAQ and the S&P 500 sent those benchmarks into the red for the week joined by the Tech ETF (XLK), Communications Services (XLC), Consumer Discretionary (XLY), and the Equal Weight NASDAQ 100 (QQEW), so this was not a week of plenty for the tech investor.
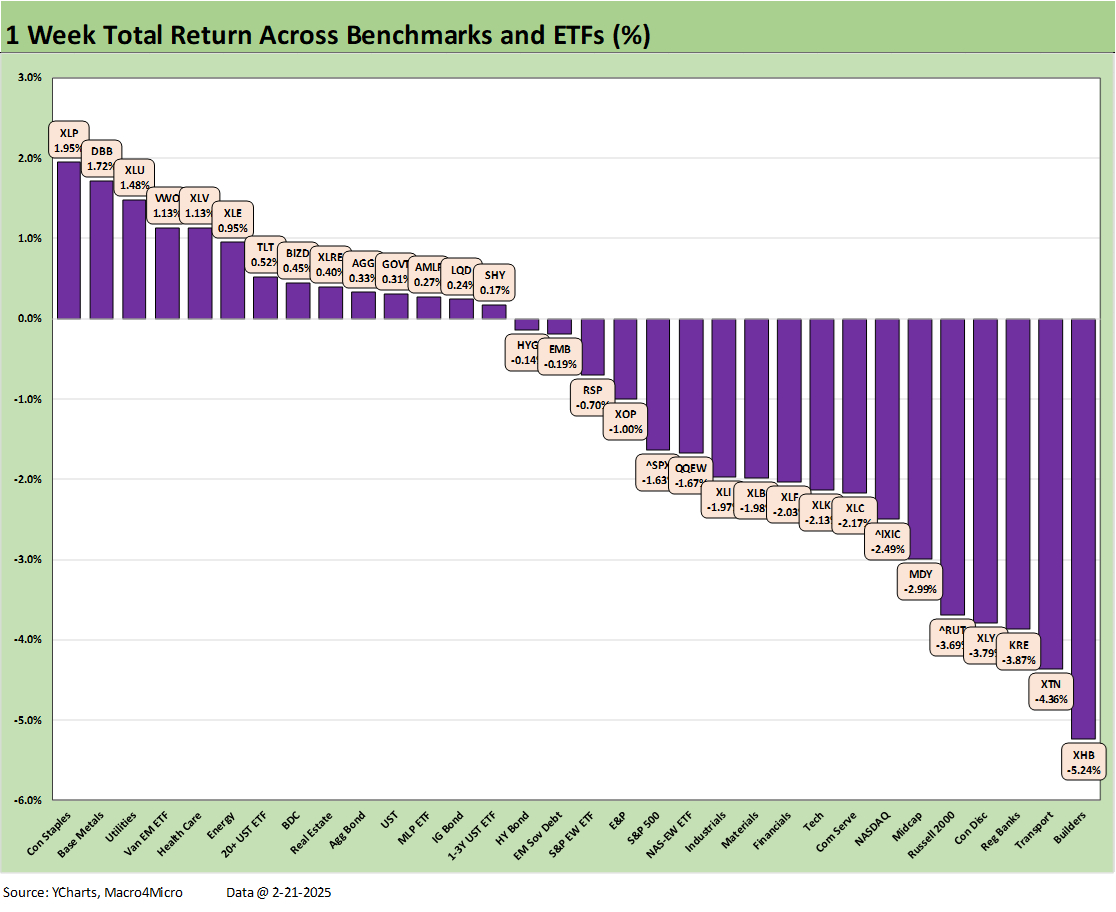
The 1-week score of 14-18 had a negative bias but came with 5 of the 7 bond ETFs in positive range. We see defensive industries such as Consumer Staples (XLP) and Utilities (XLU) near the top. Duration was rewarded with the long duration UST 20+ Year ETF (TLT) in the top quartile.
The recent spate of positive business buzz out of China saw Xi playing nice with the business community and Trump paying renewed respect to Xi. We are in the school of thought that Trump’s end game plays to Russia and China and he knows in an escalation China will not back down. So, his tariff hardball will have limits with China.
In contrast, our theory is that Trump wants to shatter NATO and the EU. With the more favorable tone out of Trump on China and on multiple other fronts, the market saw both EM Equities (VWO) and Base Metals (DBB) turn in a good week and good month in the top quartile. The UST curve move also typically helps EM equities.
Sitting on the bottom this week was Homebuilders (XHB) despite the UST rally as the macro tides are taking their toll on housing with mortgages still high but also a tepid tone out of the industry on the utility of incentive programs lately. The major builders remain rock solid credits (see Toll Brothers 1Q25: Performing with a Net 2-20-25) but the starts numbers and builder confidence indicators did little to reassure (see Housing Starts Jan 2025: Getting Eerie Out There 2-19-25).

As we look back across the 1-month period, we see an 18-14 scoresheet with all 7 bond ETFs positive and the long duration UST 20+Y ETF (TLT) in the top quartile and the other 6 bond ETFs all in the second quartile. We see the defensive Consumer Staples ETF (XLP) at #1 with EM Equities (VWO) at #2 and Base Metals (DBB) again in the top tier.
Homebuilders (XLB) brought up the rear again with Small Caps (RUT) and Midcaps (MDY) sitting on the bottom tier. Materials will often move directionally with homebuilders on rates, but the tariff issues have added a mixed array of factors with steel and aluminum tariff threats raising questions around construction markets (residential to commercial) and how the chemical-heavy Materials ETF (XLB) will play out. On a similar note, the Industrials ETF (XLI) has also had a rough month in the bottom quartile.

With 2 months almost under our belt, we added the YTD returns back into the mix. For the 7 weeks into 2025, we see 26-6 with a mixed bag in the red that includes small caps (RUT) and Midcaps (MDY) in the bottom quartile and Homebuilders ETF (XHB, includes suppliers) sitting on the bottom just ahead of peak selling season. An interesting winner for the YTD period is the income-heavy Midstream Energy ETF (AMLP) with the income-heavy BDC ETF (BIZD) also in the top quartile.
Weak Transports (XTN) and Consumer Discretionary (XLY) combined with negative returns on the US-centric Small Caps (RUT) and Midcaps (MDY) are uninspiring even as new debates on rotation from tech are making the rounds.
We cannot pretend that tariffs are paid by the sellers and just about everything imported into the US seems to be on the menu waiting for the final tariff decisions. One man’s tactical, cunning, mission-driven game theory can be another man’s unfocused, reckless, scattershot, visceral flexing.

The trailing 3-month period includes a choppy December (see Footnotes & Flashbacks: Asset Returns for 2024 1-2-25) but we still see a 20-12 score for the rolling period. Once again, Homebuilders (XHB) are deep into the bottom at -14.1% after running well ahead of the markets into Sept 2024 and stretching realistic valuations.
All 7 bond ETFs came in positive range with the long duration UST 20+Y ETF (TLT) just edging across the line into positive range. The HY bond ETF (HYG) beat its peers but was only positioned in the upper half of the second quartile.
The top quartile has the BDC ETF (BIZD) at the top of the charts at #1 with a 10.1% return. BIZD is riding a high dividend payout (currently 10.3%) and steady performance of the risky credit cycle. Right behind BIZD is the Midstream Energy ETF (AMLP) at #2 with a +7.28% return over 3 months. AMLP has a dividend yield of 7.35%. Communications Services (XLC) was in the #3 position. NASDAQ and the Equal Weight NASDAQ 100 Index (QQEW) also ranked in the top quartile, but the Tech ETF (XLK) was in the third quartile and positive at only +0.8%.

The trailing 1-year has been a dull recap for a while with the main question being whether E&P (XOP) or the long duration UST ETF (TLT) came in last. The bond ETFs posted 3 in the bottom tier and 4 in the third quartile. The top tier was a mix, but 4 of 8 had a Mag 7 influence. Regional Banks (KRE) and Financials (XLF) were steady and in the Top 5.
The top tier saw Utilities (XLU) at #1 with its attributes of steady income and defensiveness but now with rising optimism around a growth story tied to the soaring demand for power. XLU was briefly rattled by the DeepSeek headline setting off a very brief mini-panic around the scale of capex and power demands for AI. That DeepSeek wave settled down quickly with XLU back in the top quartile this week after dropping down to only slightly positive for the trailing 1-month.
See also:
Mini Market Lookback: Tariffs + Geopolitics + Human Nature = Risk 2-22-25
Existing Home Sales Jan 2025: Prices High, Volumes Soft, Inventory Up 2-21-25
AutoNation: Retail Resilient, Captive Finance Growth 2-21-25
Toll Brothers 1Q25: Performing with a Net 2-20-25
Housing Starts Jan 2025: Getting Eerie Out There 2-19-25
Herc Rentals: Swinging a Big Bat 2-18-25
UST Yields: Sept 2024 UST in Historical Context 2-17-25
Footnotes & Flashbacks: Credit Markets 2-17-25
Footnotes & Flashbacks: State of Yields 2-16-25
Footnotes & Flashbacks: Asset Returns 2-16-25
Tariff links:
Reciprocal Tariffs: Weird Science 2-14-25
US-EU Trade: The Final Import/Export Mix 2024 2-11-25
Aluminum and Steel Tariffs: The Target is Canada 2-10-25
US-Mexico Trade: Import/Export Mix for 2024 2-10-25
Trade Exposure: US-Canada Import/Export Mix 2024 2-7-25
US Trade with the World: Import and Export Mix 2-6-25
The Trade Picture: Facts to Respect, Topics to Ponder 2-6-25
Tariffs: Questions to Ponder, Part 1 2-2-25
US-Canada: Tariffs Now More than a Negotiating Tactic 1-9-25
Trade: Oct 2024 Flows, Tariff Countdown 12-5-24
Mexico: Tariffs as the Economic Alamo 11-26-24
Tariff: Target Updates – Canada 11-26-24
Tariffs: The EU Meets the New World…Again…Maybe 10-29-24
Trump, Trade, and Tariffs: Northern Exposure, Canada Risk 10-25-24
Trump at Economic Club of Chicago: Thoughts on Autos 10-17-24
Facts Matter: China Syndrome on Trade 9-10-24